Implications
Paratuberculosis causes economic losses in dairy herds: depending on the stage of disease, infected animals may show decreased milk production, reduced fertility, enhanced risk of culling and, finally, untreatable diarrhea. Presently, the high level of effort needed to eradicate is the main obstacle to farmers taking part in control strategies. This study implies that individual milk production is less diminished in herds with a low prevalence of infected cows than in herds with a high prevalence. Hence, prevalence reduction may be a goal better accepted and more achievable by farmers than disease eradication.
Introduction
Paratuberculosis, or Johne’s disease, is caused by Mycobacterium avium ssp. paratuberculosis (MAP). The true herd prevalence in dairy herds in the United States of America was estimated to be larger than 90% in 2007 (Lombard et al., Reference Lombard, Gardner, Jafarzadeh, Fossler, Harris, Capsel, Wagner and Johnson2013), and for Europe the estimates appeared to be >50% (Nielsen and Toft, Reference Nielsen and Toft2009).
Therapy-resistant aqueous diarrhea and formation of edema because of hypoproteinemia are cardinal symptoms of the end stage of clinical paratuberculosis. A characteristic thickening of the intestinal mucosa, which can be observed during pathological examination, is pathognomonic; as a result, the absorption of nutrients decreases. Milk yield is reduced and the risk of being culled increases in subclinically and clinically infected animals (Tiwari et al., Reference Tiwari, Van Leeuwen, McKenna, Keefe and Barkema2006). Economic losses in MAP-infected cattle herds are significant and could threaten the existence of dairy farmers. Losses in milk yield caused by the disease were proved by surveys based on comparisons between Holstein dairy cows testing positively or testing negatively for MAP (Merkal et al., Reference Merkal, Larsen and Booth1975; Collins and Nordlund, Reference Collins and Nordlund1991; Raizman et al., Reference Raizman, Fetrow and Wells2009). These were supported by studies based on modeling (Ott et al., Reference Ott, Wells and Wagner1999; Chi et al., Reference Chi, VanLeeuwen, Weersink and Keefe2002).
The long incubation period of up to 10 years (Whitlock and Buergelt, Reference Whitlock and Buergelt1996), resulting in a latent, a subclinical and a clinical stage of disease (Coussens, Reference Coussens2001), is a general challenge in studies on the effect of MAP infections. Decreased milk yields have been well documented in cows with clinical paratuberculosis (Beaudeau et al., Reference Beaudeau, Belliard, Ljoly and Seegers2007; Raizman et al., Reference Raizman, Fetrow, Wells, Godden, Oakes and Vazquez2007a). The decrease in milk production in subclinically infected cows depends on the stage of subclinical infection, characterized by the level of shedding (Raizman et al., Reference Raizman, Fetrow, Wells, Godden, Oakes and Vazquez2007a; Smith et al., Reference Smith, Grohn, Pradhan, Whitlock, Van Kessel, Smith, Wolfgang and Schukken2009) or the magnitude of the serological response (Sorge et al., Reference Sorge, Lissemore, Godkin, Hendrick, Wells and Kelton2011; Villarino et al., Reference Villarino, Scott and Jordan2011) and parity (Wilson et al., Reference Wilson, Rossiter, Han and Sears1993; Kudahl et al., Reference Kudahl, Nielsen and Sørensen2004; Beaudeau et al., Reference Beaudeau, Belliard, Ljoly and Seegers2007; Aly et al., Reference Aly, Anderson, Adaska, Jiang and Gardner2010; Sorge et al., Reference Sorge, Lissemore, Godkin, Hendrick, Wells and Kelton2011). Furthermore, the choice of the diagnostic test used influences the estimation of the milk yield deviations because of the MAP infection (Beaudeau et al., Reference Beaudeau, Belliard, Ljoly and Seegers2007; Gonda et al., Reference Gonda, Kirkpatrick, Shook and Collins2007).
Owing to the complexity of factors involved, the outcomes of the studies have been inconsistent. Most of the studies report that subclinically infected cows produce less milk than their negatively tested herd-mates (Wilson et al., Reference Wilson, Rossiter, Han and Sears1993; Beaudeau et al., Reference Beaudeau, Belliard, Ljoly and Seegers2007; Aly et al., Reference Aly, Anderson, Adaska, Jiang and Gardner2010), whereas others report no differences (Johnson et al., Reference Johnson, Kaneene, Gardiner, Lloyd, Sprecher and Coe2001; Pillars et al., Reference Pillars, Bolton and Grooms2011) or even a positive association of positive serological test results with higher milk yield beyond 2 years of age (McNab et al., Reference McNab, Meek, Martin and Duncan1991). Similar inconsistencies were observed concerning the milk components where MAP-infected cows produced less fat and protein per lactation (Gonda et al., Reference Gonda, Kirkpatrick, Shook and Collins2007) or did not (Pillars et al., Reference Pillars, Bolton and Grooms2011). Furthermore, associations between high somatic cell count (SCC) and antibodies to MAP were demonstrated (McNab et al., Reference McNab, Meek, Martin and Duncan1991; Baptista et al., Reference Baptista, Nielsen and Toft2008) or were not found (Gonda et al., Reference Gonda, Kirkpatrick, Shook and Collins2007).
The sensitivity and specificity of the test chosen by a researcher influences the estimation of the milk yield deviations between test-positive and -negative cows. Most studies used either antibody ELISA or fecal culture (FC) or both to identifying MAP-infected cows. When compared with necropsy, the sensitivity of ELISA and FC as the tests most commonly used in living animals are estimated to be ~30% or 60%, respectively (Sweeney et al., Reference Sweeney, Collins, Koets, McGuirk and Roussel2012). If the applied diagnostic method shows a low sensitivity, infected animals could be classified as negative and the comparison value decreased (McKenna et al., Reference McKenna, Keefe, Tiwari, VanLeeuwen and Barkema2006), which is why FC-positive (FC+) cows demonstrated consistently larger effects on milk yield, milk components and SCC than ELISA-positive cows (Gonda et al., Reference Gonda, Kirkpatrick, Shook and Collins2007). In contrast, the use of a high-sensitivity diagnostic method may identify cows as infected in an earlier stage of disease with a less pronounced milk yield depression, which may lead to lower estimates of the milk yield difference for the FC method (Aly et al., Reference Aly, Anderson, Adaska, Jiang and Gardner2010).
Owing to the higher test sensitivity and the test specificity (>99%), studies on subclinical impacts, as determined by identification of the organism, are less susceptible to misclassification bias than those using identification on antibody response (McKenna et al., Reference McKenna, Keefe, Tiwari, VanLeeuwen and Barkema2006). At present, in FC-based studies on milk yield reduction because of paratuberculosis (Wilson et al., Reference Wilson, Rossiter, Han and Sears1993; Raizman et al., Reference Raizman, Fetrow, Wells, Godden, Oakes and Vazquez2007a; Smith et al., Reference Smith, Grohn, Pradhan, Whitlock, Van Kessel, Smith, Wolfgang and Schukken2009; Pillars et al., Reference Pillars, Bolton and Grooms2011), the number of FC+ cases ranges from 25 to 97, coming from 1 to 4 herds, or was not documented (Beaudeau et al., Reference Beaudeau, Belliard, Ljoly and Seegers2007). Some of these studies were able to demonstrate individual influences such as stage of disease or parity on the magnitude of the milk yield depression in subclinically infected cows, but further studies are needed to identify effects at the herd level, such as farm management, or at regional level.
In contrast to the farm management factor, which is very difficult to categorize, the within-herd prevalence (WHP) factor is an objective and easy-to-categorize trait on the herd level. There are marked differences between herds in WHP, and control programs are able to diminish the WHP within several years (Collins et al., Reference Collins, Eggleston and Manning2010). Therefore, the objective of our study was to demonstrate the effect of the WHP as a herd-level factor on the individual milk yield reduction in FC+ compared with FC-negative (FC−) herd-mates. These herd-mates were matched by parity and days in milk (DIM) to minimize the effects of lactation curve and age at the individual level and farm management on the herd level. We hypothesized that WHP influences the individual differences in milk production and SCC of FC+ and FC−.
Material and methods
Study population
All herds included in this study joined the ‘Paratuberculosis Control Program in Thuringian Cattle Herds,’ which is organized by the Thuringian Animal Health Service. The program includes, among other measures, annual screenings of the herd’s cows for MAP by FC, where those cows are tested that have none or negative previous test results. If a cow is detected as FC+, it will not be retested the other year, and culling is recommended as outlined by Sweeney et al. (Reference Sweeney, Collins, Koets, McGuirk and Roussel2012). Of a total of 31 420 cows from 26 Thuringian dairy herds tested for paratuberculosis by FC, a subset of 4627 German Holstein-Friesian cows (1382 FC+, 3245 FC−; Supplementary Table S1) were involved in this survey, which took part within monthly milk recording and possessed a valid milk recording data set. The subset included cases and controls selected as follows:
-
a) Cases: all FC+ with a test-day in the time frame of 25 days before or after fecal sampling.
-
b) Controls: all FC− in the same parity and stage of lactation (±10 DIM) as one case with a milk recording data set at the same test-day as the case.
Fecal samples were collected between January 2008 and June 2011 and tested for MAP by FC. The average number of cows per herd tested was 1208 (211 to 3757). The WHP used in this study was calculated from the results of the annual testing of the cows between January 2008 and June 2011, by dividing the number of FC+ cows by the number of all cows tested as described above (Supplementary Table S2).
The average herd size was calculated from the number of cattle older than 24 months that was reported to the Thuringian Animal Diseases Fund in the years 2009 and 2010 (Supplementary Table S2).
Sample handling
Samples were transported to the laboratory of the Thuringian Animal Health Service by a courier service within 24 h and stored until culturing at −20°C. The identification of each animal was assured by a barcode system. FC was conducted according to the accredited method published in the procedure manual of the Friedrich-Loeffler-Institute (2012). Briefly, 3 g feces were mixed with 30 ml of a 0.75% hexadecyl pyridinium chloride solution (Acros Organics, Fisher Scientific GmbH, Nidderau, Germany) for decontamination. After sedimentation of coarse material for 5 min, 20 ml of the supernatant were decanted, shaken for 30 min at 200 r.p.m. and subsequently incubated for 24 to 48 h at room temperature. Then, the supernatant was discarded and 0.2 ml of the sediment were inoculated onto a commercial Herrold’s Egg Yolk Culture Medium with Mycobactin J, Amphotericin B, Nalidixic acid and Vancomycin (ANV; Becton Dickinson GmbH, Heidelberg, Germany). After culture for 7 days under aerobic conditions at 37°C, tubes were locked airtight and incubated for another 11 weeks. After the 5th week of incubation, the samples were examined for mycobacterial growth every 2 weeks. Differentiation of characteristic colonies was done by Ziehl–Neelsen staining and an IS900-PCR (Englund et al., Reference Englund, Ballagi-Pordaný, Boelska and Johansson1999).
Test-day data
The test-day data records were gathered using two different sources:
-
a) a data backup of the internal management software (HerdeW; dsp Agrosoft GmbH, Ketzin, Germany), supplied by the farmer, or
-
b) a herd-specific data retrieval from the central German database for animal breeding (Vereinigte Informationssysteme Tierhaltung w. V. (VIT), Verden, Germany), permitted by the farmer.
We used the test-day recording within 25 days after or, if not available, before the date of the fecal sampling. The data set included milk yield per day (kg), the percentage of fat, protein and lactose (%) as well as the SCC (1000 cells/ml), the number of lactation and the DIM.
Statistical analysis
Within a mixed model analysis using the mixed and GLM procedures in SAS version 9 (SAS Institute Inc., Cary, NC, USA) the fixed effects of FC status, lactation number, DIM, WHP class of farm and the random effect of farm within WHP class on the milk yield, the milk components and the SCC were analyzed. The lactation number was analyzed using three classes with lactation number 1, number 2 and all other lactations in class 3. To consider the effect of the lactation curve on milk yield, milk components and the SCC, the DIMs were summarized in 8 classes (0 to 30, 31 to 50, 51 to 100, 101 to 150, 151 to 200, 201 to 250, 251 to 300 and >300) and included as fixed effect in the model. Considering the WHP, three prevalence classes were built (Supplementary Table S1):
-
∙ low: WHP up to 5%,
-
∙ medium: WHP between 5% and 10% and
-
∙ high: WHP above 10%.
In the first model the 26 farms were included as random effect class within WHP, which resulted in the following model:
 $$\eqalign{y_{{ijklmn}} =\mu {\plus}{\rm WHP}_{i} {\plus}{\rm DIM}_{j} {\plus}{\rm LN}_{k} {\plus}{\rm MAP}_{l} {\plus}\left( {{\rm WHP}{\times}{\rm MAP}} \right)_{{il}} \cr \quad{\plus}\left( {{\rm DIM}{\times}{\rm LN}} \right)_{{jk}} {\plus}f\left( {{\rm WHP}} \right)_{{im}} {\plus}ei_{{jklmn}} $$
where y ijklmn is the trait measurement; µ the overall mean of trait; WHP i the fixed effect of prevalence class (i=1 to 3); DIM j the fixed effect of class for DIM (j=1 to 8); LN k the fixed effect of class of lactation number (k=1 to 3); MAP l the fixed effect of FC status (positive or negative); (WHP×MAP) il the fixed interaction between WHP class and FC status (DIM×LN) jk the fixed interaction between DIM and lactation; f(WHP) im the random effect of farm nested within WHP class; ei jklmn the random residual effect.
To analyze a possible interaction between farm and FC status, a second model was used excluding the effect of WHP class and including the farm as fixed effect as well as the interaction between farm and FC status. For this analysis, all farms with <50 observations (8 of 26) were excluded (Supplementary Table S3). In this subset, 4381 records remained in the analysis.
Results
WHP
Of the 31 420 cows, in the 26 herds included in this study, 3001 FC+ were detected during January 2008 and June 2011. The resulting WHP ranged from 1.4% to 53.2% with a mean WHP of 9.6%. In relation to their WHP, 11 herds were classified as ‘low,’ 7 as ‘medium’ and 8 as ‘high’ (Supplementary Table S2).
Mixed model analysis: association of MAP status and prevalence class
The FC status had a significant influence on the milk yield. Milk yield was lower in FC+ cows compared with FC− cows. Moreover, FC+ (3.41%) had a lower (P=0.016) milk protein percentage than FC− (3.44%). There was no significant association between FC status and milk fat percentage. Lactose concentration was lower in FC+ cows compared with FC- cows (Table 1).
Least square (LS) means for recorded test-day data of fecal culture (FC)-positive and FC-negative cows

1 Mycobacterium avium spp. paratuberculosis (MAP) FC-negative cows.
2 MAP FC-positive cows.
3 Mixed model with random farm effect and fixed effects of MAP status, lactation number, days in milk, prevalence class of farm and interaction between MAP status and prevalence class, and interaction between days in milk and lactation.
4 Log transformed somatic cell count (SCC).
5 Back-transformed LS mean of FC− cows’ SCC: 46 000 cells/ml.
6 Back-transformed LS mean of FC+ cows’ SCC: 45 000 cells/ml.
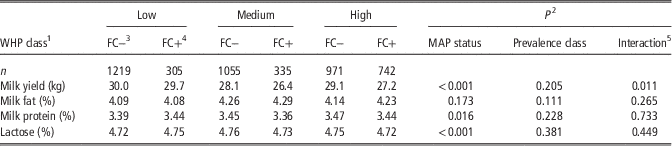
The magnitude of the milk yield depression on individual cows increased with an increasing WHP (P=0.011). No association was found between WHP and milk components. In the WHP classes ‘Medium’ and ‘High’ lower mean milk yields were estimated for FC+ cows (Table 2).
Effects of individual MAP status and prevalence class on milk yield, milk fat percentage, milk protein percentage and lactose percentage in milk in fecal culture (FC)-positive and FC-negative cows

1 Within-herd prevalence (WHP) class: low, prevalence up to 5%; medium, prevalence 5% to 10%; high, prevalence above 10%.
2 Mixed model with random farm effect and fixed effects of Mycobacterium avium spp. paratuberculosis (MAP) status, lactation number, days in milk, prevalence class of farm and interaction between MAP status and WHP class, and interaction between days in milk and lactation.
3 MAP FC-negative cows.
4 MAP FC-positive cows.
5 Interaction between MAP status and WHP class.
Mixed model analysis: association of MAP status and farm
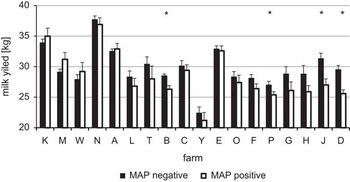
Regarding farm, a significant interaction of FC status and farm was found for the test-day milk yield (P=0.004) and milk protein percentage (P=0.007), respectively. In four herds (B, D, J and P), FC status was associated with milk yield (P<0.001, P<0.001, P=0.001 and P=0.035, respectively; Supplementary Table S3; Figure 1).
Least square mean (LS mean)±s.e. of test-day milk yield of fecal culture (FC)-positive and FC-negative cows in 18 herds with more than 50 observations. Significant different LS means of FC-positive and FC-negative cows (P<0.05) marked with *; farms ordered from left to right according to increasing within-herd prevalence.

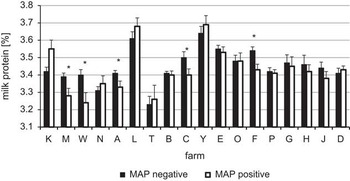
In five herds (A, C, F, M and W), FC status was associated with milk yield (P=0.029, P=0.033, P=0.006, P=0.020 and P=0.015, respectively; Figure 2). The interaction of FC status and farm tended to influence lactose percentage (P=0.055), and there was no significant association with milk fat percentage (P=0.265).
Least square mean (LS mean)±s.e. of test-day milk protein percentage of fecal culture (FC)-positive and FC-negative cows in 18 herds with more than 50 observations. Significant different LS means of FC-positive and FC-negative cows (P<0.05) marked with *; farms ordered from left to right according to increasing within-herd prevalence.

Discussion
In the present study, milk yield data comprised FC+ and FC− cows from 26 dairy herds. Using a mixed model with fixed interaction between WHP class and FC status and random effect of farm nested within WHP, we were able to substantiate an influence of WHP on the reduction in milk yield: whereas FC+ cows from herds with medium or high WHP showed a pronounced reduction in milk yield, there was nearly no difference in milk yield between FC+ and FC− cows in herds with low WHP.
This finding is of significant importance for the implementation of control measures in affected dairy herds, because the majority of existent control programs in different countries and regions act on a voluntary basis, with farmers basing their decision to participate primarily on the expected economic benefit. Most of the benefit can result from the prevention of a milk yield depression in infected cows. In this study, we found 1.3 kg lower mean milk yield in FC+ compared with FC− cows. This effect is more pronounced in herds with high WHP where FC+ cows showed a milk yield depression of 1.9 kg or 7%. Our results show that a large impact on milk yield, and thus improved economic efficiency, in MAP-positive dairy herds can be achieved through the reduction in WHP rather than the eradication of the disease. This is a much more realistic goal and is achievable in a shorter time. Collins et al. (Reference Collins, Eggleston and Manning2010) reported a significant reduction in WHP from 11.6% at the beginning of their longitudinal study to 5.6% after 6 years. Communicating to farmers that economic goals may be more achievable by a focus on WHP reduction may motivate them to implement control measures against paratuberculosis in their herds.
Therefore, our study is the first one that shows a significant influence of WHP on the milk yield reduction in a large-scale study with 1382 FC+ cases. Previous culture-based studies characterizing milk yield reduction in Holstein herds have been conducted in one to four American herds with far less numbers (n⩽97) of FC+ cases (Johnson et al., Reference Johnson, Kaneene, Gardiner, Lloyd, Sprecher and Coe2001; Raizman et al., Reference Raizman, Fetrow, Wells, Godden, Oakes and Vazquez2007a; Smith et al., Reference Smith, Grohn, Pradhan, Whitlock, Van Kessel, Smith, Wolfgang and Schukken2009; Pillars et al., Reference Pillars, Bolton and Grooms2011). In the study by Raizman et al. (Reference Raizman, Fetrow, Wells, Godden, Oakes and Vazquez2007a), the use of bovine somatotrophin (bST) from 60 to 90 day postpartum to 200 days post-conception definitely influenced the milk production. In contrast, our investigation included a total of 26 German Holstein herds without any application of bST. Whereas existing studies did not question herd-level impact factors, our study enabled the examination of WHP on the milk yield reduction.
A possible explanation why a different WHP is associated with variations in milk yield may be the infection pressure: in high-prevalence herds calves are exposed to a higher amount of MAP owing to more cows shedding the infectious agent. Therefore, the probability to become infected increases as well as the amount of ingested bacteria, which probably leads to a more rapid progression of the disease, resulting in an earlier outcome of clinical signs. This thesis is supported by the results of Mortier et al. (Reference Mortier, Barkema, Bystrom, Illanes, Orsel, Wolf, Atkins and De Buck2013) who found in calves infected with a higher dose of MAP more severe histologic and macroscopic lesions than in calves infected with a low dose. Ott et al. (Reference Ott, Wells and Wagner1999) and Chi et al. (Reference Chi, VanLeeuwen, Weersink and Keefe2002) integrated this suspected connection between WHP and the decrease of milk yield into models for calculating the paratuberculosis-based economic losses. This approach is now confirmed by the results from our field study, which can be used to refine existing models in due consideration of the method-dependent determination of WHP.
The strength of our study is, first, the number of involved herds and individuals, and second the specific selection of the negative herd-mates: the selected subset of 3245 controls of 24 486 FC− included only those cows that were in the same parity and the same stage of lactation (±10 DIM) as the FC+ case, and all cows were German Holstein-Friesian. This way we minimized the complex effects of lactation, feeding, rearing, climate or genetics on milk yield. This is a critical advantage compared with previous studies that analyzed production losses because of MAP infection. In contrast to Pillars et al. (Reference Pillars, Bolton and Grooms2011), who matched their control animals only by age, our matching referred to parity and DIM, which are two of the main factors influencing the milk yield within a herd. Therefore, our case–control study provides a selection of the controls that enabled us to substantiate a significant difference in milk yield in MAP-positive cows. This is in line with the results of other culture-based studies (Wilson et al., Reference Wilson, Rossiter, Han and Sears1993; Raizman et al., Reference Raizman, Fetrow and Wells2009; Smith et al., Reference Smith, Grohn, Pradhan, Whitlock, Van Kessel, Smith, Wolfgang and Schukken2009).
Furthermore, a significant interaction of the FC status and farm was found for the test-day milk yield and milk protein proportion when excluding the effect of WHP class and including the farm as fixed effect, as well as the interaction between farm and FC status. These findings support our field experiences in the framework of the ‘Paratuberculosis Control Program in Thuringian Cattle Herds,’ where differences between farms concerning the milk yield reduction were obvious. The results are in line with those from Nordlund et al. (Reference Nordlund, Goodger, Petetier and Collins1996), who demonstrated similar effects to those detected in our study in 23 dairy herds with 147 ELISA-positive and 1506 ELISA-negative cows with herd-specific differences in the milk yield deviation.
As the interaction between farm and FC status is significantly associated with milk yield, this clearly demonstrates the influence of farm-management practices on the impact of paratuberculosis in herd performance. Whereas a significant association was found in four herds, the other herds showed no differences in milk yield between FC+ and FC− cows. To some extent, this may be caused by the high variability of this trait (Table 1) and the reduced sample size for the within-herd calculation. In various herds (A, K, M, W), FC+ cows had apparently higher least square (LS) means of milk yield than the FC− (Figure 1). The influences of farm management on milk yield are very complex, and this study did not aim to analyze aspects of farm management on milk yield traits. We tried to exclude these effects by use of FC+ and FC− from the same farm in the same parity and in the same stage of lactation.
Milk protein percentage was only lower in the MAP-infected cows that were housed in a herd with a percentage of cows shedding >5% (Table 2). Presumably, this association is caused by the MAP-characteristic pathological processes in the intestinal mucosa, resulting in a diminished nutrient absorption. The milk protein percentage was significantly reduced in five of our herds (A, C, F, M, W) with the largest difference of 0.16% in farm W. Remarkably, three of these five herds with reduced milk protein percentage belonged to the herds with higher LS means for milk yield in FC+ (A, M, W). For reasons currently unknown, in these herds, FC+ were able to maintain milk synthesis at the same level as FC−, but failed to produce milk protein at the same extent compared with the FC−.
In our study, no difference in milk fat percentage was found. This agrees with the results of Nordlund et al. (Reference Nordlund, Goodger, Petetier and Collins1996) and Lombard et al. (Reference Lombard, Garry, McCluskey and Wagner2005). In both these studies, MAP infections affected neither fat percentage nor fat yield. In contrast, Gonda et al. (Reference Gonda, Kirkpatrick, Shook and Collins2007) reported a decrease in fat yield in FC+ and ELISA-positive Holsteins compared with negative controls.
Furthermore, an association between the individual MAP status and the SCC was not detectable. This is in line with the results of Hendrick et al. (Reference Hendrick, Kelton, Leslie, Lissemore, Archambault and Duffield2005), Raizman et al. (Reference Raizman, Wells, Godden, Fetrow and Oakes2007b) and Gonda et al. (Reference Gonda, Kirkpatrick, Shook and Collins2007). In contrast, another study suggested that the occurrence of MAP antibodies, and thereby cows with advanced MAP infections, is associated with a high SCC (Baptista et al., Reference Baptista, Nielsen and Toft2008).
Our results show that loss of milk yield in FC+ increases with an increasing MAP WHP. Considering the significant farm effects, dairy farmers may benefit from the reduction of WHP not only by the reduced number of infected individuals, but also by diminishing the individual losses in milk production per infected cow. For a more exact description of the link between WHP and production losses more extensive studies are needed. However, the well-documented reduction in milk yield should motivate dairy farmers to stamp out paratuberculosis in their herds or, at least, reduce WHP. Although in most of the herds eradication of the infection in a short term is not possible, our results show that even if control measures do not result in eradication of paratuberculosis in a herd, reduction in MAP prevalence will significantly reduce the losses in milk yield.
Acknowledgments
The present study is a part of the ‘Paratuberculosis control program in Thuringian dairy herds’ of the Thuringian Ministry of Social Welfare and Health, which is financed by the Thuringian Animal Disease Compensation Fund. The authors would thank Ute Schau and her team for conducting the fecal culture, Timo Leimbach for the excellent database queries, the veterinarians of the Animal Health Service for collecting the database backups, Grant Morseth for improving the English style, and Elke Kaiser and Katharina Schlotter for their assistance.
Conflicts of Interest
None.
Supplementary material
To view supplementary material for this article, please visit http://dx.doi.org/10.1017/S1751731114000305