Introduction
Wild radish (Raphanus raphanistrum L.) is a facultative winter annual, growing widespread globally and noticeably present in many cropping systems (Holm et al. Reference Holm, Doll, Holm, Pancho and Herberger1997). In the southeastern United States, R. raphanistrum is an economically important weed in winter annual crops such as small grains (Eslami et al. Reference Eslami, Gill, Bellotti and McDonald2006; Norsworthy et al. Reference Norsworthy, Malik, Riley and Bridges2010). Moreover, it is especially troublesome in Brassicaceae crops, including canola (Brassica napus L.) and the new biofuel crop carinata (Brassica carinata A. Braun) (Asaduzzaman et al. Reference Asaduzzaman, Pratley, Luckett, Lemerle and Hanwen2019; Blackshaw et al. Reference Blackshaw, Lemerle, Mailer and Young2002; Seepaul et al. Reference Seepaul, Small, Mulvaney, George, Leon, Paula-Moraes, Geller, Marois and Wright2018).
In winter annual crops, weed scouting and management programs are often less intensive than in summer annual row crops, not necessarily because there is less need, but because there is less perceived value compared to the summer annual crops (Norsworthy et al. Reference Norsworthy, Malik, Riley and Bridges2010). Therefore, development of weed phenology models that could guide weed management without intensive scouting, could facilitate more timely control of R. raphanistrum in these winter annual crops (Schreiber Reference Schreiber1982).
Predictive weed emergence models have often been used by weed scientists to understand weed biology and to encourage more effective and timelier weed control. Weed emergence models have been implemented to optimize control of summer annual weeds (Forcella Reference Forcella1993; Goplen et al. Reference Goplen, Sheaffer, Becker, Moon, Coulter, Breitenbach, Behnken and Gunsolus2018; Masin et al. Reference Masin, Zuin, Archer, Forcella and Zanin2005; Werle et al. Reference Werle, Sandell, Buhler, Hartzler and Lindquist2014b). However, creating an accurate model for R. raphanistrum emergence has been challenging (Walsh et al. Reference Walsh, Forcella, Archer, Eklund, Spafford Jacob, Dodd and Moore2002).
Raphanus raphanistrum seedlings emerge both in fall and spring (Chancellor Reference Chancellor1986; Cici and Van Acker Reference Cici and Van Acker2009; Reeves et al. Reference Reeves, Code and Piggin1981) and consequently grow under different environmental conditions, depending on emergence timing. Although previous studies have explored phenological stage duration while considering multiple R. raphanistrum cohorts, the application of this information may be limited, because the data were not generated with natural seedbanks (Leon and Owen Reference Leon and Owen2004). Most phenology studies of weed cohorts have used uniform seed collected from a limited number of plants, which could limit the characterization of real phenological processes that are influenced by the genetic variation and multiyear composition present in the seedbanks (Norsworthy et al. Reference Norsworthy, Malik, Riley and Bridges2010; Reeves et al. Reference Reeves, Code and Piggin1981). Robust emergence and phenology predictive models must be parameterized using the real variation present in natural seedbanks of R. raphanistrum populations. Although study of weed phenology has been encouraged to understand weed biology and improve management (Ghersa and Holt Reference Ghersa and Holt1995; Tang et al. Reference Tang, Korner, Muraoka, Piao, Shen, Thackeray and Yang2016), few have tried to model the probability of reaching weed phenological stages as done in cumulative seedling emergence and crop phenology models (Akyuz et al. Reference Akyuz, Kandel and Morlock2017; Ashworth et al. Reference Ashworth, Walsh, Flower, Vila-Aiub and Powles2016; Onofri et al. Reference Onofri, Benincasa, Mesgaran and Ritz2018; Piper et al. Reference Piper, Boote, Jones and Grimm1996).
Temperature is perhaps the most widely used parameter to characterize plant growth. For this reason, many models use thermal time to predict emergence or describe plant phenology and growth (Forcella et al. Reference Forcella, Benech Arnold, Sanchez and Ghersa2000; Ghersa and Holt Reference Ghersa and Holt1995). Incorporating additional environmental parameters such as soil moisture and daylength may also improve the predictability of these time-to-event models (Onofri et al. Reference Onofri, Benincasa, Mesgaran and Ritz2018). Crop phenology models are often encountered as growing degree-day (GDD) (i.e., thermal time) calculators in a Web interface; after the time of planting and geographic location are entered, the calculator estimates how many GDDs have accumulated since planting to predict when the crop will flower, produce grain, and reach physiological maturity (Cornell Climate Smart Solutions Program 2019). Predicting phenological development can be simple for plant populations of a single genotype, as commonly observed for crops, but will have increasing irregularities for weed species with high genetic variation (Akyuz et al. Reference Akyuz, Kandel and Morlock2017; Forcella Reference Forcella1993; Leon et al. Reference Leon, Dunne and Gould2020). Also, the time to reach a given phenological stage is a function of emergence timing, which is usually uniform for crops, but not for weeds. For this reason, weed phenology is usually described as a frequency of the population, such as time to 50% flowering (Ghersa and Holt Reference Ghersa and Holt1995; Norsworthy et al. Reference Norsworthy, Malik, Riley and Bridges2010).
Robust models of R. raphanistrum emergence and phenology would find widespread utility globally. Therefore, the objectives were to: (1) describe the pattern of R. raphanistrum emergence, (2) quantify the probability of reaching several target phenology stages during the growing season, and (3) model phenology as a function of emergence timing.
Materials and Methods
Studies of R. raphanistrum emergence and phenology were initiated at the Central Crops Research Station in Clayton, NC, USA (35.66°N, 78.49°W) in September 2017 and 2018. The soil was a Norfolk loamy sand (fine-loamy, kaolinitic, thermic Typic Kanpludult) with pH 4.5 and 1.5% organic matter. The site had been maintained under annual cropping systems of camelina [Camelina sativa (L.) Crantz], grain sorghum [Sorghum bicolor (L.) Moench], and soybean [Glycine max (L.) Merr.]. However, no crop was sown for the duration of the experiment. This was done deliberately to assess the worst-case scenario in which soil temperature and light incidence maximize seedling emergence and R. raphanistrum growth. Furthermore, a crop-free environment allowed characterizing the responses of the weed to the environmental factors of interest without having too many confounding effects resulting from crop presence and management.
The site had a history of persistent R. raphanistrum populations. The area was disked before study initiation to begin with a clean and uniform seedbed and eliminate remaining plant residues before R. raphanistrum emergence. We studied seedling emergence over time, and the phenology progression of four cohorts emerging in (1) September, (2) October, (3) November, and (4) February. For this purpose, six quadrats were established (1 m by 2 m) to monitor seedling emergence and for tracking the phenology of each of the cohorts, for a total of 30 experimental units arranged in a randomized complete block design. Due to a slight slope to the field, each block was oriented perpendicular to the slope. In the seedling emergence quadrats, seedlings were eliminated after counting. For each of the phenology progression quadrats, plants were allowed to grow without removal once emergence was initiated for that cohort. Cohorts were arbitrarily established in relation to when the first emergence event occurred. Thus, Cohort 1 began in September, and Cohorts 2 and 3 were considered initiated 1 and 2 mo after Cohort 1, respectively. However, as no emergence was observed in December and January, Cohort 4 began when seedling emergence resumed in February.
Soil temperature and moisture were monitored every 30 min at 5-cm depth in each field using 12-bit temperature sensors, ECH20 EC-5 soil moisture sensors, and HOBO U30 data loggers (Onset Computer, Bourne, MA). Rainfall, air temperature, and solar radiation were obtained from the research station’s automated weather station, located within 300 m of the experiment.
Seedling Emergence Data Collection
In designated quadrats for emergence, emerged seedlings were counted every 2 wk and hand removed without disturbing the soil surface or with glyphosate at 11.9 g ae L−1 applied with a handheld spray bottle. When no R. raphanistrum had emerged for more than 3 wk at the end of the spring, data collection on emergence ceased.
Phenology Data Collection
Phenology quadrats were maintained weed-free without disturbing the soil surface until seedling emergence was allowed based on the initiation date of each cohort as previously described. Every 2 wk, up to 25 plants were randomly selected and categorized in each quadrat using the following phenological stages: (1) seedling to 10-cm diameter rosette, (2) vegetative growth rosette more than 10-cm wide (late vegetative stage), (3) bolting, (4) first flower, (5) first sign of seed pod development, and (6) first dry seed pods. These stages are all traditionally recognized phenological stages with the addition of a second vegetative category (Norsworthy et al. Reference Norsworthy, Malik, Riley and Bridges2010; Reeves et al. Reference Reeves, Code and Piggin1981). This stage was included as a threshold for successful mechanical or chemical weed management. A target size of 10 cm corresponds with the usual size limit listed on many herbicides, but also corresponds with the relative size when mechanical harrowing or flaming would be most effective (Cahoon Reference Cahoon2016; Culpepper Reference Culpepper2009).
At maturity or after reaching the sixth established phenological stage, pods were collected from each cohort. Seeds were removed from the pods and a 100-seed dry weight was determined.
Modeling
Relative cumulative seedling emergence was calculated as a percent of total emergence over the season per quadrat. The probability of reaching various phenological stages over time was calculated as the percent of each quadrat (25 random plants) at or past each phenological stage. These probabilities over time were modeled as a function of different temporal measures: chronological time (days), thermal time (TT), hydrothermal time (HTT), daylength-dependent thermal time (DTT), and daylength-dependent hydrothermal time (DHTT) (Leon et al. Reference Leon, Izquierdo and Gonzalez-Andujar2015; Onofri et al. Reference Onofri, Benincasa, Mesgaran and Ritz2018). Time accumulation in emergence models began with the day of soil disturbance, but because phenology is a function of emergence, in phenological models time accumulation began on the first date when emerged plants of the cohort were present.
Accumulated TT was calculated daily starting with the day the field was tilled using Equation 1:
 $$TT = \mathop \sum \limits_{i = 1}^n \left( {{T_{{\rm{mean}}}} - {T_{{\rm{base}}}}} \right)$$
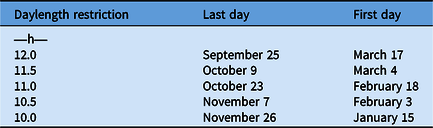
where T mean represents the daily mean soil temperature in C, and T base is the minimum temperature at which R. raphanistrum seeds germinate (i.e., 4.5 C based on Mekenian and Willemsen Reference Mekenian and Willemsen1975; Norsworthy et al. Reference Norsworthy, Malik, Riley and Bridges2010; Reeves et al. Reference Reeves, Code and Piggin1981). TT is considered zero when the daily average temperature equals or drops below 4.5 C. This base temperature was used for calculating TT in emergence and phenology models, because there is no evidence currently that the base temperature for germination of the species should be different from the base temperature for growth. No moisture restriction is consistently reported in the literature on R. raphanistrum, so candidate soil moisture limits from 0.09 m3 m−3 to 0.19 m3 m−3 in increments of 0.01 m3 m−3 were evaluated by finding the lowest water content at which emergence still occurred. Temperature and moisture are usual parameters considered in emergence modeling and also make sense to include for phenological models; however, R. raphanistrum is considered to be a daylength-dependent plant. Therefore, daylength restrictions were also tested from 10 h to 12 h, in half-hour increments, for DTT and DHTT. Finding the daylength restriction was also determined by using the shortest daylength at which phenology still progressed (Table 1). The TT was the base for all other environment-restricted measures of time. The HTT was calculated as TT for days with moisture content above the base moisture established. The DTT was calculated as TT that accumulated only on days with more hours of light than the established minimum daylength restriction. Similarly, DHTT is an HTT-dependent variable. The probability (i.e., frequency) of each phenological stage of all cohorts were modeled as a function of chronological (days since emergence of cohort), TT, HTT, DTT, and DHTT.
Possible daylength restrictions and corresponding cutoff dates for the experimental location in Clayton, NC.

Sigmoidal, Gompertz, and Weibull models were evaluated for best fit of each temporal measure (days, TT, HTT, DTT, DHTT) of emergence and each phenological stage (late vegetative stage, bolting, flowering, and pod set). Models were fit to data from four randomly selected replications of each year using PROC NLMIXED and PROC REG in SAS (SAS Institute, Cary, NC, USA). Best fit was determined by comparing Akaike’s information criterion (AIC) and root mean-square error (RMSE). After the best equation was selected for each stage of each temporal measure, these models were evaluated with the remaining two replications, observations that were not used in creating the models, for validation. Validation of the models was done by running regression (PROC REG) of the predicted values from the model with the observed values of the validation data set.
Results and Discussion
Emergence Pattern
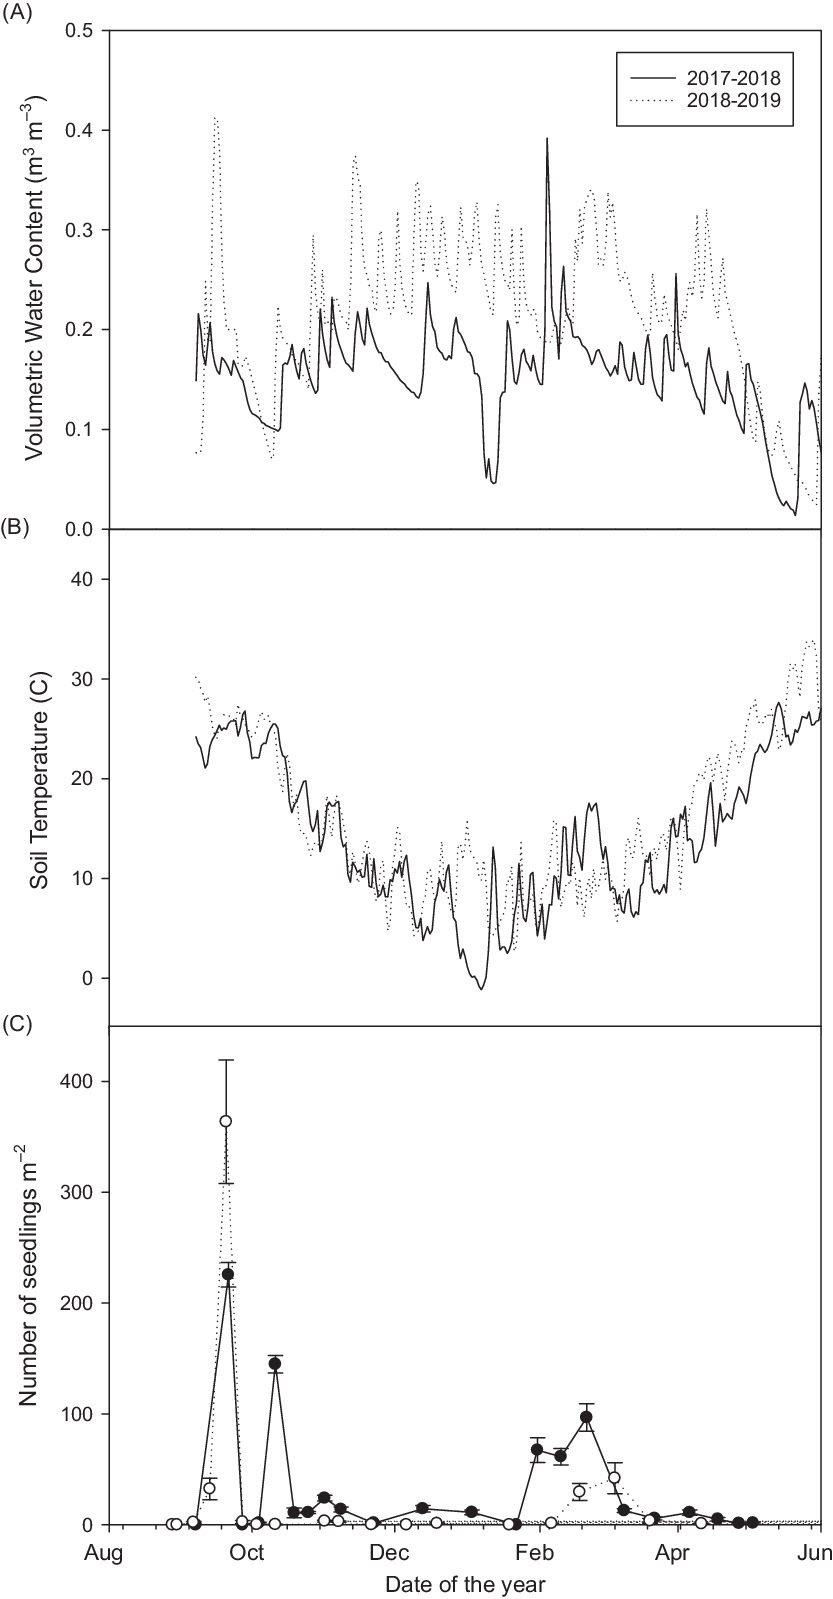
In fall 2017, emergence began in the second week of September, within a week of soil preparation (Figure 1). Emergence continued throughout autumn but slowed as temperature decreased. In late January and early February, a second phase of emergence was observed, and emergence continued through spring. As temperatures increased, emergence slowed and ceased before June (Figure 1A).
Environmental conditions and Raphanus raphanistrum seedling emergence events for 2017–2018 (solid lines) and 2018–2019 (dashed lines) at the experimental site in Clayton, NC: (A) soil water content, (B) soil temperature, and (C) seedling emergence from August to June. Error bars represent the standard error of the mean.

In fall 2018, after soil preparation, soil volumetric water content was less than 10% (Figure 1B). Hurricane Florence brought rain on September 11. The emergence that followed was twice the magnitude of the previous year (Figure 1C), and this difference affected the overall cumulative emergence at the end of the season. In late February, a second phase of emergence was observed, but less than half the magnitude of the 2017 to 2018 season. Over the course of the experiment, seedling density was 592 ± 50 plants m−2. The lowest volumetric water content at which emergence still occurred was 0.13 m3 m−3, which was then used for the base moisture in the HTT.
Emergence Model Selection and Fitness
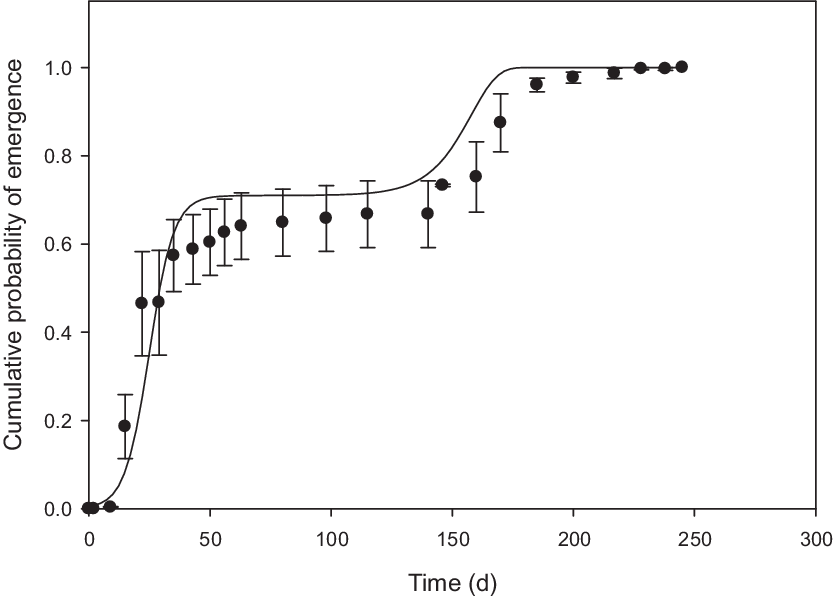
The emergence pattern of R. raphanistrum in both years exhibited two distinct phases and did not fit the sigmoidal equations that are traditionally used to describe weed emergence patterns. This biphasic pattern was observed for all chronological, thermal, and hydrothermal time. Consequently, we modeled the two phases separately for all temporal measures. This required each phase to be fit to the aforementioned equations separately and then spliced together, resulting in the sigmoidal + Weibull Equation 2:
 $$y = {\frac{{\aqrm{\alpha }}}\over{{1 + {e^{ - \left( {\frac{{x - \beta }}\over{\gamma }} \right)}}}} }+ \left( {1 - {\aqrm{\alpha }}} \right)\left( {1 - {e^{ - {\displaystyle{\left| {\frac{\displaystyle{x - \delta + ln{2^{\frac{1}\over{\omega }}}}}\over{\varepsilon }} \right|}^\omega }}}} \right)$$
where y is the relative cumulative emergence for time expressed as x, α is the maximum relative cumulative emergence of the first asymptote (i.e., first emergence phase), β is the lag period of the first phase curve, γ is the rate of increase of the first phase of emergence, ϵ is the rate of increase of the second emergence phase, δ is the time of the lag period of the second phase (i.e., onset of second emergence phase), and ω is a curve-shaping component for the second phase (Figure 2).
Probability of Raphanus raphanistrum seedling emergence as a function of time in days. The solid line represents the best-fit predicted model. Dots represent independent observations for validation, not used in creating the model, and error bars represent the standard error of the mean. Day 0 represents the day of soil preparation with a disk plow.

Based on the criteria for model evaluation, the chronological model for emergence was the simplest model that explained the most variation (Table 2). However, all models had AIC less than −100 and RMSE less than 0.20. The chronological model maintained the lowest RMSE when run with the validation data, but also in all cases RMSE was lower than 0.20. The thermal and hydrothermal models may be adequate at predicting emergence, but the chronological model was the most parsimonious based on the data collected in this study. As can be seen in Figure 1A, moisture was usually abundant, which limits the helpfulness for hydrothermal model over TT. However, TT did not improve fitness, because temperature was also rarely lower than the base temperature (Figure 1B), especially in the 2018 to 2019 season, with a definite reduction in emergence (Figure 1A). Although R. raphanistrum emergence is probably not biologically triggered by chronological time, for simplification purposes, the chronological model was used to adjust emergence timing for the phenological models (see section “Determining Best-Fit Models for Each Stage”). It could be expected that over a wider geography or years with conditions in which temperature and moisture are limiting, the thermal and hydrothermal models, like the ones shown in Table 2, might likely provide a more accurate description of R. raphanistrum emergence.
Comparison of model parameters for chronological, thermal, and hydrothermal time all fit to a sigmoid + Weibull model.

a
Model parameters belong to the following equation:
 $$y = {\frac\displaystyle{{\rm{\alpha }}}\over{\displaystyle{1 + {e^{ - \displaystyle\left( {\frac{{x - \beta }}\over{\gamma }} \right)}}}} }+ \left( {1 - {\rm{\alpha }}} \right)\left( {1 - {e^{ - \displaystyle{{\left| {\frac{{x - \delta + ln{2^{\frac{1}\over{\omega }}}}}\over{\varepsilon }} \right|}^\omega }}}} \right)$$
.
b AIC is the Akaike information criterion used for comparing models. The more negative values are better fit.
c AIC and root mean-square error (RMSE) are calculated with the data used to create the model.
d Validation data are two replicates from 2017 and two replicates of emergence data from 2018. None of the data used in validation were used to create the model.
Emergence Implications
The chronological timeline of R. raphanistrum seedling emergence described in the present study fit the expectation of emergence occurring both in fall and spring (Chancellor Reference Chancellor1986; Cici and Van Acker Reference Cici and Van Acker2009; Reeves et al. Reference Reeves, Code and Piggin1981). However, few biphasic seedling emergence models have been reported in the literature (Leon et al. Reference Leon, Izquierdo and Gonzalez-Andujar2015; Schutte et al. Reference Schutte, Regnier, Harrison, Schmoll, Spokas and Forcella2008), none of which are winter annual species. A study observing 10 winter annual species in Nebraska from August to June were all fit to single-phase sigmoidal models (Werle et al. Reference Werle, Bernards, Arkebauer and Lindquist2014a). Other models to predict winter annual seedling emergence have been limited, but among those, most have been conducted using data for seed germination requirements generated under laboratory conditions (Grundy et al. Reference Grundy, Phelps, Reader and Burton2000) or with seedling counts starting in the middle of winter (e.g., January) (Hill et al. Reference Hill, Renner and Sprague2014). Though laboratory studies or observations beginning in January may miss the important biphasic nature of this and other winter annual weed species, the Nebraska study offers evidence of other weeds in the Brassicaceae family (e.g., field pennycress [Thlaspi arvense L.] and western tansymustard [Descurainia pinnata (Walter) Britton]) fit to single-phase, sigmoidal, hydrothermal models. Unlike most weeds and even other species of Brassicaceae, R. raphanistrum is self-incompatible (Sampson Reference Sampson1964), implying high genetic variability due to obligate outcrossing.
One possible explanation for dual or biphasic emergence timings might be genetically determined dimorphism for dormancy, whereby differential dormancy is physiologically conferred to different seeds from the same mother plant (Holdsworth et al. Reference Holdsworth, Bentsink and Soppe2008; Schatzki et al. Reference Schatzki, Allam, Kloppel, Nagel, Borner and Mollers2013). Common cocklebur (Xanthium strumarium L.) mother plants produce burs within which the seeds reside with differential oxygen permeability, resulting in two different germination behaviors (McHargue Reference McHargue1921). In nature, R. raphanistrum seeds are not easily shattered, but pods will break into segments, serving as another layer of physical dormancy (Cousens et al. Reference Cousens, Young and Tadyyon2010; Mekenian and Willemsen Reference Mekenian and Willemsen1975), so variability in dormancy might occur based on the thickness of the pod wall, which could also be genetically controlled (Tricault et al. Reference Tricault, Matejicek and Darmency2017).
Another possibility could be a physiological maternal effect whereby the environment of the mother plant affects all of the progeny of that plant (Eslami et al. Reference Eslami, Gill and McDonald2010; Jha et al. Reference Jha, Norsworthy, Riley and Bridges2010). Environmental conditions during seed ripening are also important for other Brassicaceae species (Boyd et al. Reference Boyd, Dom, Weining and Schmitt2007; Byers et al. Reference Byers, Platenkamp and Shaw1997). Dormancy and water requirements for germination might be due to water stress experienced by the mother plant during seed ripening (Campbell et al. Reference Campbell, Parker, Blakelock, Pirimova and Mercer2015; Eslami et al. Reference Eslami, Gill and McDonald2010; Taghizadeh et al. Reference Taghizadeh, Nicolas and Cousens2012). Thus, seeds produced in different years with different environmental conditions might comprise a natural seedbank with biphasic emergence patterns.
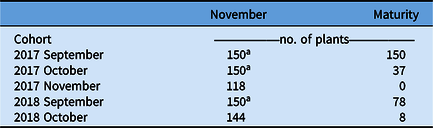
Despite the widespread geographic range that R. raphanistrum inhabits, comparisons of far-ranging populations of R. raphanistrum have shown more genetic variability within populations than among populations (Charbonneau et al. Reference Charbonneau, Tack, Lale, Goldston, Caple, Conner, Barazani, Ziffer-Berger, Dworkin and Conner2017; Han et al. Reference Han, Higashi, Mitsui and Setoguchi2016; Kercher and Conner Reference Kercher and Conner1996; Williams and Conner Reference Williams and Conner2001). This large genetic variability can lead to rapid evolution if a consistent selection pressure is applied over several years (Ashworth et al. Reference Ashworth, Walsh, Flower, Vila-Aiub and Powles2016; Ridley and Ellstrand Reference Ridley and Ellstrand2009). In highly disturbed systems, such as agricultural fields, and especially under weather fluctuations in the winter, a biphasic emergence pattern could be an important survival strategy (Schutte et al. Reference Schutte, Regnier, Harrison, Schmoll, Spokas and Forcella2008), because high mortality rates can occur for individuals emerging past October 25 (Table 3), and resuming emergence in February increases the chance to have plants reach maturity. Alternatively, while mortality over winter is high, surviving plants of the later fall cohort would have a competitive edge in the established winter crop.
Mortality of each cohort population over winter described as the maximum number of plants accounted for in November compared with the number of plants that survived to reach maturity in a 12 m2 area up to 150 plants.

a All quadrats had at least 25 plants for taking measurements; while plants may have died, they were undetectable with our level of sampling.
Phenology Patterns
Four distinct cohorts were tracked from emergence to maturity in separate quadrats, each beginning in a different month. For context, each cohort will be referred by the month and year in which plants were established. For example, the first cohort emerged in September both years and will be referred to as the September 2017 cohort or the September 2018 cohort, respectively. Each cohort had a unique developmental timeline, which will be described separately.
The September 2017 cohort matured quickly, transitioning from the rosette stage to bolting before November, and as temperature decreased, seed pods developed quickly and dried before mid-December. The October 2017 cohort developed into a large rosette but did not progress through the phenological stages as quickly as the September cohort. Over the winter, many plants of the October 2017 cohort died. Initially, each quadrat of October 2017 had more than 25 plants each, resulting in a total of 150 plants randomly staged on a given day. By the time October 2017 began to flower in February, there were only 37 plants left in the sampling quadrats all together (Table 3). The surviving plants had fully matured by May. None of the November 2017 cohort survived to bolting. The low survivability of overwintering cohorts was reported by Norsworthy et al. (Reference Norsworthy, Malik, Riley and Bridges2010) in a similar climate. The February 2018 cohort quickly progressed through the phenological stages and reached dry seed pods by May, weeks behind the October 2017 cohort. The February and October cohort senesced by June.
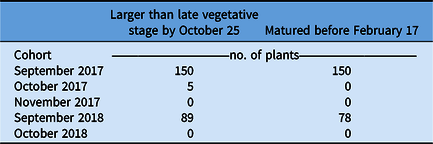
The September 2018 cohort emerged 2 wk later than in 2017 and took greater time to reach maturity. This delay affected the establishment of subsequent cohorts in the 2018 to 2019 season. The September 2018 cohort completed its life cycle before February but had greater mortality before maturation (Table 3). Considering that R. raphanistrum is a long-day plant, it is worth noting that the number of plants that reached late vegetative stage before days were shorter than 11 h (October 23) corresponds with the number of plants that matured before the daylength extended to 11 h or more (February 18) (Tables 1 and 4). Plants smaller than 10-cm-diameter rosettes in October did not produce reproductive structures before February. The October 2018 cohort was also established 2 wk later than 2017 and had greater mortality over the winter (Table 3). In 2018 to 2019, the November and February cohorts failed to establish due to low emergence.
Maturity related to plant size before daylength restriction.

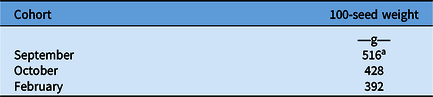
Seed from mature plants in 2017 to 2018 were collected and removed from pods and 100-seed weight was determined (Table 5). The only plants that lived to maturity in 2018 to 2019 did not produce enough seed to collect. Seed harvested from the September 2017 cohort were heavier than seed harvested from the later-emerging cohorts.
Seed weights of Raphanus raphanistrum according to emergence cohort.

a September seed weight is significantly larger than October and February using a t-test with P-values of 0.0005 and <0.0001, respectively.
Phenology Model Selection and Fitness
We modeled phenology as the probability of each cohort to be at or past several critical stages described earlier. Of the plants that survived to produce seed, two cohorts began in the fall (September and October) and one in the spring (February), but only the October cohort overwintered as a rosette before flowering. Part of the phenology model analysis was to determine whether cohorts emerging at different times needed to be modeled separately or whether including the right environmental restrictions could predict time to each stage regardless of when the plants emerged.
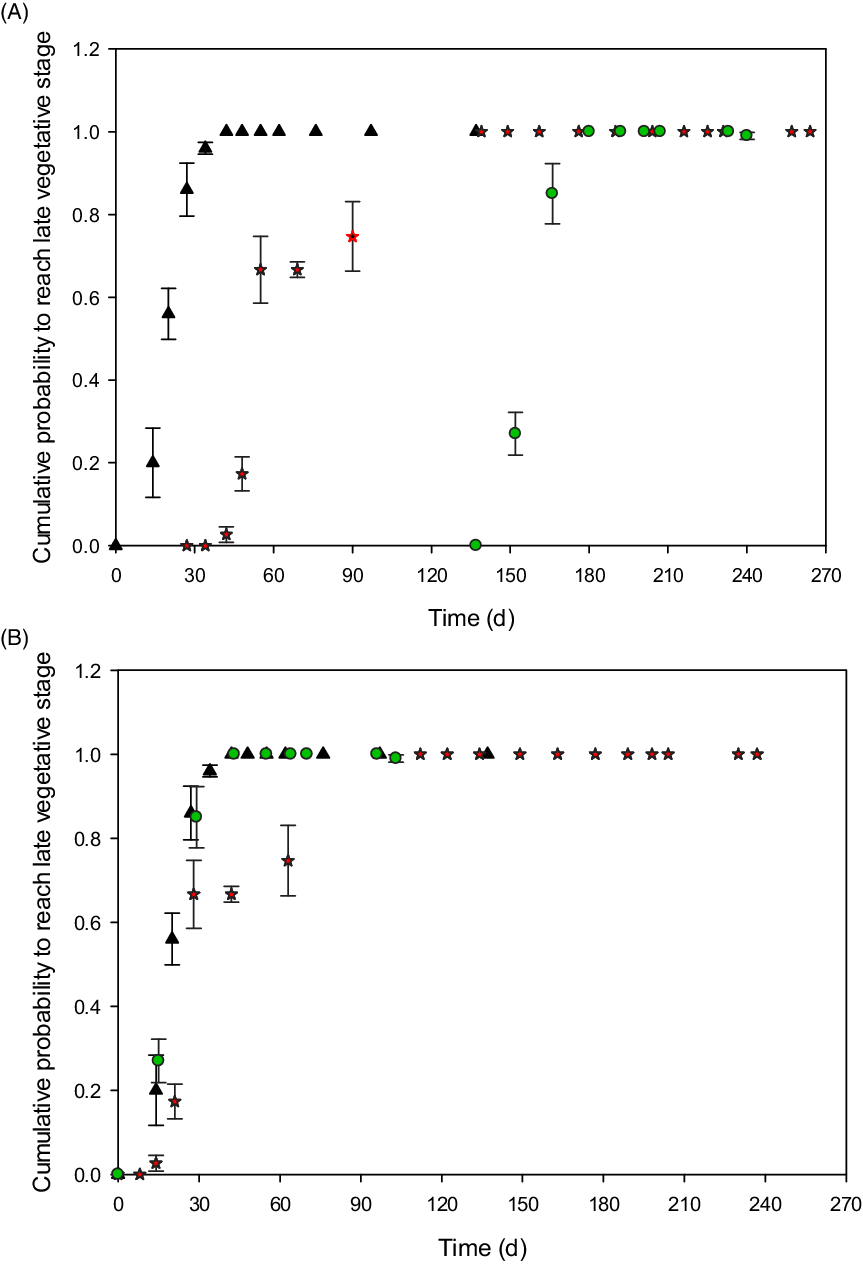
Time to late vegetative stage was represented as the probability of each cohort of reaching that stage over days (Figure 3A). Notice that the overall pattern looks similar for each cohort; thus, we proposed that if phenology progression was modeled as a function of the time for emergence of each cohort, phenology could be consistent across cohorts. Correcting for emergence timing alone brought all three cohorts together to predict the late vegetative stage (Figure 3B).
Probability of Raphanus raphanistrum to reach late vegetative stage as a function of time in days since disking (A) and days adjusted for emergence of each cohort (B): September (black triangles), October (red stars), and February (green circles); bars represent the standard error of the mean (n = 6).

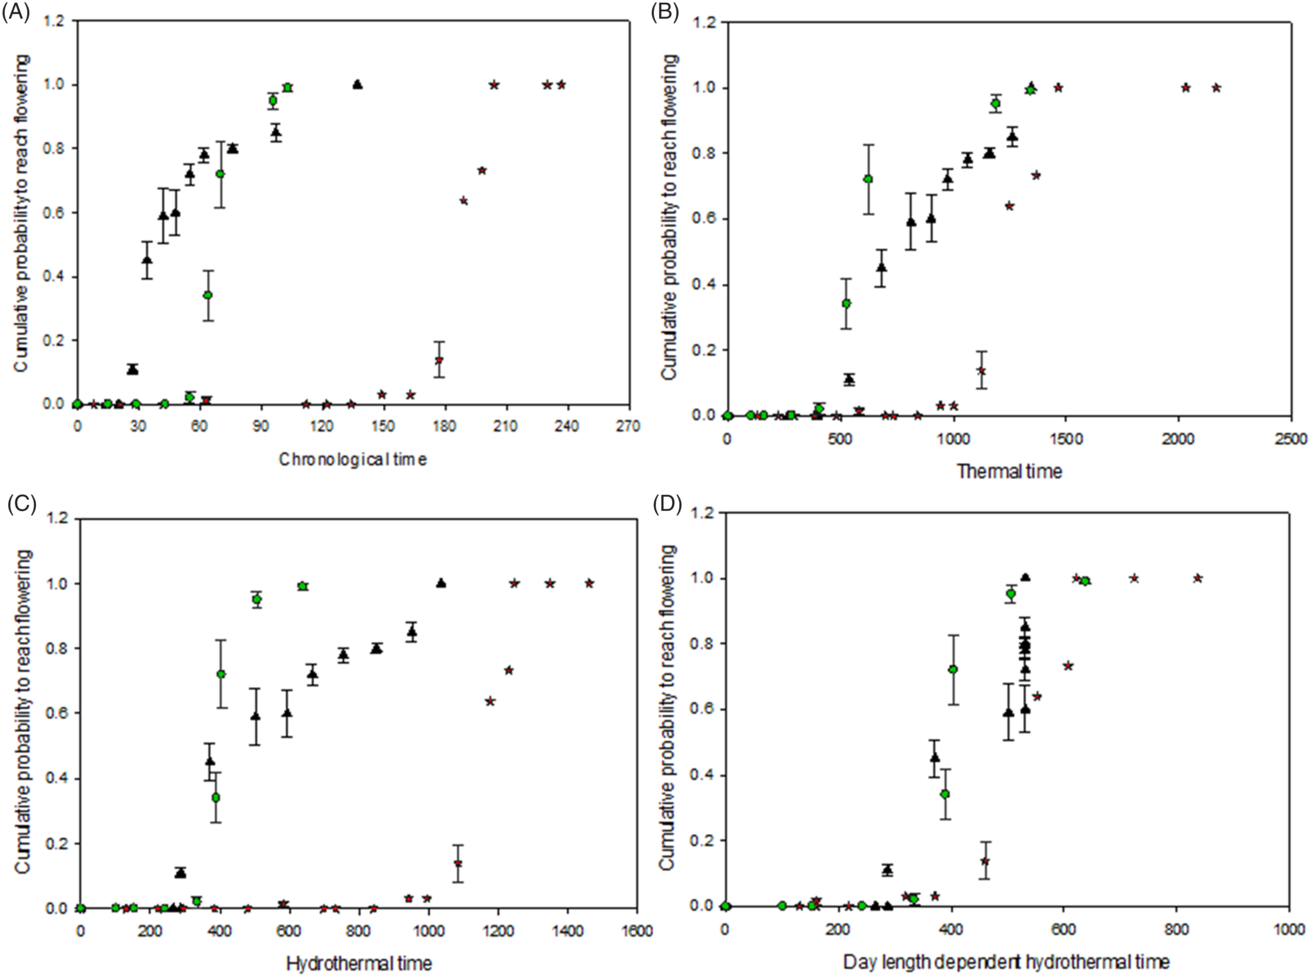
When corrected for emergence, September- and February-emerging cohorts had similar patterns for each phenology stage using chronological, thermal, and hydrothermal times; however, the October cohort had a lag for bud stage and the subsequent stages that could not be accounted for using TT or HTT alone. This is demonstrated in the pattern for time to flowering stage between the cohorts over each temporal measure in Figure 4. While the patterns were similar for the September and February cohorts, the environment during each life cycle is considerably different: cooling temperatures from 30 C to 5 C for the September cohort, compared with warming temperatures from 5 C to 16 C for the February cohort. The October-emerging cohort (i.e., overwintering cohort) had a very different chronological pattern due to several extra months in the rosette stage and, therefore, delayed time to further reproductive stages. Similar to the initial expectations that were laid out in the emergence modeling, chronological models that span time under suboptimal conditions for growth would not be expected to fit the traditional sigmoidal patterns. Using a TT model improved this and brought phenology patterns for all cohorts close together; however, using HTT reintroduced a biphasic pattern for the October cohort (Figure 4B and C). When a daylength restriction of 11 h was added (Figure 4D), the patterns for time to flowering exhibited a similar behavior between cohorts.
Probability of Raphanus raphanistrum to reach flowering for each cohort (September: black triangles; October: red stars; February: green circles; bars represent the standard error of the mean) as a function of different temporal scales: (A) chronological, (B) thermal with base temperature of 4.5 C, (C) hydrothermal with a moisture restriction requiring at least 0.13 m3 m−3, and (D) daylength-dependent hydrothermal time with a restriction requiring at least 11 h of daylight.

Determining Best-Fit Models for Each Stage
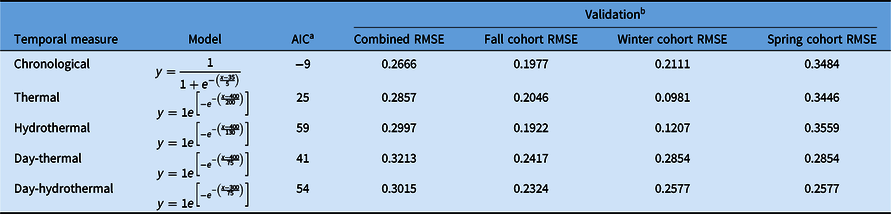
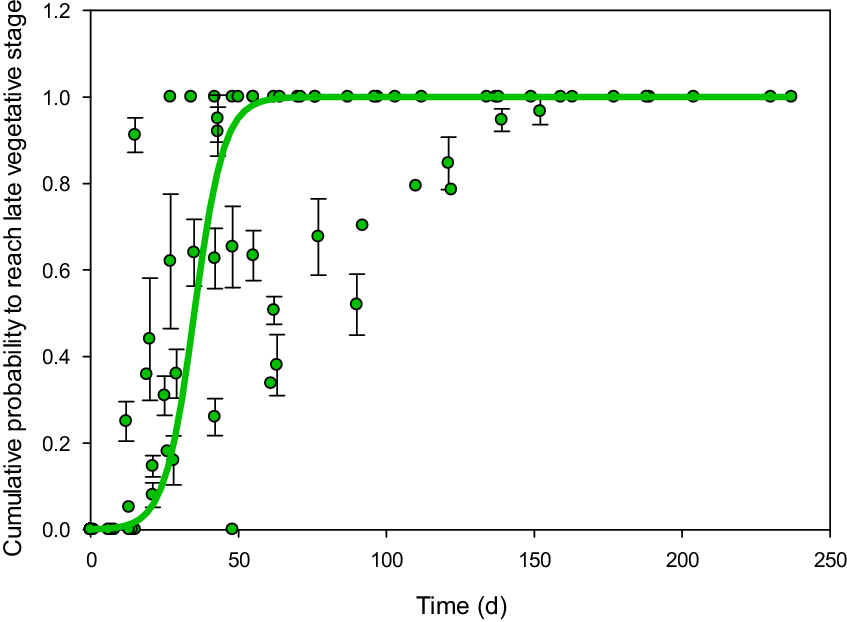
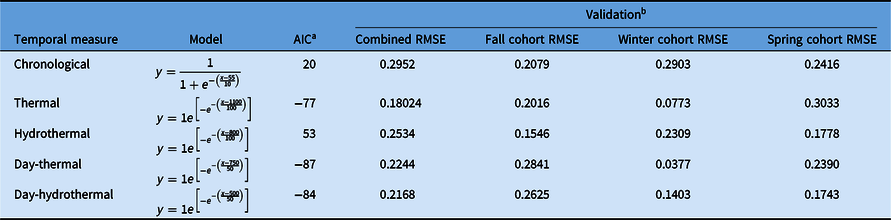
All cohorts were combined, adjusting for day of emergence as time 0 for all, and each stage was modeled separately using each temporal measure to find the most parsimonious model for each stage. The time to the late vegetative stage was similar before including environmental restrictions, as demonstrated in Figure 3B. Therefore, when comparing models that incorporate different additional restrictions, the fit of the model to explain all data worsened (Table 6). The smaller AIC, a relative measure of model quality, indicates which model will be more useful for predictions. The chronological, thermal, and hydrothermal models performed similarly. When looking at the fit of each model for the individual seasons of cohorts, the winter cohorts fit the thermal model better, but collectively the chronological model provided a slightly better prediction for time to late vegetative stage (Figure 5).
Comparison of fitness for best models for each temporal measure to predict the probability to reach the late vegetative stage for several cohorts.

a AIC is the Akaike information criterion used for comparing models. The more negative values are better fit. AIC is calculated with the data used to create the model.
b None of the data used in validation were used to create the model. RMSE, root mean-square error.
Probability of Raphanus raphanistrum to reach late vegetative stage as a function of time in days. The solid line represents the best-fit predicted model. Dots represent independent observations for validation, not used in creating the model, and error bars represent the standard error of the mean.

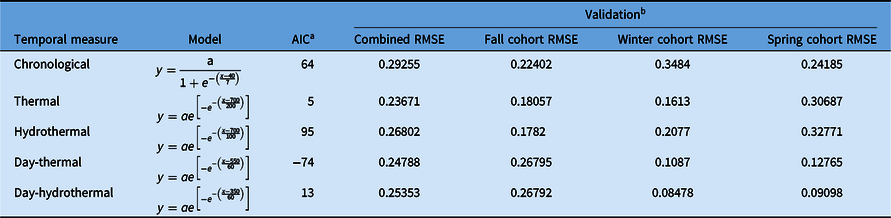
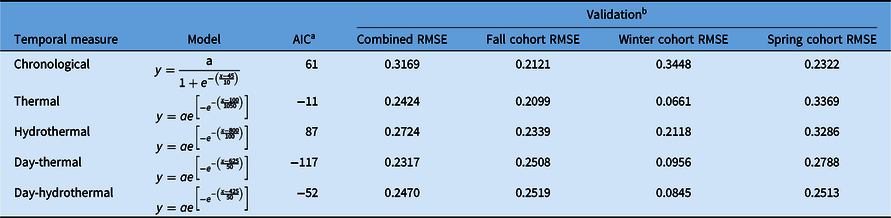
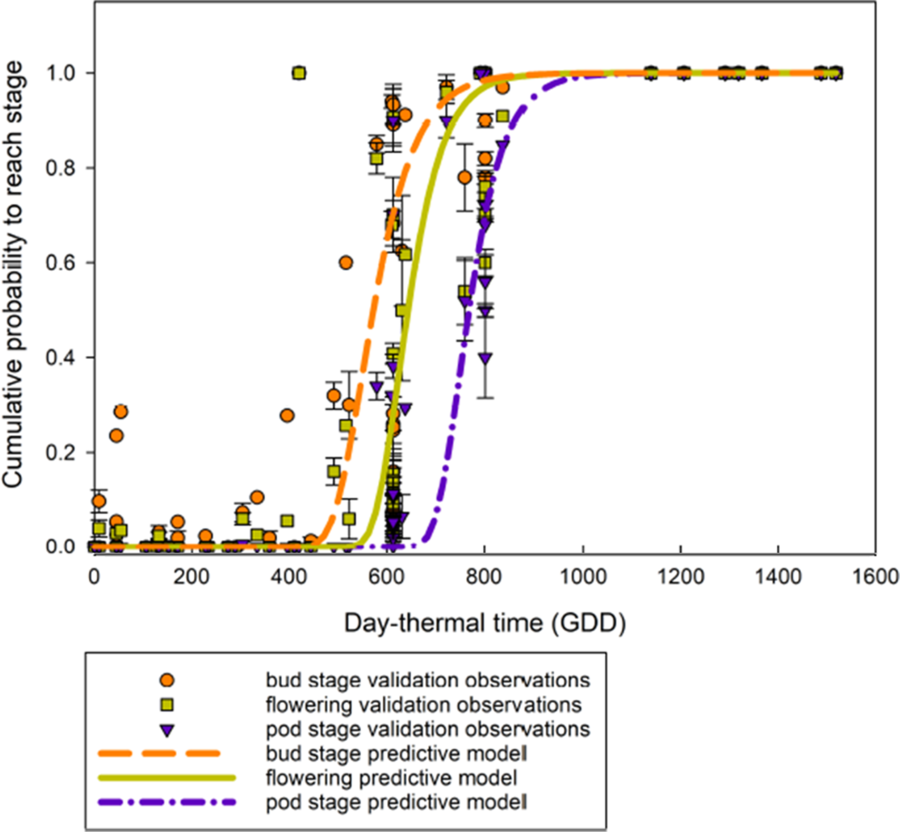
The reproductive stages of R. raphanistrum are likely dependent on daylength (Figure 4). When we tested models for each temporal measure, this was abundantly clear. The model for predicting time-to-bolting stage was best fit when using daylength-dependent TT or DTT, having an AIC of −73 and describing at least 75% of the variation in the data (Table 7). When the validation data were separated according to cohort season, the DTT and DHTT models were able to describe the winter and spring cohorts, explaining more than 90% of the variation in those data. To predict flowering, the DTT model also was the best, with AIC of −117 and explaining more than 75% of the variation in the data (Table 8). The daylength layer seems especially important for the overwintering cohort, individually describing greater than 90% of the variation. Beginning pod formation also was best predicted using the DTT model, with AIC of −86 and explaining more than 75% of the variation in the data (Table 9), and for the overwintering cohort, 95% of the variation. For these reasons, the DTT models provided the best predictions for reproductive stages of R. raphanistrum development (Figure 6).
Comparison of fitness for best models for each temporal measure to predict the probability to reach bolting for several cohorts.

a AIC is the Akaike information criterion used for comparing models. The more negative values are better fit. AIC is calculated with the data used to create the model.
b None of the data used in validation were used to create the model. RMSE, root mean-square error.
Comparison of fitness for best models for each temporal measure to predict the probability to reach flowering for several cohorts.

a AIC is the Akaike information criterion used for comparing models. The more negative values are better fit. AIC is calculated with the data used to create the model.
b None of the data used in validation were used to create the model. RMSE, root mean-square error.
Comparison of fitness for best models for each temporal measure to predict the pod stage for several cohorts.

a AIC is the Akaike information criterion used for comparing models. The more negative values are better fit. AIC is calculated with the data used to create the model.
b None of the data used in validation were used to create the model. RMSE, root mean-square error.
Probability of Raphanus raphanistrum to reach reproductive stages as a function of time in daylength-dependent thermal time (bolting: orange; flowering: yellow; pod set: blue). The solid line represents the best-fit predicted model. Dots represent independent observations for validation, not used in creating the model, and error bars represent the standard error of the mean.

Daylength has been acknowledged to contribute to the timing of R. raphanistrum stages. Reeves et al. (Reference Reeves, Code and Piggin1981) and Norsworthy et al. (Reference Norsworthy, Malik, Riley and Bridges2010) reported daylength affected the duration of flowering. Norsworthy et al. (Reference Norsworthy, Malik, Riley and Bridges2010) observed that daylength was important for the time to bolting and time to first flower. These researchers determined that the daylength explained 68% of variability in duration of flowering and 74% and 84% of emergence to bolting and bolting to flowering, respectively. Other species are also influenced by daylength, yet daylength is not usually implemented as a layer in predictive phenology modeling. The present study is the first to incorporate daylength to create predictive phenology models.
Raphanus raphanistrum is a highly adaptable species but appears to respond to consistent environmental signals. While one model might be suitable to predict the time of phenological stages, it is equally important to consider the relationship between weed emergence timing and crop life cycle in order to determine appropriate management strategies. Fall cohorts would compete with young winter crops and are likely to produce seed quickly, which will add to the soil seedbank. Spring cohorts would also compete but are more likely to affect grain quality. Later fall-emerging cohorts have a higher chance of mortality, but survivors could provide the worst scenario of long competition and grain contamination. By understanding the importance of daylength in addition to thermal requirements for R. raphanistrum maturity and survival, farm managers can evaluate the presence of rosettes before the daylength thresholds and apply effective management at critical stages for control.
Acknowledgments
The authors would like to thank the members of the Southeast Partnership for the Advancement of Renewables from Carinata (SPARC). This research was funded by U.S. Department of Agriculture–National Institute of Food and Agriculture grants 2017-6505-26807, 2018-70006-28933, 2019-68012-29818, and Hatch Project NC02653.