Introduction
There are three major categories of color vision deficiencies, that is, protan, deutan, and tritan. The most common inherited color vision deficiency (CVD) defects are the protan and deutan types. Individuals characterized as having protan or deutan deficiencies are referred to as individuals with red–green CVD. It is estimated that these types occur approximately in 8% of European males and 0.4% of European females (Smith & Pokorny, Reference Smith, Pokorny and Shevell2003). The protan type arises due to the lack of the normal L-pigment gene and is associated with the presence of the L–M hybrid gene, which is found either by itself or along with one or more normal M-pigment genes. The deutan type is associated with either the deletion of the normal M pigment gene or the presence of the M–L hybrid gene. In addition to the normal L and M–L hybrid genes, many deutans have normal M-pigment genes (deuteranomaly) (Deeb et al., Reference Deeb, Lindsey, Hibiya, Sanocki, Winderickx, Teller and Motulsky1992; Neitz & Neitz, Reference Neitz and Neitz2011). Although usually clinical color vision tests cannot distinguish anomalous trichromats from dichromats accurately, red–green CVD individuals are classified into the four following types: protanopes, deuteranopes (red–green dichromats), protanomalous, or deuteranomalous (red–green anomalous trichromats) (Neitz & Neitz, Reference Neitz and Neitz2011). The dichromatic form is more severe than the trichromatic form. The incidence of deuteranomaly is the highest among the four types (Neitz et al., Reference Neitz, Neitz and Kainz1996; Sharpe et al., Reference Sharpe, Stockman, Jägle, Nathans, Gegenfurtner and Sharpe1999). As red–green dichromats lack one class of the L-cone or M-cone visual pigment, they confuse such color pairs owing to a lack of the red–green opponent mechanism that is based on the comparison of the L-cone and M-cone responses (Viénot et al., Reference Viénot, Brettel, Ott, M’Barek and Mollon1995; Lillo et al., Reference Lillo, Moreira, Álvaro and Davies2014). A previous study has reported that 90% of dichromats and 66% of anomalous trichromats experience difficulties in performing daily activities such as color naming or color discrimination because of their color vision deficiency (Steward & Cole, Reference Steward and Cole1989).
To address this problem, numerous researchers have aimed at assisting tasks related to color discrimination in CVD observers. In particular, the following wearable tools have been developed as commercial products to aid color discrimination by CVD individuals: several types of tinted lenses such as the X-Chrom lens developed by Zeltzer (Reference Zeltzer1971), ChromaGen (ChromaGen Ltd., Chester, U.K.), ColorMax (ColorMax Technologies Inc., Tustin, CA, USA), Coloryte (Coloryte Hungary Rt, Szentendre, Hungary), and ColorView (ColorView Inc., Fremont, CA, USA). The concept of color filters was initially proposed by Seebeck (Reference Seebeck1837), and Maxwell (Reference Maxwell1857) applied this concept and designed a pair of spectacles for red–green CVD observers. Historical reviews of the development of such aids for CVD have been presented by several researchers including Schmidt (Reference Schmidt1976), Fletcher and Voke (Reference Fletcher and Voke1985), and Sharpe and Jägle (Reference Sharpe and Jägle2000). One of the best known contact lens applications is the X-Chrom lens, which is a red-tinted lens. The X-Chrom lens is essentially a high-pass red filter, but it has another short-wavelength transmission region (see Siegel (Reference Siegel1981) for details). The other common tinted lens is the ChromaGen system. The ChromaGen lens is a soft contact lens, and only the pupil zone of the lens is tinted. Lens tints are available in seven hues (magenta, pink, violet, yellow, aqua, orange, and green) (Swarbrick et al., Reference Swarbrick, Nguyen, Nguyen and Pham2001).
Data from several clinical tests involving a pseudoisochromatic plate, for instance, the Ishihara color test or Farnsworth–Munsell D-15 color vision test (D-15 test), have been reported for the X-Chrom lens (La Bissoniere, Reference La Bissoniere1974; Paulson, Reference Paulson1980; Richer & Adams, Reference Richer and Adams1984) and ChromaGen (Swarbrick et al., Reference Swarbrick, Nguyen, Nguyen and Pham2001). In this regard, La Bissoniere (Reference La Bissoniere1974) has reported that the X-Chrom lens significantly improves the performance of red–green CVD subjects on the Ishihara color test. This finding has been confirmed by Paulson (Reference Paulson1980) as well. Richer and Adams (Reference Richer and Adams1984) and Swarbrick et al. (Reference Swarbrick, Nguyen, Nguyen and Pham2001) have reported on the improvements in red–green CVD observers’ performance on the D-15 test using tinted lenses. Since then, other researchers have also confirmed the improvement in the performance of red–green CVD observers on the D-15 test by filtering effects using unique colored filters, that is, long-pass filters dispensed as tinted spectacles (Hovis, Reference Hovis1997) and red filters with a spectral transmittance similar to that of the X-Chrom lens (Diaconu et al., Reference Diaconu, Sullivan, Bouchard and Vucea2010).
With the use of certain tinted lenses or colored filters, red–green CVD subjects report an improvement in their performance on the D-15 test, as mentioned above. This improvement is mainly due to achromatic luminance cues. A tinted lens or a colored filter interposed in front of an observer eye will change the relative cone signal, resulting in a change in the luminance or chroma of D-15 colored caps. For example, a red-colored filter absorbs short and medium spectral wavelength ranges from blue to green and transmits long-wavelength light. Therefore, for red–green CVD observers, certain bluish and greenish colors appear darker while certain reddish colors appear brighter. That is, a colored filter induces differences in the luminance between combination colors such as reddish and greenish colors. The luminance cue related to the mechanism of the improvement in red–green CVD observers’ performance on the D-15 test has been mentioned in several studies (Diaconu et al., Reference Diaconu, Sullivan, Bouchard and Vucea2010; Hovis, Reference Hovis1997; Richer & Adams, Reference Richer and Adams1984; Swarbrick et al., Reference Swarbrick, Nguyen, Nguyen and Pham2001). These studies have explored the effect of a lens or a filter on enhancing the performance on the D-15 test; however, results are not consistent. In particular, there are variable differences in the effect of a lens on color vision between the protan and deutan types. Therefore, it is unclear as to how red–green CVD individuals utilize the luminance cues induced by colored filters.
The quantitative descriptions of the changes in luminance contrast induced by colored filters are useful for exploring the improvement in the performance of protan and deutan observers. For instance, Linhares et al. (Reference Linhares, Pinto and Nascimento2008) and Moreland et al. (Reference Moreland, Westland, Cheung and Dain2010) computationally estimated the effect of colored filters or lenses on red–green CVD observers. Linhares et al. (Reference Linhares, Pinto and Nascimento2008) used the algorithm proposed by Brettel et al. (Reference Brettel, Viénot and Mollon1997) to simulate the appearance of colors as seen by dichromats for normal observers. Additionally, the human cone-contrast model proposed by Derrington et al. (Reference Derrington, Krauskopf and Lennie1984) is useful for quantitatively demonstrating the changes in luminance contrast induced by colored filters. In the cone-contrast model, which is an extension of the cone-excitation model, cone excitation is converted to the increments and decrements of each cone type relative to a background (Stockman & Brainard, Reference Stockman, Brainard, Bass, DeCusatis, Enoch, Lakshminarayanan, Li, MacDonald, Mahajan and Van Stryland2010). It can be useful to show the changes in luminance contrast induced by colored filters when the stimulus is considered as a modulation relative to a background.
The current study aims to examine the effects of digitally simulated colored filters and identify the mechanism mainly responsible for the changes in red–green CVD observers’ performance on the D-15 test behind a colored filter. For this purpose, we simulated a red filter (on a digital screen) based on the spectral transmittance of the filter used in the study of Diaconu et al. (Reference Diaconu, Sullivan, Bouchard and Vucea2010). To examine the red-filter effect, we confirmed whether the red filter improves the red–green CVD observers’ performance on the D-15 arrangement test. Fourteen subjects with red–green CVD arranged the caps in the D-15 test on the monitor under four filter conditions, consisting of one condition without the filter and three conditions with the filter, corresponding to the opacity of the red filter. We evaluated their performance to discriminate colors based on an arrangement of the D-15 test, and we compared the results between the filter conditions. Moreover, to identify the mechanism mainly responsible for discriminating colors behind a red-colored filter, we considered the results based on the quantitative model of dichromatic vision and the human cone-contrast model in the Derrington–Krauskopf–Lennie (DKL) color space derived from retinal ganglion cells (Derrington et al., Reference Derrington, Krauskopf and Lennie1984).
Materials and methods
Subjects
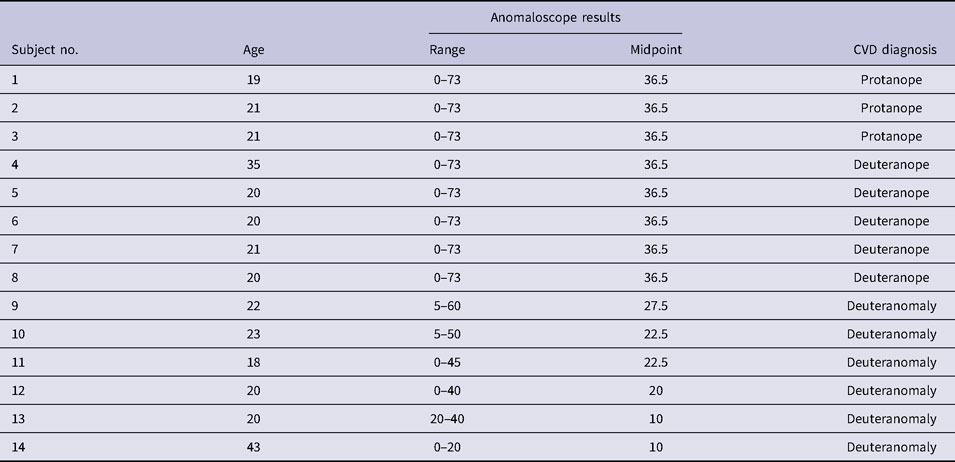
The participants included 14 Japanese men with red–green CVD, including the protan and deutan types. The mean participant age was 23.1 years within a range of 18–43 years. All participants were tested with Ishihara pseudoisochromatic plates (Ishihara, Reference Ishihara1987) and an anomaloscope (NEITZ OT-ll, Neitz Instruments Co., Ltd., Tokyo, Japan). They were subsequently diagnosed with the type (protan or deutan) and severity (dichromat or anomalous trichromat) according to their Rayleigh matching, and we identified three protanopes, five deuteranopes, and six deuteranomalous trichromats, as shown in Table 1. It is accepted that matching the full range in Rayleigh matching is not a precise diagnosis of dichromacy (Alpern & Wake, Reference Alpern and Wake1977); however, we considered that it is sufficient for the purpose of this study. Written informed consent was obtained from all participants as per an experimental protocol that was approved by the Ethics Committee of Kagawa University (26-002).
Subject details, anomaloscope results, and subsequent CVD diagnosis

Equipment
A computer-controlled test instrument (DELL Optiplex 9020, Dell Inc., Round Rock, TX) and a calibrated monitor (EIZO ColorEdge CX270 with a resolution of 1900 × 1200 pixels) were used in the study. The monitor was white-calibrated as a reference (x = 0.312, y = 0.329, Y = 99.93 cd/m2). In addition, color temperature was set as 6500 K and the gamma of the monitor was set as 2.2 using a colorimeter (EIZO EX2, EIZO Corporation, Ishikawa, Japan) so that the monitor could display appropriate colors. A chin rest was used to fix the distance between the participant and the screen. The experiment was carried out in the dark room of a laboratory under D65 ceiling lighting.
Simulation of red filter
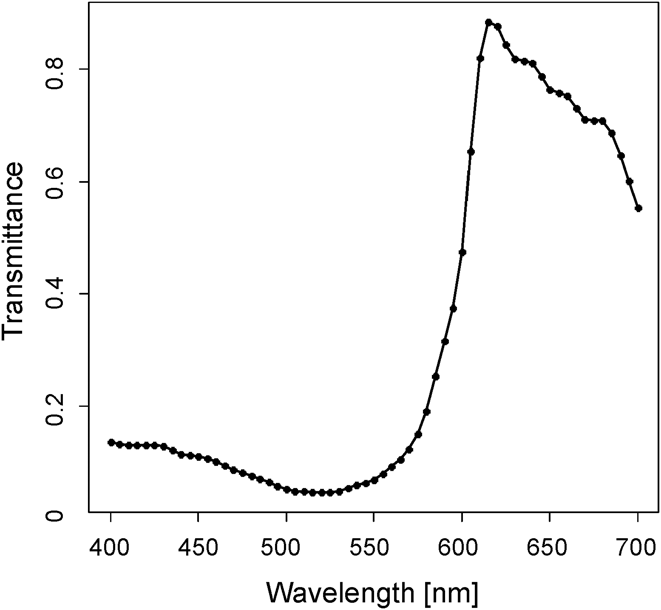
We simulated a colored filter on the monitor based on the red-colored filter used in the study of Diaconu et al. (Reference Diaconu, Sullivan, Bouchard and Vucea2010) with a spectral transmittance (Fig. 1) in a range of 400 to 700 nm. This red filter is similar to the X-Chrom lens; however, its blue transmittance is less than that of X-Chrom. To obtain RGB values from the spectrum of the colored filter, the XYZ tristimulus values were initially calculated from the spectral transmittance of the filter based on the spectral power distribution of CIE Standard Illuminant D65 (Hunt & Pointer, Reference Hunt and Pointer2011) and the CIE 1931 Standard Observers (2-deg Judd’ modified color matching functions). Subsequently, the XYZ tristimulus values were transformed into RGB values.
Spectral transmittance of red filter (Diaconu et al., Reference Diaconu, Sullivan, Bouchard and Vucea2010).

Color stimuli
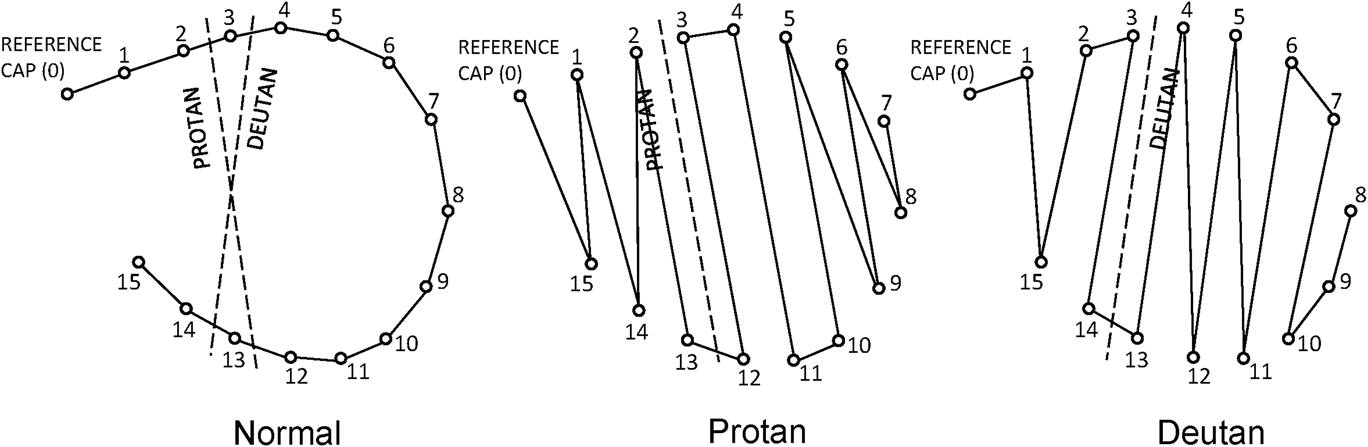
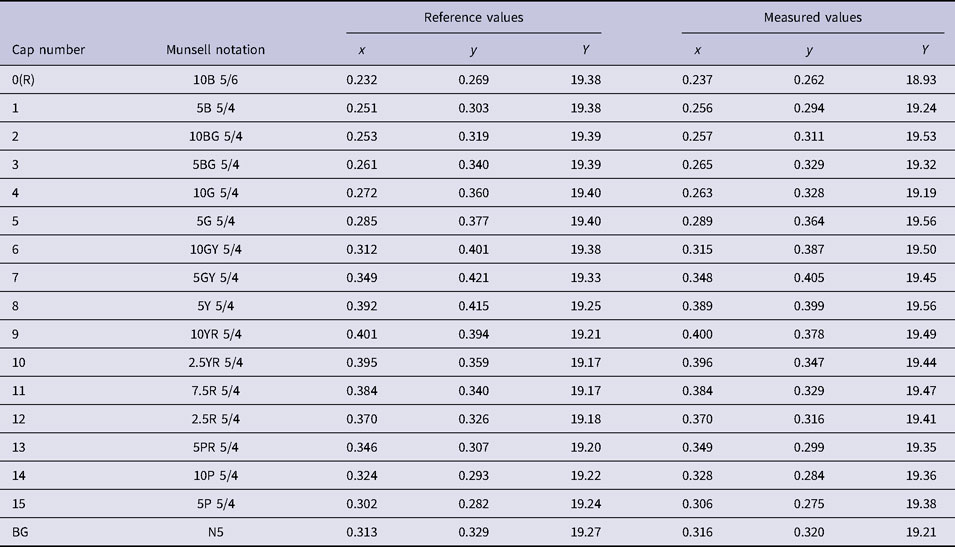
Color stimuli were selected based on the 15 caps with one reference cap of the D-15 test. The D-15 test is intended for the detection of CVD such as the protan or deutan type. The test involves a set of 15 colored caps that must be arranged in the correct hue order. Individuals with red–green CVD typically experience difficulties in arranging the given colors and make mistakes, as shown in Fig. 2. The type of deficiency and its severity can be calculated based on the resulting arrangement of the colored caps (see the details in the D-15 scoring method). In Munsell notation, all caps of the D-15 test have value 5 and chroma 4 [with the exception of the reference cap (cap number = 0) with chroma = 6], as per the Munsell values listed in Table 2. The 16 color stimuli in the current experiment were simulated as closely as possible on the monitor. We show the chromaticity coordinates (xy) and luminance (Y) values for the 16 color stimuli, which were measured with a luminance and color meter (Konica Minolta CS-150, Konica Minolta, Inc., Tokyo, Japan), alongside the reference values in Table 2. Each color stimulus was designed as round patches at a viewing distance of 50 cm and a visual angle of 2° in diameter. The background was set to neutral gray, as listed in Table 2 (reference value: x = 0.313, y = 0.329, Y = 19.27 cd/m2).
Farnsworth–Munsell D-15 arrangements from individuals with normal vision and red–green protan and deutan types.

Munsell values for the D-15 colored cap and the measured values of 16 color stimuli simulated on a visual display alongside the reference values [x and y: CIE chromaticity, Y: luminance (cd/m2)]

Filter effects of color stimuli
We combined the original color stimuli with the simulated red filter using alpha compositing. Alpha compositing is the process of overlaying a foreground image with transparency over a background image. Here, the alpha is generally used as the parameter that represents opacity. The opacity level falls within the range of 0.0 to 1.0. If the opacity level of a red filter is 0.0, it is fully transparent, and thus, the red filter is invisible (only the original image is visible). In contrast, an opacity of 1.0 yields a fully opaque image. Opacity makes it possible for an image to show through a background in the manner of a glass. The following equation expresses the blending of the original stimuli and simulated red filter. Blend fractions (alpha and 1 − alpha) are used in the weighted average of each component of each pixel: S(blend) = alpha × Filter + (1 − alpha) × S(original). In our experiment, we designed the four alpha conditions for the opacity levels, that is, 0.0, 0.1, 0.3, and 0.5. In all filter conditions, the horizontal illuminance on the desk in front of visual display was approximately 480 lx. Thus, the filter does not affect the illuminance of the stimuli.
Procedure
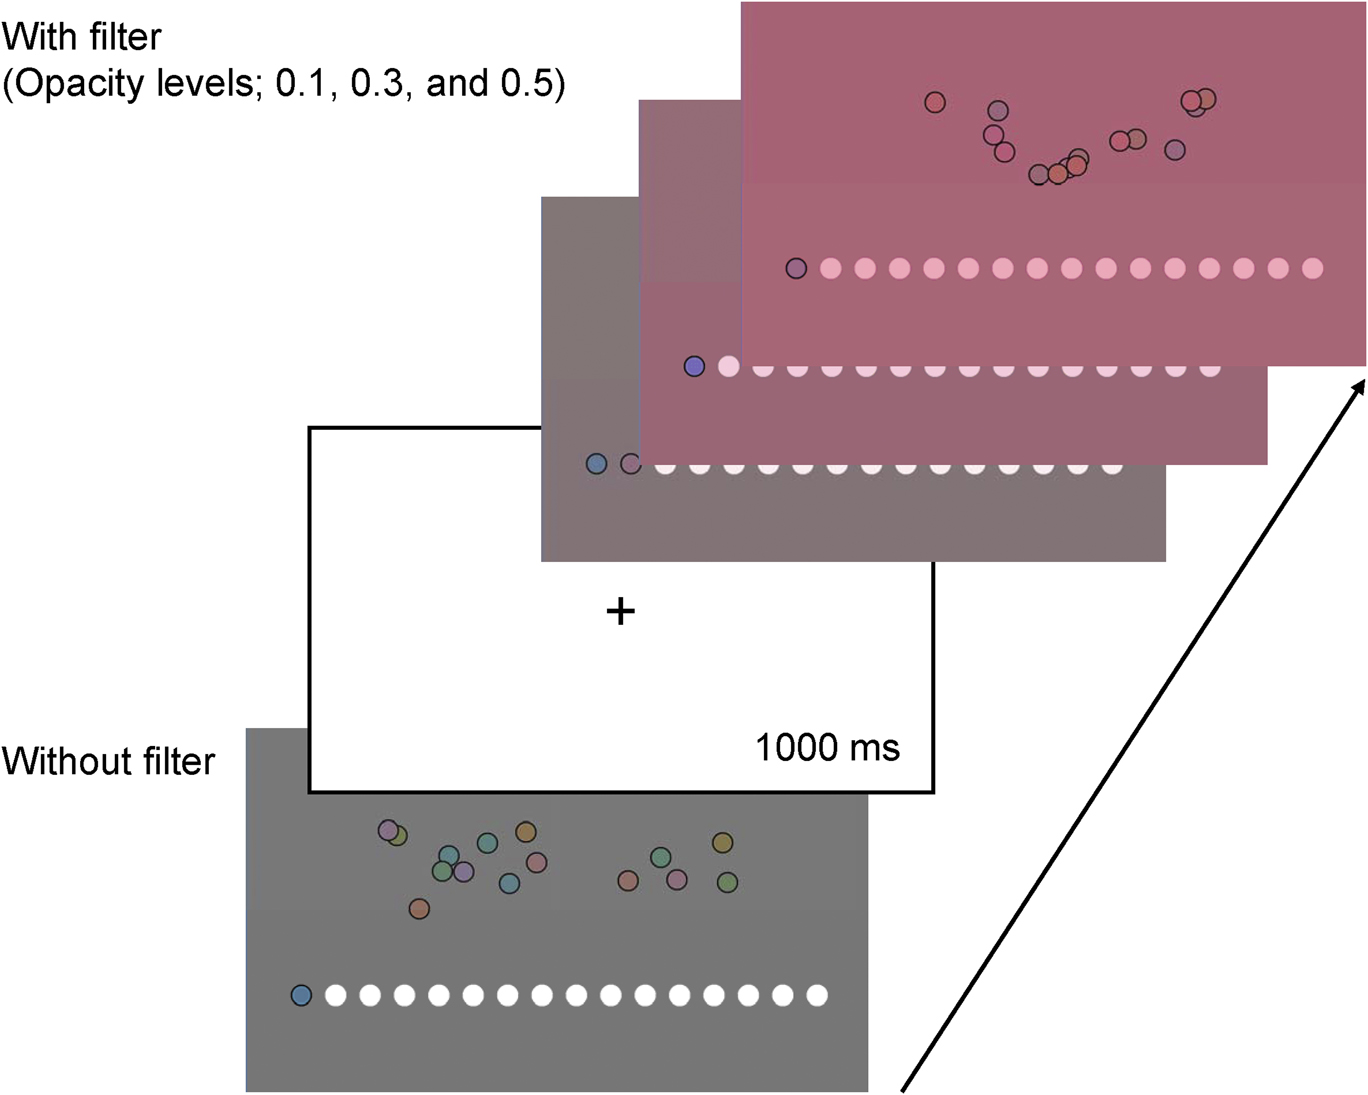
Each subject began by arranging the 16 saturated caps into a hue sequence starting with the reference cap, as shown in Fig. 3. The order of the 15 color caps was randomly displayed. After a subject completed his arrangement, the next trial was presented with a red filter having a certain opacity level. The order of opacity levels was random. A 1000 ms fixation cross was presented between trials. Each trial was conducted three times.
Overview of experimental flow.

D-15 scoring method
To evaluate whether the simulated red filter improves the subjects’ performance to arrange the caps in the D-15 test, the D-15 arrangements were analyzed using the quantitative scoring technique proposed by Vingrys and King-Smith (Reference Vingrys and King-Smith1988). This method is based on the calculation of the moment of inertia using the color difference vectors of an obtained arrangement pattern. The method provides advantages in terms of determining the following three aspects: (1) the identification of the primary axis of confusion (confusion angle); (2) the measure of randomness or selectivity in an arrangement (S-index); and (3) the estimation of the severity of a color deficiency (C-index). These three factors can be obtained by calculating the “two principal axes,” which yield the maximum and minimum radii based on the color difference vectors. Vingrys and King-Smith (Reference Vingrys and King-Smith1988) implied that these three indexes could identify type of color deficiencies and provide useful clinical information regarding the loss of color vision.
The first factor is the confusion angle, which is derived from the maximum radius. It lies in a range −90° to +90°, and it can estimate the type of color deficiency quite accurately. Red–green CVD tends to exhibit horizontal axes, with protans lying on positive angles and deutans on negative angles. The investigation by Vingrys and King-Smith (Reference Vingrys and King-Smith1988) showed that the mean protanopic angle is +8.8° with values ranging between +3° to +17°, whereas the mean deuteranopic angle is −7.4° with a range of −4° to −11°. A perfect arrangement of caps corresponds to a confusion angle of +62.0°.
The S-index is calculated from the ratio of the maximum and minimum radii, and it describes the degree of scatter, polarity, randomness, or selectivity in an observer’s cap placement. If the caps are placed in a nonpolar pattern, such as that given by normal observers or a random pattern, then this index is expected to be relatively small with an approximate range of 1.00 to 1.38. The polar arrangements of dichromatic observers have higher indexes that are larger than 4.00. Polarity is reflected by intermediate values (1.68) for mild anomalous trichromats, based on the investigation by Vingrys and King-Smith (Reference Vingrys and King-Smith1988).
The final factor is the C-index, which can be used to estimate the severity of color confusion. This index is calculated by dividing the length of the maximum radius by that of the maximum radius for a perfect arrangement. A perfect arrangement of caps corresponds to a C-index of 1.0. Vingrys and King-Smith (Reference Vingrys and King-Smith1988) showed that an index greater than 1.77 might be expected to indicate an abnormal arrangement, with dichromats showing a higher value range of approximately 3.06 to 4.21. However, it is difficult to categorize observers into normal and CVD observers correctly by determining a cutoff point because approximately 17% of CVD observers might pass the D-15 test (Dain & Adams, 1990).
Results
D-15 arrangement test
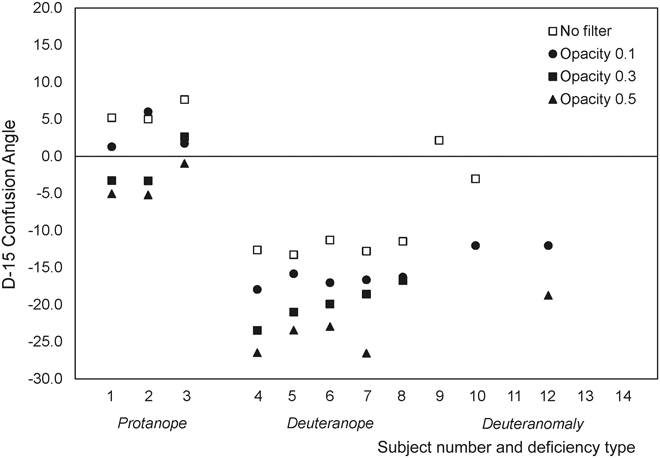
Figs. 4–6 show the confusion angles, S-indexes, and C-indexes of all subjects (the median for three arrangements was plotted). All graphs illustrate the scores of each subject under the four opacity levels. For the confusion angle (Fig. 4), a few trichromat individuals with deuteranomaly exhibited a confusion angle of +62°, which indicates no crossing, and thus, these data were excluded from this figure. The results suggest an overall shift in the confusion angle toward the deutan deficiency (to negative angles) as the opacity level increases for both deficiency types.
D-15 confusion angle without (no filter) and with red-filter conditions (opacity levels of 0.1, 0.3, and 0.5). We excluded the data corresponding to a confusion angle of +62°, which indicates a perfect arrangement.

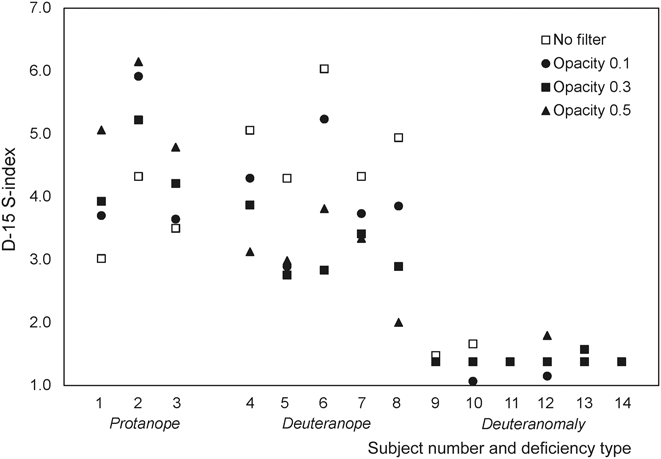
D-15 S-index without (no filter) and with red-filter conditions (opacity levels of 0.1, 0.3, and 0.5). The S-index represents the measure of randomness or selectivity in an arrangement.

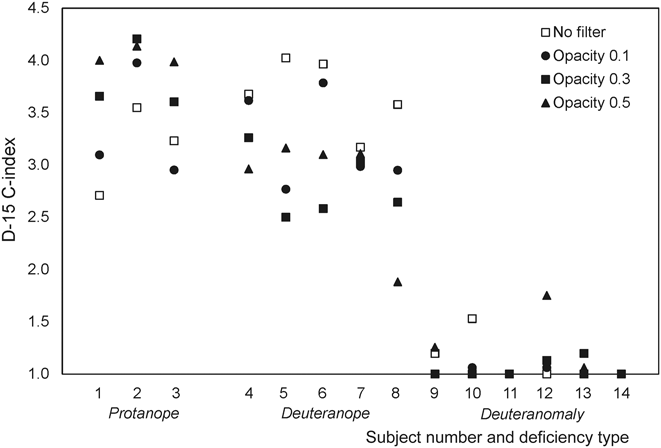
D-15 C-index without (no filter) and with red-filter conditions (opacity levels of 0.1, 0.3, and 0.5). The C-index represents the estimation of the severity of a color deficiency.

The S-indexes and C-indexes were similar, as shown in Figs. 5 and 6. For the three protanope subjects, these indexes tended to increase (indicating strong polarity and increase in color loss) with opacity. On the contrary, the S-indexes and C-indexes of the five deuteranopes under all filter conditions decreased compared with those under the no-filter conditions. The six deuteranomaly cases did not show marked difference between the filter conditions.
Luminance contrasts of protan and deutan
We examine the difference in the D-15 arrangement results between protan and deutan observers in terms of the luminance contrast responsible for the changes underlying the red filter. For this purpose, we used the algorithm proposed by Brettel et al. (Reference Brettel, Viénot and Mollon1997) to simulate the appearance of color stimuli as seen by dichromats for normal observers. The algorithm is expressed in terms of the transformations of a three-dimensional LMS space representing the three types of cones in the human retina, that is, short (S)-wavelength, medium (M)-wavelength, and long (L)-wavelength-sensitive cones. A color stimulus in the LMS space is transformed by its projection onto a reduced stimulus surface. This surface is defined by a neutral axis and by the LMS locations of the monochromatic stimuli that are perceived as the same hue by normal observers and dichromats. The quantitative algorithm is incomplete for representing dichromatic color vision. However, we can obtain an approximated description of the appearance of color for dichromats and estimate an indirect representation of dichromatic color perception. First, we measured all color stimuli using a luminance and color meter (Konica Minolta CS-150) at all opacity levels. The measured tristimulus XYZ values were translated into the amounts of L-cone, M-cone, and S-cone excitations for normal observers as per Smith and Pokorny (Reference Smith and Pokorny1975). Second, we applied the transformations for reducing the normal color domain to the dichromat color domain for protanopes and deuteranopes (Brettel et al., Reference Brettel, Viénot and Mollon1997; Viénot et al., Reference Viénot, Brettel and Mollon1999). The reduction of the normal color domain to the dichromatic color domain maintains the fundamental values corresponding to the existing photopigments, that is, S and M for protanopes and S and L for deuteranopes.
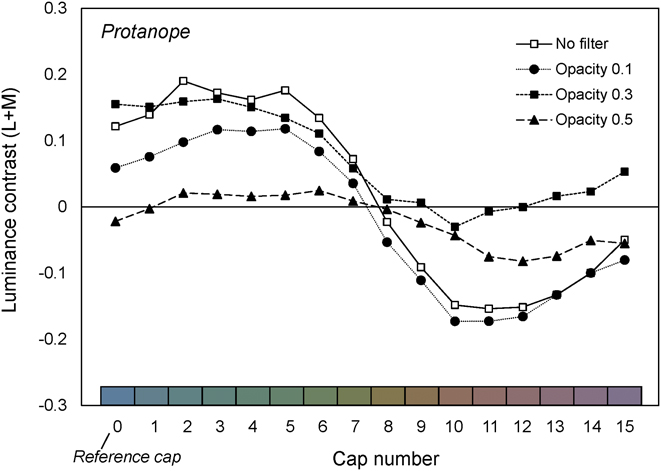
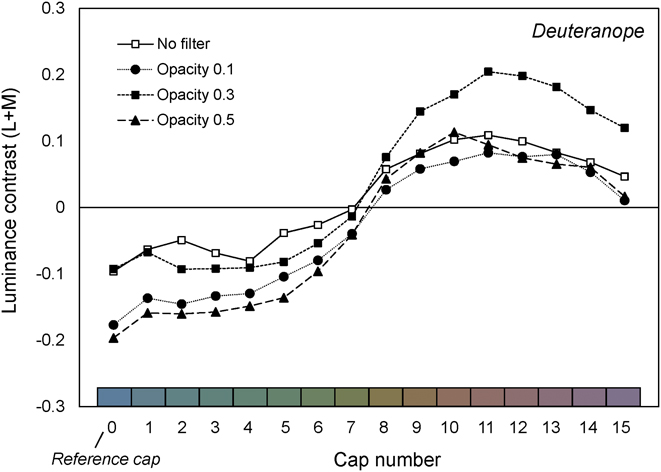
Subsequently, the luminance contrast for the reduced LMS coordinates was examined in terms of the DKL color space. The DKL color space (Brainard, Reference Brainard, Kaiser and Boynton1996; Derrington et al., Reference Derrington, Krauskopf and Lennie1984; Stockman & Brainard, Reference Stockman, Brainard, Bass, DeCusatis, Enoch, Lakshminarayanan, Li, MacDonald, Mahajan and Van Stryland2010), which is an extension of the MacLeod–Boynton chromaticity diagram (MacLeod & Boynton, Reference MacLeod and Boynton1979), is similar to the cone-contrast space in that it is based on a model of early visual processing. This model focuses on the responses to the background and deviations from the background, reflecting the fact that the DKL space represents the color contrasts of stimuli. That is, any color is defined by modulations along three different cardinal axes, consisting of pairs of mutually exclusive perceptual categories of red–green, blue–yellow, and luminance contrasts. The luminance mechanism, which we focus on here, sums the weighted differential L-cone and M-cone signals; it is frequently referred to as “L + M” (Derrington et al., Reference Derrington, Krauskopf and Lennie1984). This is possible because S-cone activation is assumed not to contribute to luminance. For simplicity, we define luminance contrast as “L + M.” The luminance contrasts for our stimuli were calculated according to the following procedure: After the reduction of the normal LMS space to the dichromatic color domain, ΔL, ΔM, and ΔS, which represent the differences between each stimulus and the background, were calculated using the following equations: ΔL = (L s − L b)/L b, ΔM = (M s − M b)/M b, and ΔS = (S s − S b)/S b. Subscript “s” in the equations denotes the stimulus, while subscript “b” denotes background color. Lastly, luminance contrast values were calculated according to the cone-contrast weights defined as per the study of Brainard (Reference Brainard, Kaiser and Boynton1996). Figs. 7 and 8 depict the luminance (L + M) contrast values for the 16 color caps at the four different opacity levels. These values were computed from the reduced LMS spaces for protanopes and deuteranopes.
Calculated luminance contrasts of D-15 color stimuli for protanopes without and with red-filter conditions.

Calculated luminance contrast of D-15 color stimuli for deuteranopes without and with red-filter conditions.

The origin of the DKL color space refers to the adaptation color (i.e., the background). A luminance contrast value of zero indicates that the perceived brightness of the color stimulus is almost the same as that of the background. The comparison of the luminance contrast of the protanopes and deuteranopes shows that for protanopes, it appears that the red filter ensures that the luminance contrast of each stimulus under the filter conditions tends to approach zero, resulting in a narrow range of luminance contrast when compared with the no-filter condition. On the contrary, the luminance contrasts for deuteranopes under filter conditions show a wide range of values when compared with the no-filter condition.
Discussion
The results of the D-15 test with the digital red filter indicate that the red filter reduced the S-indexes and C-indexes for certain individuals, mainly deuteranopes. Our results suggest that deutan subjects are likely to show higher improvements compared with protans. This outcome is consistent with previous reports that demonstrate that the X-Chrom lens (Richer & Adams, Reference Richer and Adams1984), ChromaGen contact lens (Swarbrick et al., Reference Swarbrick, Nguyen, Nguyen and Pham2001), and long-pass filters (Hovis, Reference Hovis1997) can improve subjects’ performance in the D-15 test. Hovis (Reference Hovis1997) showed that for observers with severe CVD, there is a statistically significant decrease in the D-15 total error score (the number of crossings). In his study, the change in the confusion angle represented a shift from the red–green axis to the blue–yellow axis. In contrast, mild-deficiency observers exhibited a slight increase in error score with the lenses. It must be noted that Hovis (Reference Hovis1997) included both deficiency types; however, the study did not report the difference in the error score between the types. In the study by Swarbrick et al. (Reference Swarbrick, Nguyen, Nguyen and Pham2001), the total error scores in the D-15 test exhibited significant reductions after two weeks of subjects wearing the ChromaGen lens. However, individual results showed considerable variability. A few subjects (mainly protans) made more errors after wearing the lens. The variability of the effect of the colored filter between deficiency types has also been noted by Paulson (Reference Paulson1980), who described a protanomalous patient whose error rate worsened with the X-Chrom lens and a deuteranope who passed the D-15 test with the lens. These differences between the deficiency types are consistent with our findings obtained with the digital red filter. In addition, our results for the confusion angle, which indicates the type of CVD present, suggest an overall shift in the confusion axis toward the deutan deficiency. This result has been reported previously with the use of a tinted lens or filter (Hovis, Reference Hovis1997; Richer & Adams, Reference Richer and Adams1984).
The luminance contrast for protanopes and deuteranopes calculated at each opacity level suggested that the red filter employed in this study induces different changes in the luminance contrast for red–green CVD observers with the protan and deutan types. We can consider that the decrease in the S-indexes and C-indexes for deutan observers may be mainly attributed to the usage of a luminance cue between the stimuli and background when compared with the no-filter condition. It should be noted that the improvement in performance could also be attributed to the fact that the chromaticity of the D-15 colored stimuli, which is designed to lie on confusion lines, does not lie on confusion lines. On the contrary, for protan types, it appears that the red filter decreased the luminance contrasts for all stimuli compared with that for the no-filter condition. This is because their sensitivity to long-wavelength light is naturally reduced, thereby resulting in poorer performance on the D-15 test. However, this is still disputable because of the sample size of protan observers in this study.
An inspection of individual D-15 results and the quantitative estimation of luminance contrasts in our study supports findings from previous studies that have explored the effect of a tinted lens or colored filter on the color discrimination of red–green CVD observers and the underlying luminance mechanism. It can be concluded that the digitally simulated red filter induced opposite changes in the luminance contrast for red–green CVD observers with the protan and deutan types, with the result that through the red filter, the performance of deuteranopes improved while that of protanopes deteriorated.
This study has the following limitations: First, the red filter based on the spectral transmittance used in the study of Diaconu et al. (Reference Diaconu, Sullivan, Bouchard and Vucea2010) was digitally simulated using the color matching function for a standard observer. This can only be justified for normal observers and not for red–green CVD observers. The D-15 colored caps were also translated to the tristimulus values X, Y, and Z based on the color matching function for a standard observer. Thus, both the filter and color stimuli simulated in this study do not consider the perception experienced by CVD observers for the actual filter or colored caps. Consequently, our results cannot be generalized to the actual filter perceived by CVD observers. Similarly, note that the luminance contrast for protanopes and deuteranopes calculated at each opacity level was based on the algorithm that simulated the appearance of colors as seen by dichromats for normal observers. Second, there are several variations in terms of symptoms and severity in individuals with red–green deficiency. For example, deuteranomalous individuals exhibit largely varying degrees of trichromatic color vision (Neitz et al., Reference Neitz, Neitz and Kainz1996). Major limitations of the Ishihara test and Rayleigh matching are that it is not possible to distinguish between congenital and acquired color vision deficiencies, and to estimate the severity of color vision deficiency. Furthermore, there may be types of defects related to retinal diseases, which are characterized by color vision abnormality. Such types might have abnormal cone function in addition to color vision deficiencies. Consequently, our current findings are problematic in terms of the lack of genetic confirmation in addition to sample size and distribution regarding red–green CVD participants. To reveal the general properties of colors in red–green CVD observers in more detail, further research is required with a large group comprising individuals with different types and severities of color deficiencies.
Our findings can be applied to the design of colored filters to assist CVD individuals to view colors on output devices such as monitors and displays as a universal color tool. Such individuals frequently find it difficult to differentiate colors related to their deficiencies when using output devices that visually convey text, graphics, and video information (such as a monitor). A red-tinted lens may enable a wearer to achieve a better score on a certain color vision test, as reported by previous studies (La Bissoniere, Reference La Bissoniere1974; Paulson, Reference Paulson1980; Richer & Adams, Reference Richer and Adams1984; Swarbrick et al., Reference Swarbrick, Nguyen, Nguyen and Pham2001). However, the lens does not actually correct color vision in the natural environment (Siegel, Reference Siegel1981). In this context, Hovis (Reference Hovis1997) proposed that long-pass filters are inappropriate for indoor use because the reduced spectral sensitivity may make the lenses too dark; thus, it is difficult to determine exactly who would benefit from this lens. Even though there are problems with such tinted lenses or filters, the idea of a digital filter effect can be applied to universal color tools focused on outputs devices to assist CVD observers in specific color-discrimination-related tasks.
Conclusion
We computationally examined the effects of a digitally simulated colored filter and identified the mechanism mainly responsible for the changes in the performance of red-green CVD observers to discriminate the colors in the D-15 test behind a colored filter. The simulated red filter was based on the spectral transmittance of the filter used in the study of Diaconu et al. (Reference Diaconu, Sullivan, Bouchard and Vucea2010). Among the fourteen participants subjected to the D-15 test on a digital screen, it was observed that the performance of deuteranope improved while that of protanopes deteriorated. Our considerations based on the human cone-contrast model enabled us to identify that the improvement in deutan observers largely resulted from the increase in the luminance contrast between the stimuli and background. We believe that our findings can contribute to the design of digital color filters for individuals with CVD.
Acknowledgments
This work was supported by research grants from the Japan Foundation for Aging and Health and JSPS KAKENHI Grant No. 17K17928.