I. INTRODUCTION
As a new type of orthopedic biomaterials, magnesium alloy is degradable and prevents patients from secondary surgeries. Reference Chen, Xu, Smith and Sankar1–Reference Xin, Huo, Hu, Tang and Chu3 In addition, the elastic modulus of a magnesium alloy is similar to that of human bone which could inhibit the stress-shielding effect. Reference Chen and Thouas4 However, the corrosion rate of a magnesium alloy in physiological environment is relatively fast. Reference Kirkland, Birbilis and Staiger5–Reference Xin, Liu, Zhang, Tang, Tian and Chu9 Furthermore, the degradation of a magnesium alloy is not controllable and the mechanical properties may be lost untimely. Therefore, the poor corrosion resistance of a biological magnesium alloy is an obstacle in clinical applications.
Severe plastic deformation (SPD) has been widely investigated because it can prepare bulk materials with ultra fine grain (UFG) structure and produce large strain without a significant change of the shape and size. Reference Edalati, Daio, Lee, Horita, Nishizaki, Akune, Nojima and Sasaki10–Reference Bahmanpour, Sun, Hu, Zhang and Wongsa-Ngam17 High-pressure torsion (HPT) is the most effective method to refine grains in SPD techniques. Reference Edalati, Daio, Horita, Kishida and Inui18–Reference Edalati, Emami, Ikeda, Iwaoka, Tanaka, Akiba and Horita22 Compared with other SPD techniques, HPT samples are affected by the mold and shear deformation will occur in the samples under similar hydrostatic pressure. Reference Kai, Horita and Langdon23,Reference Kratochvíl, Kružík and Sedláček24 During the HPT process, the samples are difficult to rupture, even though the deformation degree is extremely large at room temperature (RT). Therefore, HPT is suitable for a HCP magnesium alloy at RT. Reference Valiev and Langdon25,Reference Edalati, Yamamoto, Horita and Ishihara26 As a research hotspot, the technical parameters of HPT and microstructural evolution have been already studied in recent years. Reference Zhilyaev and Langdon27–Reference Kawasaki, Ahn, Lee, Zhilyaev and Langdon30 The microstructure of HPT-treated materials may not be homogenous. After 5 revolutions, the homogeneity of the microstructure is improved in the AZ31 alloy. Reference Figueiredo and Langdon31,Reference Serre, Figueiredo, Gao and Langdon32 It is reported that the grain size of a magnesium alloy processed by HPT was refined to 200 nm after 5 revolutions. Reference Alsubaie, Bazarnik, Lewandowska, Huang and Langdon33 F.Q. Meng et al. reported that the grain-refinement mechanism of the Mg–Zn alloy processed by HPT was the dynamic recrystallization induced by ultra-high strain. Reference Meng, Rosalie, Singh, Somekawa and Tsuchiya34 However, HPT samples have not been taken into practical application so far due to the small sample sizes.
To reduce the corrosion rate of a magnesium alloy, we select HPT to prepare bulk UFG magnesium alloy. It was reported that the HPT-treated magnesium alloy degraded in uniform model in physiological environment. Reference Guan, Ren, Gao, Sun, Zhu and Wang35–Reference Gao, Guan, Ren, Sun, Zhu and Wang37 Because the size of the sample prepared by HPT is small, the HPT alloy can be made into miniature bone plate implants, which may be suitable for the clinical treatment of skull, phalanx, phalange, etc. The bone plate needs excellent microstructural stability and mechanical properties in the early stage of implantation. The corrosion rate of the Mg bone plate should not be too much fast, or it will lead to a quick loss of mechanical properties. When a bone callus is calcified continually and its strength gradually increases, the bone plate starts to degrade gradually and its strength decreases slowly. Thus, it will reduce the stress-shielding effect and prevent the occurrence of refracture and osteoporosis at the position of fracture healing. Due to the differences of the extents of bone injuries, bone injury sites, patient ages, etc, the dwell time of the Mg bone plate in human body is different. Therefore, the corrosion rate of bone materials in the body should be slow and controlled according to the actual clinical conditions. Reference Rennie, Court-Brown, Mok and Beattie38
In this paper, Mg–2.0 wt% Zn–0.24 wt% Ca alloy is used as the research object. This alloy has good biological safety and biocompatibility because all the alloying elements are non-toxic to humans. Zinc is the most commonly used alloying element in magnesium alloys, effectively improving their yield strength. Reference Spigarelli, Regev, Evangelista and Rosen39,Reference Aghion and Bronfin40 Moreover, zinc can increase the tolerance limits and reduce the effect of impurities once the tolerance limit has been exceeded. Reference Song and Atrens41 Calcium is the most abundant mineral and is mainly stored in bones and teeth. Reference Chen and Thouas4 Besides, the element of calcium could facilitate the formation of new bone and accelerate bone growth rate. Reference Shi, Liu and Atrens42 When zinc content exceeded 3 wt%, (Mg–Zn) rich particles act as the crack initiation sites. Reference Drynda, Hassel, Hoehn, Perz, Bach and Peuster43 Like Zn, excessive amounts of Ca have the potential to be corrosive in nature. Reference Muhammad Saleh, Hapipah Mohd, Mahmood Ameen and Siddig Ibrahim44 In addition, from the previous study, the microstructure and microhardness distributions of Mg–Zn–Ca alloy are relatively homogenous after 5 revolutions. Reference Zhang, Zhu, Wang, Guo, Yue and Guan36,Reference Zhang, Guan, Wang, Zhu, Wang and Guo45 So the UFG materials are prepared by HPT after 5 revolutions in this study. The corrosion resistance of the HPT magnesium alloy has been further improved by annealing treatment. The effects of annealing temperature on the microstructure and corrosion resistance of the HPT alloy are studied. The key factors for the influence on the corrosion rate are investigated. The feasibility of the controlled degradation of the HPT magnesium alloy in simulated body fluid (SBF) is also discussed.
II. EXPERIMENTAL PROCEDURES
Mg–Zn–Ca ingots were prepared by semi-continuous casting. After solution treatment at 420 °C × 48 h, disk samples with 10 mm in diameter and 1.1 mm in thickness were processed by turning machining and wire cutting. Subsequently, samples were ground and polished to remove the oxide layer on the sample surface which was produced during wire cutting. The final thickness of the samples was 0.85 ± 0.01 mm. Then the samples were processed by HPT up to 5 revolutions at 0.5 rpm under 7.5 GPa at RT. In the end, HPT samples were heat treated at 90–270 °C for 30 min, and then cooled at RT to avoid the further grain growth.
The microstructure of the HPT magnesium alloy was observed by scanning electronic microscopy (SEM; Quanta-2000, FEI Company, Hillsboro, Oregon) and transmission electron microscopy (TEM; JEM2010, JEOL Ltd., Tokyo, Japan). HPT samples were ground with abrasive paper and polished with polishing paste. After etching the polishing surfaces, the HPT samples can be observed by SEM. The number of second phases was studied. TEM samples were prepared by punching a 3 mm diameter disk from HPT samples at a distance of 2.5 mm from the center, mechanically ground to thicknesses of less than 40 μm followed by dimpling from one side to a thickness of about 20 μm. Finally the thin disk samples were subjected to ion-thinning with Ar+ at an accelerating voltage of 4.2 kV. The grain size was measured in bright field images and the average grain size was calculated. What is more, the samples were tested by X-ray diffraction (XRD; Ultima IV, Rigaku Corporation, Tokyo, Japan) to analyze the change of grain orientation in HPT process and heat treatment. The target material was Cu Kα. The scanning range was 20–80° and the scanning speed was 2°/min. The voltage was 40 kV and the current was 40 mA. The grain orientation was analyzed by the changes of relative peak intensity.
The surface stress of the HPT samples was measured by a residual stress analysis system (LXRD MG2000, Proto, Ontario, Canada). The samples need to be mechanically polished and electrolytically polished. In this experiment, the target material was Cu. The size of the focal spot was φ1 mm. The exposure time was 3 s. The Bragg angle was 138°. The current was 30 mA and voltage was 25 kV. The spots were measured every 1 mm in radial direction, and then the average value of surface stress was calculated.
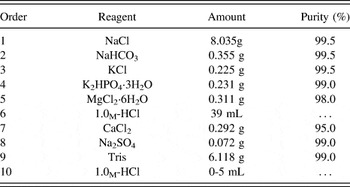
The simulated body fluid (SBF) was prepared based on Table I. Reference Kokubo and Takadama46 To prepare 1000 mL of SBF, put 900 mL of distilled water into 1000 mL plastic beaker. Heat the water to 36.5 ± 1.5 °C and then dissolve only the reagents of 1st to 8th order into the solution one by one in the order given in Table I. It was important to dissolve a reagent only after the preceding one dissolved completely. After inserting the electrode of the pH meter into the solution, dissolve the reagent Tris into the solution little by little. Add distilled water up to the marked line. Adjust the pH of the solution by dropping 1.0M-HCl little by little and then finally adjust it to 7.40 exactly at 36.5 °C.
Order, reagent, amount, and purities for preparing 1000 mL of SBF. Reference Kokubo and Takadama46

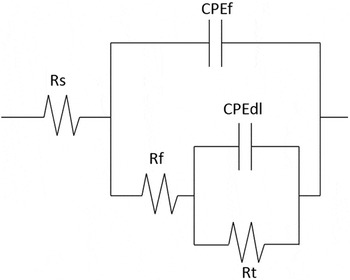
The corrosion resistance of the HPT magnesium alloy was evaluated by an electrochemical test and hydrogen evolution test in SBF. Electrochemical impendence spectrum (EIS) tests were conducted using electrochemical work station (RST5200, Risetest, Suzhou, China). One side of the disk sample was covered by silica gel, and the other side was exposed to test. Meanwhile, a conventional three-electrode cell system comprising the sample with an exposed area of 0.785 cm2 as a working electrode, Hg/Hg2Cl2 electrode as a reference electrode, and platinum plate as a counter electrode was used in this study. To characterize the corrosion resistance more directly, EIS was transformed by an equivalent circuit. Then the polarization resistance was obtained by fitting calculation. The selected equivalent circuit was as shown in Fig. 1. R s represents the solution resistance, CPEdl represents the double layer capacitance, R t represents the charge transfer resistance. R f and CPEf represent the effect of the film. The polarization resistance R p is the addition of R t and R f. Reference Walter and Kannan47 The samples were also coated with silica in hydrogen evolution test. The exposed area was 0.785 cm2 too. The volume of hydrogen evolution was recorded every hour. The variation curve of the volume of hydrogen was plotted, and the corrosion rate was calculated by Formula (1). Reference Atrens, Song, Liu, Shi, Cao and Dargusch48–Reference Johnston, Shi and Atrens50 In the formula, ΔV was the volume of hydrogen in mL. S was the contact area (cm2) between the sample and SBF. Δt was the immersing time in days. After being immersed in SBF at 37 °C for 48 h, the HPT alloys were treated by spray-gold and then the corrosion product layer was observed by SEM,
 $${\rm{Corrosion\ rate}} = 2.088 \cdot {{\Delta V} \over {S \cdot \Delta t}}\quad.$$
The diagram of the equivalent circuit.

III. RESULTS
A. Microstructure
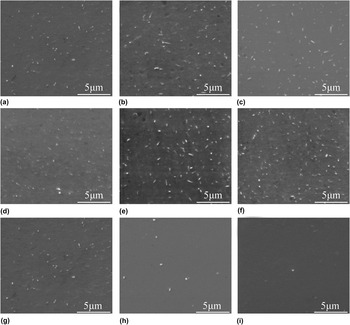
The SEM morphology of the HPT alloy is as shown in Fig. 2. The second phases can be clearly observed, and no grain or grain boundary (GB) is detected. According to Refs. Reference Levi, Avraham, Zilberov and Bamberger51–Reference Clark56, the second phases were Ca2Mg6Zn3 phases which were commonly observed in Mg–Zn–Ca ternary alloys. The fine second phases are precipitated from a solid solution alloy during the HPT process, and the results are similar to that of Al–Si alloy Reference Cepeda-Jiménez, García-Infanta, Zhilyaev, Ruano and Carreño57 and Mg–Zn alloy Reference Meng, Rosalie, Singh and Tsuchiya58 processed by HPT. With the rise of the annealing temperature, the number of the second phases increases first and then decreases. The number of the second phase increases slightly when the temperature is low (90–120 °C), and improves significantly as the rise of annealing temperature (150–210 °C). For a magnesium alloy treated by a solid solution, the annealing treatment in such temperature range actually plays the role of artificial aging. The diffusion of the atoms is accelerated due to the abundance of lattice defects in the HPT alloy. Besides, these defects can provide nucleation sites for the precipitated second phases. As a result, a lot of second phases precipitate from the solid solutions. When the annealing temperature continually increased to 240–300 °C, the number of the second phases starts to decrease, and even the second phase almost disappears. The above phenomenon is mainly because the second phases are solid dissolved into the matrix again when the annealing temperature is high.
SEM morphology of the HPT alloy before and after annealing: (a) as-HPT, (b) 90 °C, (c) 120 °C, (d) 150 °C, (e) 180 °C, (f) 210 °C, (g) 240 °C, (h) 270 °C, (i) 300 °C.

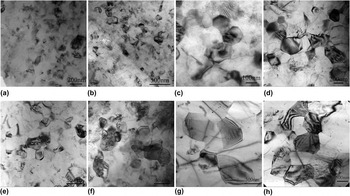
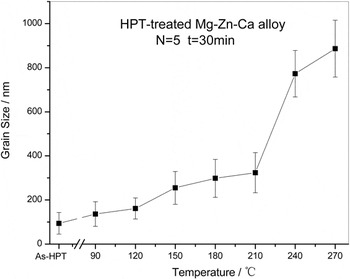
The TEM morphologies of HPT alloys are shown in Fig. 3. There are many fine grains in Mg–Zn–Ca alloy processed by HPT after 5 revolutions in Fig. 3(a). With the increase of annealing temperature, the grain size of the HPT alloy trends to increase gradually. The sizes of all grains in the morphologies are measured and counted. Then the average grain sizes are calculated as shown in Fig. 4. The average grain size of the as-HPT alloy is 95 nm. When the annealing temperature is relatively low, the grain size increases slowly. However, when the annealing temperature exceeds 210 °C, the grain sizes begin to increase significantly.
TEM morphology of the HPT alloy before and after annealing: (a) as-HPT, (b) 90 °C, (c) 120 °C, (d) 150 °C, (e) 180 °C, (f) 210 °C, (g) 240 °C, (h) 270 °C.

The grain size of the HPT alloy before and after annealing.

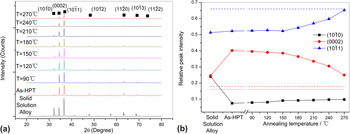
HPT alloys were tested by XRD and then the relative diffraction peak intensity was calculated. The result is as shown in Fig. 5. The diffraction peak of only α-Mg can be seen. The diffraction peak of the second phase cannot be detected because the addition of alloying elements is low. The dashed lines in Fig. 5(b) are the relative diffraction peak intensities of a magnesium alloy with random texture which is obtained from the Standard Powder Diffraction Files.
Reference Meng, Rosalie, Singh, Somekawa and Tsuchiya34
After HPT, the grain orientation is changed obviously, which was transformed from
 $\left( {10\bar 10} \right)$
and
 $\left( {10\bar 11} \right)$
to (0002). There are only three active slip systems on the basal plane when the magnesium alloy is processed by traditional plastic deformation at RT. In this case, plastic deformation is difficult.
Reference Eliezer, Aghion and Froes59
During HPT processing, the change of grain orientation can provide an advantage for dislocation slip, and then improve the capacity of plastic deformation at room temperature. With the rise of the annealing temperature, the relative diffraction peak intensity of (0002) grain orientation decreases and gradually closes to that of a solid solution alloy. The grain growth in the HPT alloy is random and non-directional during annealing, so the HPT texture weakens gradually and the grain orientation tends to be randomly distributed.
(a) The patterns of XRD and (b) the curve of the relative diffraction peak intensity.

B. Surface stress
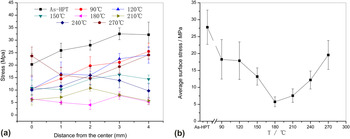
The surface stress of the HPT alloy is shown in Fig. 6(a). Before annealing, the distribution of the surface stress in the HPT alloy is non-uniform. The stress in the edge region is higher than that in the central region. The reason may be that the shear strain in the edge region is larger than that in the center region. After annealing, the distribution of the surface stress became uniform gradually and the value of the surface stress decreased. Figure 6(b) shows the average value of surface stress of HPT alloys. It can be seen that the average surface stress of the as-HPT alloy is much larger than that of the HPT alloy processed by annealing. When the annealing temperature is low (90–120 °C), the surface stress slightly decreases. When the annealing temperature is medium (150–180 °C), the surface stress of the alloy obviously decreases. When the annealing temperature is high (above 210 °C), the surface stress is increasing remarkably. It shows that the annealing treatment at an appropriate temperature can not only reduce the residual stress of the HPT alloy but also improve the homogeneity. However, if the temperature is too high, the stress increases rapidly due to the thermal stress.
The surface stress of the HPT alloy before and after annealing: (a) the distribution of the stress and (b) the average stress.

C. Corrosion resistance
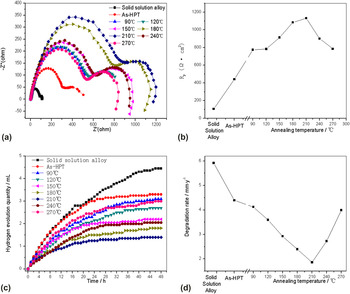
Figure 7 shows the EIS of Mg–Zn–Ca alloys. According to the equivalent circuit in Fig. 1, the polarization resistance was obtained by fitting and calculating. The variation of polarization resistance at different annealing temperatures is shown in Fig. 7(b). The polarization resistance of the HPT alloy is much larger than that of the solid solution alloy. After annealing, the polarization resistance is further improved. With the rise of annealing temperature, the polarization resistance is increasing first. When the annealing temperature rises to 210 °C, the polarization resistance reaches a maximum. With the rise of temperature, the polarization resistance starts to decrease. It reveals that the corrosion resistance increases initially and then declines with the rise of temperature. Figure 7(c) shows the evolved hydrogen volume of Mg–Zn–Ca alloys. The corrosion rate is calculated by Formula (1) as shown in Fig. 7(d). The corrosion rate of the solid solution alloy is the largest. After HPT, the corrosion rate is obviously decreased. With the annealing temperature rising, the corrosion rate decreases initially and bottoms out at 210 °C. Then, the corrosion rate starts to increase. The hydrogen evolution test shows that the tendency of corrosion resistance is consistent with the results of the electrochemical test. In summary, the HPT alloy has the best corrosion resistance after heat treatment at 210 °C × 30 min.
The corrosion resistance of Mg–Zn–Ca alloy: (a) EIS pattern, (b) polarization resistance, (c) the evolved hydrogen volume, and (d) the corrosion rate.

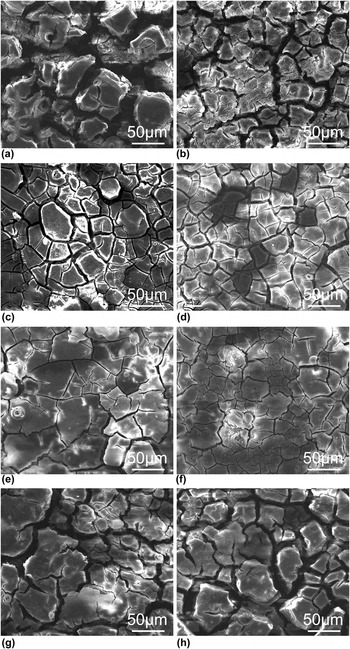
The corrosion products of HPT alloys immersed in SBF at 37 °C for 48 h are shown in Fig. 8. It can be seen that there are many cracks in the corrosion product layer. The width of the cracks in the as-HPT alloy is large in Fig. 8(a). It indicates that the corrosion products are loose. After annealing at 90–150 °C, the width of the cracks becomes smaller and smaller as shown in Figs. 8(b)–8(d). When the annealing temperature increases to 180–210 °C, the width of the cracks is small in Figs. 8(e) and 8(f). It reveals that the corrosion products are relatively dense. As shown in Figs. 8(g) and 8(h), the width of the cracks has a tendency to become larger when the annealing temperature is above 210 °C.
The corrosion morphology of the HPT alloy immersed in SBF for 48 h: (a) as-HPT, (b) 90 °C, (c) 120 °C, (d) 150 °C, (e) 180 °C, (f) 210 °C, (g) 240 °C, and (h) 270 °C.

IV. DISCUSSION
The corrosion rate of miniature bone plates in human body needs to be set according to the actual situation. The corrosion rate of the HPT magnesium alloy is not as small as possible. The corrosion rate should be controllable and degrade completely in a given time. Thus, the controlled degradation of the HPT magnesium alloy in human body is essential. It is necessary to research and analyze the factors that affect the corrosion rate.
In case of magnesium, unlike aluminum and steels, the passive layer is crystalline in nature. Reference Ghali, Dietzel and Kainer60 The microstructure is discontinuous between the oxide layer and the matrix with HCP lattice, leading to a high compressive stress in the layer. Reference Argade, Panigrahi and Mishra61 Birbilis et al. reported that the increase of GBs density can reduce the mismatch and disorder between the magnesium surface and the oxide layer. Reference Birbilis, Ralston, Virtanen, Fraser and Davies62 The higher GBs density in UFG microstructure resulted in a more tenacious and adherent passive layer. The UFG microstructure can change the characteristics of the passive layer. It is suggested that the smaller the grain size is, the better the corrosion resistance of AZ31B alloy Reference Aung and Zhou63 and ZK60 alloy Reference Zeng, Kainer, Blawert and Dietzel64 will be. However, GB is an enriched area of crystal defects. The atoms in this area are in half-activation state of energy instability and divorce easily from the matrix. GBs are easily corroded. Reference Zhang, Zhu, Wang, Guo, Yue and Guan36 When the magnesium alloy is in contact with SBF, the corrosion occurs preferentially at GBs. For the alloy with coarse grains, the corrosion rate at GBs is faster than that in the interior of the grains, so the corrosion rates on the alloy surface are not the same. The corrosion product layer is loose because corrosion pits are easy to form near GBs and the smoothness of the alloy surface is poor. Reference Zhang, Zhu, Wang, Guo, Yue and Guan36 For the UFG alloy, the density of GBs increases and the preferential corrosion area on the alloy surface is enlarged and the corrosion rates of the entire alloy surface are basically the same. In addition, the high density of GBs can change the structure discontinuity between the layer and the matrix. These are beneficial to the formation of the dense product layers as shown in Figs. 8(e) and 8(f). Hence, with the increase of grain size, the corrosion resistance decreases in a nano-scale or micron-scale magnesium alloy.
The self-corrosion potential of the second phase is higher than that of the magnesium matrix. When the HPT alloy comes in contact with SBF, the galvanic action is generated between the second phases and the matrix. The corrosion rate near the second phase is accelerated. The corrosion rates in the whole alloy surface are nearly the same if the number of the second phase is very large and its distribution is uniform. It is beneficial for the corrosion products to accumulate densely in Figs. 8(e) and 8(f). In this way, the corrosion product layer is compact and protects the matrix from further corrosion. M. Laleh et al. reported that the dissolution of β-Mg17Al12 would transform AZ91D alloy from localized corrosion to uniform corrosion after surface mechanical attrition treatment. Reference Laleh and Kargar65 If the number of the second phases is small and the distribution is non-uniform, the corrosion rates on the alloy surface are inconsistent and the corrosion product layer is loose, which cannot provide sufficient protection for the matrix. In summary, when there are a large number of second phases which are densely and uniformly distributed on the magnesium alloy, the corrosion rate is small. From the observation of the microstructure, some second phases are precipitated from the matrix because of the large stress induced during the HPT process. After annealing (90–210 °C), more and more second phases are precipitated as a result of artificial aging. This phenomenon is helpful to the improvement of corrosion resistance. When the annealing temperature is above 210 °C, the corrosion resistance will be worse because the second phases are gradually dissolved into the matrix.
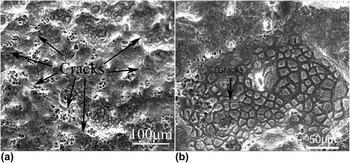
A lot of defects are formed easily in the Mg–Zn–Ca alloy processed by HPT at room temperature, which causes a large residual stress. Generally, the trend of stress corrosion cracking (SCC) becomes large with the increase of residual stress. Reference Winzer, Atrens, Song, Ghali, Dietzel and Kainer66,Reference Horner, Connolly, Zhou, Crocker and Turnbull67 Besides, Zn element can increase the sensitivity of SCC in the magnesium alloy. Reference Choudhary, Szmerling, Goldwasser and Raman68,Reference Atrens, Winzer, Dietzel, Srinivasan, Song and Song69 Therefore, as shown in Fig. 9(a), there are corrosion cracks on the corrosion interface. There is no obvious crack on the corrosion interface after annealing treatment at low-medium temperature. Based on the result of the surface stress, the decrease of the surface stress can reduce the trend of SCC in magnesium alloy and is beneficial to the improvement of corrosion resistance. But when the annealing temperature is too high, the corrosion cracks can be observed again as shown in Fig. 9(b). The sensitivity of SCC in magnesium alloy increases because the new thermal stress is induced, which has a negative effect on the corrosion resistance in the HPT magnesium alloy.
The corrosion crack on the corrosion interface (arrow): (a) as-HPT, (b) after annealing at 270 °C.

In a previous study, the corrosion rate of many alloys had been correlated to surface energy.
Reference Liu, Qiu, Zhao, Song and Atrens70–Reference Asgari, Toroghinejad and Golozar74
The activation energy for the dissolution of a densely packed surface is higher than that of a loosely packed surface.
Reference Liu, Qiu, Zhao, Song and Atrens70
The surface energy inversed with the atomic packing density, so the atoms in lower surface energy planes are solved slower.
Reference Xin, Li, Li and Liu75
Fu et al. reported that the (0002) surface is the lowest energy.
Reference Fu, Liu and Li76
In the references, the theoretical dissolution rates of crystallographic planes
 $\left( {10\bar 10} \right)$
and
 $\left( {11\bar 20} \right)$
are about 18–20 times higher than that of the basal plane.
Reference Song, Mishra and Xu71
G.L. Song et al. reported that the grain with a basal orientation was more stable and corrosion resistant because the basal plane is stable enough to resist the corrosion attack and the film formed on the basal plane surface was more protective.
Reference Song and Xu77–Reference Song and Xu80
After HPT, the grain orientation in the biological magnesium alloy tends to transform into (0002). The increase of (0002) oriented grains is helpful to the improvement of corrosion resistance. It is because the basal plane or (0002) oriented grain is more stable than other planes or non-basal oriented grains.
Reference Song and Xu77
After annealing, (0002) oriented grains declined, leading to the disorientation of corrosion resistance. However, when the annealing temperature is low, the relative diffraction peak intensity of (0002) decreases a little and this small change has little effect on the corrosion resistance of the HPT alloy.
In summary, the corrosion resistance of traditional magnesium alloys is poor due to pitting corrosion. The cause of pitting corrosion is mainly the galvanic acceleration effect between the magnesium matrix and the second phases. Meanwhile, as an enrichment area of lattice defects, GBs are easy to be corroded. According to the results of the microstructure observation, the distributions of the second phases are not uniform, so are the distributions of the GBs. The area with large corrosion rate is easy to form a corrosion pit. After HPT processing of 5 revolutions and subsequently annealing at appropriate temperature, the number of second phases increases because of the precipitation phases induced by stress and temperature. Meanwhile, the GB density is increased due to the significant grain refinement. According to the microstructure observation, the second phases and GBs distribute uniformly and dispersedly. The corrosion mode of the alloys is uniform corrosion instead of pitting corrosion. In addition, the matrices are more stable and corrosion resistant due to the enhancement of (0002) grain orientation after HPT, and the tendency of SSC in HPT alloys decreases because of the reduction of the surface stress after appropriate annealing treatment. Therefore, Mg–Zn–Ca alloy processed by HPT followed by annealing at 210 °C has the best corrosion resistance in SBF.
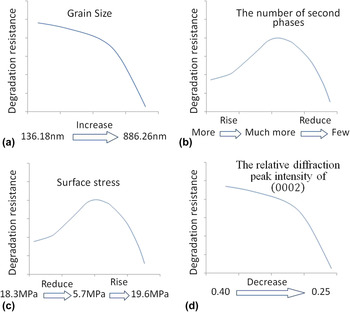
Figure 10 shows the effect laws of the grain size, the second phase, the surface stress, and the grain orientation on the corrosion resistance of the HPT alloy with the rise of annealing temperature. When the annealing temperature is low (90–150 °C), the morphology and microstructure of the HPT alloy change a little, and the corrosion resistance is improved slightly. When annealing treatment is at medium temperature (180–210 °C), the grain size increases slightly and the number of (0002) oriented grains decreases a little. These changes can somewhat deteriorate the corrosion resistance. However, the number of the second phases reaches to a maximum value and the surface stress is reduced to a minimum value. These changes can improve the corrosion resistance obviously. Therefore, the polarization resistance is the largest, and the hydrogen evolution rate is the lowest. The alloy presents an excellent corrosion resistance. When the annealing temperature is high (above 210 °C), the increase of grain size, the decrease of the number of second phases, the weakening of (0002) grain orientation, and the enlargement of surface stress are all detrimental to the corrosion resistance. The results show that the annealing temperature indirectly affects the corrosion resistance of the HPT alloy by directly affecting grain size, the second phases, surface stress, and the grain orientation. It can be considered by adjusting the annealing temperature, to achieve the controllable degradation of the HPT magnesium alloy.
The effect laws of the factors on the corrosion resistance with the annealing temperature rising from 90 °C to 270 °C: (a) the grain size, (b) the second phase, (c) the surface stress, and (d) the grain orientation.

V. SUMMARY AND CONCLUSION
-
(1) Biological Mg–Zn–Ca alloy was processed by HPT at RT for up to 5 revolutions, and then treated for annealing at 90–270 °C for 30 min. The microstructure and corrosion resistance of HPT-treated alloy before and after annealing treatment were investigated. In addition, factors affecting corrosion were researched and analyzed.
-
(2) With the annealing temperature rising, the grain size of the HPT alloy gradually increases slowly at first and then increases rapidly; the number of (0002) oriented grains reduces slightly at the beginning, and then reduces significantly; the number of second phases rises first then reduces; the surface stress decreases first then increases.
-
(3) When the HPT alloy is annealing at 210 °C × 30 min, the polarization resistance reaches the maximum value and hydrogen evolution rate reaches the minimum value. The corrosion resistance is the best. The reasons for this result are as follows: the increase of grain size and the reduction of (0002) oriented grains number will worsen the corrosion resistance; the uniform dense distribution of second phases and low surface stress will improve the corrosion resistance.
-
(4) All of these four factors (grain size, the second phase, the second phase, (0002) oriented grains, and the surface stress) affect the corrosion resistance simultaneously. Hence, the corrosion rate can be controlled by changing the annealing temperature and the controllable degradation of the HPT magnesium alloy is feasible.
ACKNOWLEDGMENTS
This work was supported by the National Science Foundation of China under Grant No. 51171174, the National High Technology Research and Development Program of China under Grant Nos. 2015AA020301 and 2015AA033603.