Introduction
Information processing studies suggest that attentional biases are related to anxiety (Williams et al. Reference Williams, Watts, MacLeod and Mathews1988; Eysenck, Reference Eysenck1992), including social anxiety (Heinrichs & Hofmann, Reference Heinrichs and Hofmann2001). Some of these findings have been integrated into cognitive treatment models to explain the emergence and maintenance of social anxiety disorder (SAD) (Clark & Wells, Reference Clark, Wells, Heimberg, Liebowitz, Hope and Schneier1995; Rapee & Heimberg, Reference Rapee and Heimberg1997). Specifically, it is assumed that socially anxious individuals overly attend to threatening, socially relevant cues, including angry faces. Such hypervigilance might lead to increased threat detection, probably exacerbating anxiety, and increased vulnerability to negative emotions (Eysenck, Reference Eysenck1992; MacLeod et al. Reference MacLeod, Rutherford, Campbell, Ebsworthy and Holker2002; Mathews & MacLeod, Reference Mathews and MacLeod2002).
A widely used method to assess attentional biases is the dot-probe task (MacLeod et al. Reference MacLeod, Mathews and Tata1986), in which a neutral cue and a threat-related cue are presented simultaneously at different locations of a screen. After a brief delay, a probe replaces one of these cues, and the participant is instructed to press a button to indicate the detection of the probe. Decreased reaction times (RTs) to probes replacing threat-related relative to neutral cues suggest increased allocation of visual attention towards threat-related cues (MacLeod et al. Reference MacLeod, Mathews and Tata1986; cf. Fox et al. Reference Fox, Russo and Dutton2002).
Several dot-probe studies support the hypothesis of hypervigilance in SAD, especially if stimuli are presented briefly (⩽500 ms) and if participants have no co-morbid diagnosis of depression (Mogg & Bradley, Reference Mogg and Bradley2002; Musa et al. Reference Musa, Lepine, Clark, Mansell and Ehlers2003; Mogg et al. Reference Mogg, Philippot and Bradley2004; Vassilopoulos, Reference Vassilopoulos2005; Sposari & Rapee, Reference Sposari and Rapee2007). Some studies using the dot-probe task and related paradigms, however, suggest that socially anxious individuals might avoid emotional stimuli (e.g. angry and happy faces) (Mansell et al. Reference Mansell, Clark, Ehlers and Chen1999; Horley et al. Reference Horley, Williams, Gonsalvez and Gordon2003; Vassilopoulos, Reference Vassilopoulos2005; Heuer et al. Reference Heuer, Rinck and Becker2007).
Some of the conflicting results may be reconciled by the hypervigilance-avoidance hypothesis (Mogg et al. Reference Mogg, Mathews and Weinman1987; Williams et al. Reference Williams, Watts, MacLeod and Mathews1988; Amir et al. Reference Amir, Foa and Coles1998) which assumes that SAD is characterized by early automatic hypervigilance followed by strategic avoidance of threat. Support for this hypothesis derives from studies using eye-tracking (Garner et al. Reference Garner, Mogg and Bradley2006), homographs (Amir et al. Reference Amir, Foa and Coles1998) and the dot-probe paradigm with varying stimulus-onset asynchronies (Vassilopoulos, Reference Vassilopoulos2005). However, other investigations have failed to find clear evidence for a vigilant-avoidant attentional pattern in SAD (Mogg et al. Reference Mogg, Philippot and Bradley2004). In addition to the mixed results regarding the direction of the bias (hypervigilance versus avoidance), studies have found attentional biases to threat stimuli only (Mogg & Bradley, Reference Mogg and Bradley2002; Mogg et al. Reference Mogg, Philippot and Bradley2004), to both angry and happy faces (Mansell et al. Reference Mansell, Clark, Ehlers and Chen1999; Heuer et al. Reference Heuer, Rinck and Becker2007; Sposari & Rapee, Reference Sposari and Rapee2007), or no biases towards external sources of threat (Pineles & Mineka, Reference Pineles and Mineka2005).
A possible reason for these inconsistent findings is that behavioral measures provide an indirect measure of attentional processing (Horley et al. Reference Horley, Williams, Gonsalvez and Gordon2004) and can be confounded by post-perceptual processes (e.g. decision making, motor responses) (Handy et al. Reference Handy, Green, Klein and Mangun2001). Measurements of brain electrical activity through event-related potentials (ERPs) offer the possibility to investigate attentional processes more directly and thus circumvent some of the limitations of behavioral studies. Of note, recent studies using the dot-probe paradigm in healthy adults have shown that the P1 component to emotionally cued probes provides a sensitive measure to assess rapid spatial orienting towards threat-related stimuli. Specifically, Pourtois et al. (Reference Pourtois, Grandjean, Sander and Vuilleumier2004) and Santesso et al. (Reference Santesso, Meuret, Hofmann, Mueller, Ratner, Roesch and Pizzagalli2008) reported increased P1 amplitudes to probes replacing fearful or angry faces as opposed to neutral faces. These findings are consistent with independent evidence indicating that P1 amplitudes are larger for stimuli presented at attended compared to unattended locations (Clark & Hillyard, Reference Clark and Hillyard1996; Hillyard & Anllo-Vento, Reference Hillyard and Anllo-Vento1998; Di Russo et al. Reference Di Russo, Martínez and Hillyard2003). In addition to P1 enhancements for probes cued by threat-related faces, negatively valenced emotional stimuli may also directly evoke increased P1 amplitudes compared to neutral stimuli (Streit et al. Reference Streit, Dammers, Simsek-Kraues, Brinkmeyer, Wolwer and Ioannides2003; Klucharev & Sams, Reference Klucharev and Sams2004; Pourtois et al. Reference Pourtois, Dan, Grandjean, Sander and Vuilleumier2005). Importantly, these findings have also been linked to increased attention for threat during initial stages of processing (Vuilleumier & Pourtois, Reference Vuilleumier and Pourtois2007).
The aim of the present study was to investigate attentional biases towards socially relevant cues and underlying brain mechanisms in a sample of SAD patients and matched healthy controls using the paradigm we developed recently in an undergraduate sample (Santesso et al. Reference Santesso, Meuret, Hofmann, Mueller, Ratner, Roesch and Pizzagalli2008). Based on behavioral findings reviewed above, we hypothesized that SAD participants would show initial hypervigilance towards threat-related cues, as manifested by potentiated P1 amplitudes to angry–neutral face pairs compared to happy–neutral face pairs. If such hypervigilance persists over time, we predicted that SAD participants would show significantly increased P1 amplitudes to probes replacing an angry face, as demonstrated in healthy participants (Santesso et al. Reference Santesso, Meuret, Hofmann, Mueller, Ratner, Roesch and Pizzagalli2008). Conversely, if SAD participants are characterized by attentional biases away from emotional faces (Mansell et al. Reference Mansell, Clark, Ehlers and Chen1999; Horley et al. Reference Horley, Williams, Gonsalvez and Gordon2003; Heuer et al. Reference Heuer, Rinck and Becker2007) at later stages of the information processing flow, we predicted that they would show decreased P1 amplitudes to emotionally cued probes. We further examined whether these effects are restricted to probes replacing angry–neutral face pairs (valence effect) or whether they generalize also to happy–neutral face pairs (emotionality effect) (Martin et al. Reference Martin, Williams and Clark1991).
To investigate the specificity of putative P1 findings, exploratory analyses focused on additional ERP components, including the C1, N170 and N1 components. The C1 originates from the primary visual cortex (Di Russo et al. Reference Di Russo, Martínez and Hillyard2003) and is typically unaffected by attention (Clark & Hillyard, Reference Clark and Hillyard1996), although threat-related stimuli have been found to modulate this component (Stolarova et al. Reference Stolarova, Keil and Moratti2006). The face-specific N170 (Bentin et al. Reference Bentin, Allison, Puce, Perez and McCarthy1996) was also analyzed, although it is still uncertain whether this component is affected by emotional facial expressions (Pizzagalli et al. Reference Pizzagalli, Lehmann, Hendrick, Regard, Pascual-Marqui and Davidson2002) or not (Eimer & Holmes, Reference Eimer and Holmes2007). Finally, N1 amplitudes following probe presentation were evaluated in light of evidence that this component might be attenuated by exogenously cued probes (Fu et al. Reference Fu, Caggiano, Greenwood and Parasuraman2005a).
As a behavioral measure we assessed RTs in response to the probe. If individuals with SAD are hypervigilant to threat (Bar-Haim et al. Reference Bar-Haim, Lamy, Pergamin, Bakermans-Kranenburg and van Ijzendoorn2007), we predicted that they would react faster to probes replacing angry faces than to probes replacing neutral faces. Conversely, if socially anxious individuals avoid angry and/or happy faces (Mansell et al. Reference Mansell, Clark, Ehlers and Chen1999), they should have longer RTs for probes preceded by emotional as opposed to neutral faces. Finally, using a signal-detection approach, we analyzed d′ to evaluate whether groups differed in their sensitivity towards probes cued by emotional faces.
Method
Participants
Sixteen SAD and 18 control participants were recruited through an out-patient anxiety disorders clinic and advertisements, respectively. SAD was diagnosed using the Anxiety Disorders Interview Schedule for DSM-IV – Lifetime Version (ADIS-IV-L; DiNardo et al. Reference DiNardo, Brown and Barlow1994). Control participants were screened with an abbreviated version of the ADIS-IV to confirm absence of psychopathology. All participants were right-handed (Chapman & Chapman, Reference Chapman and Chapman1987) and had no history of bipolar disorder, schizophrenia, psychosis or delusional disorders. Additional exclusion criteria included a current diagnosis of post-traumatic stress disorder, major depression with severity greater than mild to moderate (as indicated by an ADIS clinical severity rating of ⩾4), or current active suicidal ideation. Participants reported no psychoactive substance abuse, no unstable medical illness, and no past or current neurological illness. The study was approved by the human subjects committees of Harvard University and Boston University. All participants gave informed written consent.
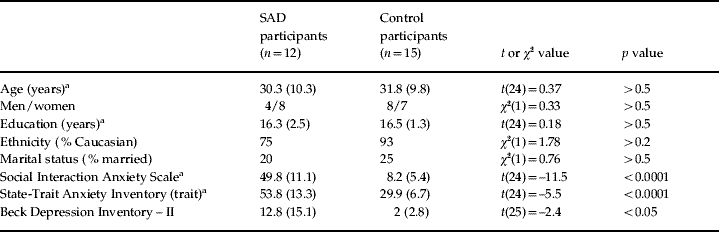
Seven participants (four SAD and three controls) were excluded because of excessive artifacts in the ERP data, leading to a final sample of 15 control and 12 SAD participants. Co-morbid diagnoses in the SAD group included generalized anxiety disorder (n=8), major depressive disorder (n=7), specific phobia (n=5) and obsessive compulsive disorder (n=3). Three SAD participants were receiving psychotropic medication at the time of the study (paroxetine, venlafaxine or setraline). All assessments were made prior to the patient's receiving cognitive-behavioral therapy at the Center for Anxiety and Related Disorders at Boston University. Control participants reported birth control (n=2), asthma (n=2) and diabetes (n=1) medications. As shown in Table 1, the groups did not differ in sociodemographic characteristics. Relative to controls, participants in the SAD group reported higher levels of social anxiety, trait anxiety and depression, as assessed by the Social Interaction Anxiety Scale (SIAS; Mattick & Clarke, Reference Mattick and Clarke1998), the State-Trait Anxiety Inventory (STAI; Spielberger & Gorsuch, Reference Spielberger and Gorsuch1983) and the Beck Depression Inventory – II (BDI-II; Beck et al. Reference Beck, Steer and Brown1996) respectively.
Summary of sociodemographic and self-report measures of mood and symptom severity for participants with social anxiety disorder (SAD) and healthy controls
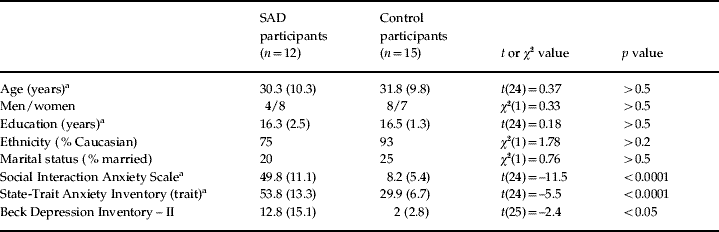
Values given as means (standard deviations).
a Degrees of freedom (df)=24 because of missing values for one participant.
Dot-probe task
The task was a modified dot-probe task adapted from Pourtois et al. (Reference Pourtois, Grandjean, Sander and Vuilleumier2004), and described in more detail in a recent independent study from our laboratory (Santesso et al. Reference Santesso, Meuret, Hofmann, Mueller, Ratner, Roesch and Pizzagalli2008). Participants had to maintain fixation on a centrally presented cross. A pair of face stimuli was presented for 100 ms (one face in the upper left and one face in the upper right visual field). Each pair consisted of one neutral and one emotional (either angry or happy) face taken from the Ekman series (Ekman & Friesen, Reference Ekman and Friesen1976). Next, a black screen with the fixation cross was presented for a varying period of time (100–300 ms). Subsequently, a vertical or horizontal bar (the probe) was presented at either the location of the emotional face (‘emotionally cued trial’) or the neutral face (‘neutrally cued trial’), and one line of the fixation cross was thicker than the other. Participants were instructed to press a button whenever the thicker line of the fixation cross matched the orientation of the probe (go trial) and withhold a response otherwise (no-go trial). Trials were separated by intertrial intervals of 1250 ms, in which a black screen without a fixation cross was presented.
Participants first performed one practice block of 16 trials, followed by nine blocks of 80 trials that were separated by small breaks. Each block contained 24 go trials (30%) and 56 no-go trials (70%). The rationale for using the go/no-go paradigm with this particular trial ratio was to gather enough behavioral responses (derived from go trials) to allow reliable behavioral (RT and d′) analyses, while preserving a sufficient number of no-go trials for the ERP analyses (as elaborated below, only no-go trials were used to avoid movement-related artifacts). RT was recorded from probe onset. Trials with RTs that were <100 ms and >1500 ms and incorrect responses were excluded from the analyses. Based on signal detection theory, sensitivity towards probes cued by emotional versus neutral faces was calculated using the formula d′=z(FA) – z(HR), where FA and HR are the false alarm and hit rates respectively (Green & Swets, Reference Green and Swets1966).
Electroencephalogram (EEG) recording and data reduction
EEG was recorded using a 128-channel Electrical Geodesics system (EGI Inc., Eugene, OR, USA) in an acoustically and electrically shielded room at the Affective Neuroscience Laboratory at Harvard University. EEG data were recorded at 500 Hz with 0.1–200 Hz analog filtering and referenced to the vertex. Impedance of all channels was kept below 50 kΩ. Data were segmented and re-referenced off-line to an average reference, yielding 129-channel EEG data. EEG epochs were extracted beginning 100 ms before and ending 350 ms after stimulus presentation. Data were processed using the Brain Vision Analyzer (Brain Products GmbH, Germany). Each trial was visually inspected for movement artifact and then automatically removed with a ±75 μV criterion. Eye-movement artifacts were corrected by independent component analysis. To avoid movement-related artifacts, only no-go trials were used to compute ERPs. ERP amplitudes were derived from each individual's average waveform filtered at 0.1–30 Hz. For further details see Santesso et al. (Reference Santesso, Meuret, Hofmann, Mueller, Ratner, Roesch and Pizzagalli2008).
Primary ERP analyses focused on the P1 elicited by the face pairs (P1-face) and the probe (P1-probe), which were measured as the most positive peak in the time window of 80–150 ms following face or probe onset respectively. In line with Pourtois et al. (Reference Pourtois, Grandjean, Sander and Vuilleumier2004), P1-face and P1-probe were measured at PO7 and PO8 (corresponding to channels 66 and 85 on the EGI net; Luu & Ferree, Reference Luu and Ferree2000). To test the specificity of P1 findings, exploratory analyses were performed on the peak amplitudes of the C1, N170 and N1 components. The C1-face and C1-probe were measured 50–80 ms after stimulus presentation at POZ (channel 68), N170 at 130–210 ms after face presentation at P7 and P8 (channels 59 and 92) and N1 at 150–210 ms after probe presentation at PO7 and PO8. For all analyses, a prestimulus baseline (–100 to 0 ms) was used.
Low-resolution electromagnetic tomography (LORETA) whole-brain analyses
In the case of significant scalp P1 findings, LORETA (Pascual-Marqui et al. Reference Pascual-Marqui, Michel and Lehmann1994, Reference Pascual-Marqui, Lehmann, Koenig, Kochi, Merlo, Hell and Koukkou1999) was used to estimate intracerebral current density underlying such effects using information from all 129 channels. Validation for this source localization technique has been derived from studies combining LORETA with functional magnetic resonance imaging (fMRI; Vitacco et al. Reference Vitacco, Brandeis, Pascual-Marqui and Martin2002; Mulert et al. Reference Mulert, Jager, Schmitt, Bussfeld, Pogarell, Moller, Juckel and Hegerl2004), positron emission tomography (PET; Pizzagalli et al. Reference Pizzagalli, Oakes, Fox, Chung, Larson, Abercrombie, Schaefer, Benca and Davidson2004) and intracranial recordings (Zumsteg et al. Reference Zumsteg, Friedman, Wennberg and Wieser2005).Footnote 1Footnote † LORETA analyses reported in the current study closely mirror procedures described previously in detail (e.g. Pizzagalli et al. Reference Pizzagalli, Lehmann, Hendrick, Regard, Pascual-Marqui and Davidson2002, Reference Pizzagalli, Greischar and Davidson2003, Reference Pizzagalli, Oakes, Fox, Chung, Larson, Abercrombie, Schaefer, Benca and Davidson2004).
At each voxel (n=2394), current density (scaled to amperes per square meter, A/m2) was computed as the linear, weighted sum of the scalp electric potentials during windows of ±20 ms around the global field power (GFP) peaks.Footnote 2 The GFP peaks for P1-face (120 ms post-stimulus) and P1-probe (96 ms post-stimulus) were similar to the latencies of the scalp P1 peaks (122 ms and 102 ms respectively). For each subject, LORETA values were normalized to a total power of 1 and then log transformed before statistical analyses.
Statistical analyses
For RT and d′, 2×2×2×2 analyses of variance (ANOVAs) were performed with group (SAD versus control participants) as a between-subjects factor and visual field of the emotional face (left versus right), emotion (angry versus happy) and probe-position relative to the cue (emotionally versus neutrally cued) as within-subjects factors. For analyses of the ERP data, the factor electrode-position (left versus right hemisphere) was added. Amplitudes of probe-locked ERPs were thus analyzed with a group×visual field×emotion×probe-position×hemisphere ANOVA. Face-locked ERPs were analyzed with a group×visual field×emotion×hemisphere ANOVA because the factor probe-position was not present. Significant ANOVA effects were further explored by post-hoc t tests with Bonferroni α levels [α′=α/(number of tests)]. In this report, only effects involving the factor group are described (a full summary of the effects is available upon request).
For LORETA data, voxel-wise t tests (two-tailed) were performed to compare current density between groups or conditions. To minimize Type I errors, only activation clusters of more than 5 voxels exceeding p<0.01 were considered significant.
Results
Reaction time
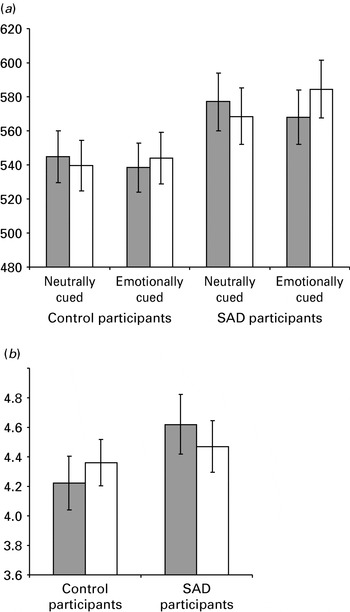
The emotion×probe-position interaction was significant [F(1, 25)=13.70, p<0.002, partial η²=0.35] (Fig. 1a). Follow-up t tests indicated that probes replacing angry faces were detected faster than probes replacing happy faces [t(25)=3.83, p<0.001] or neutral faces [t(25)=2.42, p<0.025], although only the first effect was significant after the Bonferroni correction (α′=0.0125, based on four planned t tests). A trend for longer RTs in response to probes replacing happy compared to neutral faces also emerged [t(25)=2.12, p<0.045]. There were no significant between-group effects.Footnote 3
(a) Reaction times (RTs) to the probe as a function of facial expression [angry ( ) versus happy (□)] and probe position (emotionally versus neutrally cued) in both control participants and participants with social anxiety disorder (SAD). (b) Mean d′ values as a function of facial expression [angry () versus happy (□)] in both control participants and participants with SAD. Bars denote standard errors.

In light of prior findings indicating that anxious individuals attend preferentially to threat-related relative to neutral stimuli (‘within-subject bias’) despite lack of differences between anxious and non-anxious subjects (‘between-subject bias’) (Bar-Haim et al. Reference Bar-Haim, Lamy, Pergamin, Bakermans-Kranenburg and van Ijzendoorn2007), separate ANOVAs were conducted for each group. The emotion×probe-position interaction was significant in the SAD group [F(1, 11)=32.0, p<0.0001, partial η2=0.74] but not in the control group [F(1, 14)=1.9, p=0.19, partial η2=0.12]. As hypothesized, follow-up t tests in the SAD group revealed faster reactions to probes replacing angry faces versus happy faces [t(11)=5.21, p<0.0002].Footnote 4 Moreover, a trend indicating hypervigilance to angry versus neutral faces emerged [t(11)=2.09, p<0.060]. Finally, following happy–neutral face pairs, SAD participants reacted faster to probes replacing neutral versus happy faces [t(11)=3.30, p<0.008]. For controls, none of these t tests reached significance (all p's>0.15).
Signal detection data (d′)
The emotion×group interaction was significant [F(1, 25)=5.35, p<0.030, partial η2=0.18] because of higher d′ values for SAD participants after the presentation of an angry–neutral relative to a happy–neutral face pair [t(11)=0.41, p<0.042] (Fig. 1b). No other effects emerged.
Electrophysiological measures
P1-face
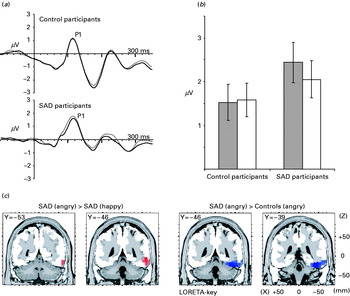
P1 amplitudes were greater over the right hemisphere [F(1, 25)=9.91, p<0.005, partial η2=0.28]. Importantly, the emotion×group interaction effect was significant [F(1, 25)=5.53, p<0.028, partial η2=0.18], indicating that groups differed in their relative P1 responses to angry versus happy faces. Within-group analyses further revealed that participants with SAD had larger P1 amplitudes for angry–neutral as opposed to happy–neutral face pairs [t(11)=3.58, p<0.005 (α′=0.0125)]. No significant differences emerged for control participants or between the groups (p's>0.1) (Fig. 2 a, b).
(a) Event-related potential (ERP) waveforms time-locked to the presentation of angry ( ) and happy (–––) face pairs at sensor 85 in the right hemisphere (equivalent to channel P08 in the 10/20 system) for control participants and participants with social anxiety disorder (SAD). (b) Mean P1 amplitude time-locked to angry () and happy (□) face pairs for control participants and participants with SAD. Bars denote standard errors. (c) Left: Results of voxel-by-voxel paired t tests contrasting current density 100–140 ms after presentation of angry–neutral face pairs versus happy–neutral face pairs for participants with SAD. Red: angry>happy. Right: Results of voxel-by-voxel unpaired t tests contrasting current density 100–140 ms after presentation of angry–neutral face pairs for participants with SAD versus control participants. Blue: participants with SAD>controls. Statistical maps are thresholded at p<0.01 and displayed on the MNI template.

P1-probe
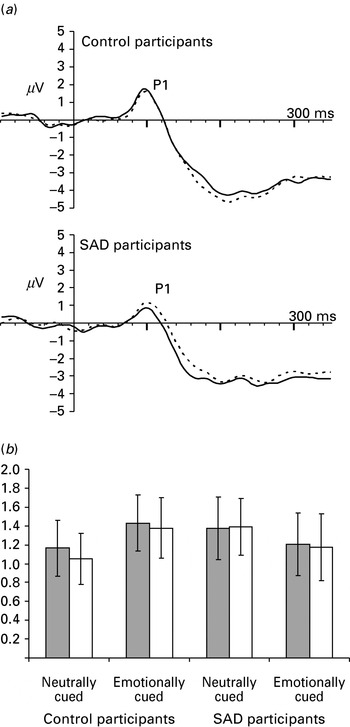
Similar to P1 evoked by the face pairs, amplitudes were higher over the right hemisphere [F(1, 25)=6.31, p<0.020, partial η2=0.20]. Of particular interest, the probe-position×group interaction effect was significant [F(1, 25)=11.39, p<0.003, partial η2=0.31], indicating that groups differed significantly in their relative responses to probes replacing emotional versus neutral faces. Follow-up tests indicated that SAD participants generated smaller P1 amplitudes for emotionally than neutrally cued trials [t(11)=3.42, p<0.007], whereas controls showed an opposite trend [t(14)=2.44, p<0.035] (Fig. 3). This effect was independent of the emotional expression [probe-position×emotion×group: F(1, 25)<1.00, p>0.5, partial η2=0.01]. No other significant main effects or interaction effects emerged.
(a) Event-related potential (ERP) waveforms at sensor 85 (PO8) in the right hemisphere for control and social anxiety disorder (SAD) participants. ERPs are time-locked to the onset of probes presented in the left hemisphere replacing angry (–––) or neutral faces (- - -) of angry–neutral face pairs. (b) Mean P1-probe amplitudes as a function of facial expression [angry () versus happy (□)] and probe position (emotionally versus neutrally cued) in control participants and participants with SAD. Bars denote standard errors.

Control analyses
To confirm that these results were not restricted to the electrode sites used, we repeated the ANOVAs with a cluster of surrounding electrodes (channels 59, 60, 66, 85, 86, 92 on the EGI net) and added electrode as an additional factor. Both the validity×group interaction for the P1-face [F(1, 25)=8.36, p<0.037, partial η2=0.16] and the emotion×group interaction for the P1-probe remained significant [F(1, 25)=10.41, p<0.005, partial η2=0.28].
Exploratory analyses
Relative to controls, SAD participants had smaller C1-face [F(1, 25)=7.73, p<0.010, partial η2=0.24] and N170 [F(1, 25)=6.11, p<0.021, partial η2=0.20] amplitudes. For the C1 and N170 amplitudes, no further effects emerged. For the N1 component, significant probe-position×group [F(1, 25)=11.23, p<0.004, partial η2=0.31] and hemisphere×emotion×group [F(1, 25)=5.13, p=0.032, partial η2=0.17] interactions emerged. Follow-up tests revealed that the first effect was driven by decreased N1 amplitudes for emotionally versus neutrally cued trials in control participants [t(14)=2.90, p=0.012]. The hemisphere×emotion×group interaction was due to larger N1 amplitudes to probes following happy–neutral face pairs over the right hemisphere for control versus SAD participants.
Source localization
P1-face
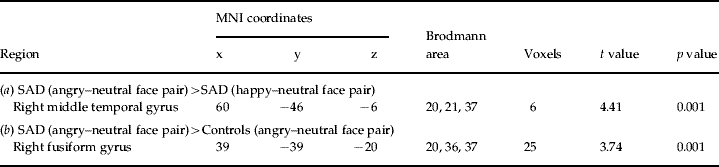
To localize the generator of the significant scalp amplitude differences between angry–neutral and happy–neutral face pairs in SAD participants, current density following angry–neutral and happy–neutral face pairs was compared within the SAD group. SAD participants showed higher activation after angry–neutral versus happy–neutral face pairs in a cluster around the right middle temporal gyrus, including the fusiform gyrus (FG) (BA 37) and the inferior temporal gyrus (BA 20/21/37) (Fig. 2 c and Table 2 a). No other regions were identified.
Summary of significant results emerging from whole-brain low-resolution electromagnetic tomography (LORETA) analyses 100–140 ms after presentation of face pairs
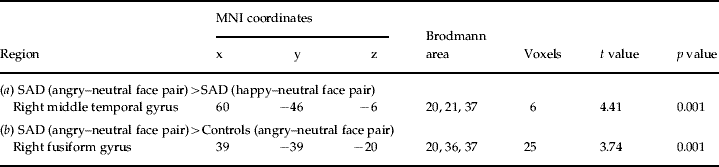
(a) The results of paired t tests contrasting LORETA activation to angry–neutral versus happy–neutral face pairs for participants with social anxiety disorder (SAD). Positive t values are indicative of stronger current density for angry–neutral than happy–neutral face pairs.
(b) The results of unpaired t tests contrasting LORETA activation to angry–neutral face pairs for SAD versus control participants. Positive t values are indicative of stronger current density for SAD than healthy controls. The anatomical regions, MNI (Montreal Neurological Institute) coordinates and Brodmann area of extreme t values are listed. The numbers of voxels exceeding the statistical threshold (p<0.01) are also reported. Coordinates in mm (MNI space), origin at anterior commissure; (x)=left (−) to right (+); (y)=posterior (−) to anterior (+); (z)=inferior (−) to superior (+).
To explore whether this region was also more activated in SAD relative to control participants, current density to angry–neutral face pairs was compared between groups. Independent voxel-wise t tests revealed that, following angry–neutral face pairs, SAD participants displayed significantly higher activation than control participants in the right FG (BA 20/21/37) (Fig. 2c and Table 2b). No other regions exceeded the statistical threshold.
P1-probe
LORETA analyses evaluating potential neural generators underlying the scalp finding of smaller P1 amplitudes for emotionally than neutrally cued trials in SAD participants revealed no significant findings.
Discussion
The aim of the present study was to investigate attentional biases in SAD during a dot-probe task using ERP and source localization techniques. Several findings relevant to the initial hypotheses emerged. First, SAD, but not control, participants showed increased P1 amplitudes and FG activation to angry–neutral versus happy–neutral face pairs, and a reliable emotion×group interaction indicated that SAD participants had a significantly larger P1 potentiation to angry faces relative to happy faces compared to control participants. Second, SAD participants had smaller P1 amplitudes to probes replacing emotional rather than neutral faces, whereas control participants showed an opposite pattern. A significant probe-position×group interaction indicated that SAD participants had significantly reduced P1 responses to probes replacing emotional versus neutral faces compared to control participants. Third, SAD participants reacted faster to probes replacing angry versus happy faces, although no group differences emerged from the RT data. Fourth, SAD, but not control, participants showed higher sensitivity (d′ values) in response to probes following the presentation of angry versus happy faces.
Previous studies have shown that the P1 component is amplified in response to negatively valenced facial expressions (Streit et al. Reference Streit, Dammers, Simsek-Kraues, Brinkmeyer, Wolwer and Ioannides2003; Klucharev & Sams, Reference Klucharev and Sams2004; Pourtois et al. Reference Pourtois, Dan, Grandjean, Sander and Vuilleumier2005) and that increased P1 to threat-related cues is larger for high compared to low trait anxious individuals (Li et al. Reference Li, Zinbarg, Boehm and Paller2008; see also Kolassa & Miltner, Reference Kolassa and Miltner2006). Similar to P1 enhancements due to heightened attention in studies with non-emotional stimuli (Hillyard & Anllo-Vento, Reference Hillyard and Anllo-Vento1998), P1 enhancements to threat-stimuli were found to originate from extrastriate generators (e.g. FG) (Pourtois et al. Reference Pourtois, Dan, Grandjean, Sander and Vuilleumier2005) and have therefore been assumed to indicate increased attention to threat (Vuilleumier & Pourtois, Reference Vuilleumier and Pourtois2007). In SAD participants, the finding of enhanced P1 amplitudes when an angry face was present might thus indicate initial hypervigilance to threat, and mirrors (a) the RT data suggesting shorter RTs to probes replacing angry than happy faces and (b) the increased visual sensitivity following angry versus happy faces. Analyses of d′ values indeed revealed that SAD participants were characterized by an increased visual sensitivity in both visual fields after the presentation of an angry face. Moreover, RTs were shortened at locations cued by an angry face. Of interest, SAD participants also reacted faster to probes preceded by neutral versus happy faces. When seen within the framework of prior findings indicating that SAD participants show increased activation relative to controls in anxiety-related brain regions in response to both neutral (Cooney et al. Reference Cooney, Atlas, Joormann, Eugène and Gotlib2006) and angry (Straube et al. Reference Straube, Kolassa, Glauer, Mentzel and Miltner2004) faces, the present ERP and behavioral findings converge in suggesting that, in SAD, attention is initially oriented towards the relatively more threatening cue in the environment. These results are consistent with the cognitive model of SAD (Clark & Wells, Reference Clark, Wells, Heimberg, Liebowitz, Hope and Schneier1995; Rapee & Heimberg, Reference Rapee and Heimberg1997; Hofmann, Reference Hofmann2007).
In the present study, source localization analyses indicated that potentiated P1 responses to angry versus happy face pairs were associated with hyperactivation in the posterior FG. FG activation within the P1 time-range has been reported in healthy controls in response to aversive stimuli (Pizzagalli et al. Reference Pizzagalli, Greischar and Davidson2003; Streit et al. Reference Streit, Dammers, Simsek-Kraues, Brinkmeyer, Wolwer and Ioannides2003). Moreover, P1 amplitudes have been associated with changes in posterior FG activation measured with PET (Mangun et al. Reference Mangun, Hopfinger and Heinze1998). Importantly, the FG receives direct projections from the amygdala (Amaral et al. Reference Amaral, Price, Pitkanen, Carmichael and Aggleton1992), which has been found to (a) respond to facial stimuli as early as 120 ms after presentation (Halgren et al. Reference Halgren, Baudena, Heit, Clarke, Marinkovic and Clarke1994); (b) be sensitive to threat-related cues (Buchel & Dolan, Reference Buchel and Dolan2000); and (c) be implicated in the pathophysiology of SAD (Etkin & Wager, Reference Etkin and Wager2007). Based on the convergence of these findings, we speculate that the P1 finding of hypervigilance to angry faces might be linked to increased amygdalar activation in SAD.
Extending prior fMRI findings highlighting FG hyperactivation in SAD (Etkin & Wager, Reference Etkin and Wager2007), the present results provide important insight into the temporal dynamics of brain mechanisms associated with early attentional biases in SAD. Specifically, we showed that functional abnormalities within the visual cortex unfold as early as 100 ms after stimulus presentation. ERP techniques cannot be used, however, to ascertain whether this potentiated activation reflects top-down influences from the frontoparietal network or direct influences from the amygdala (Vuilleumier & Pourtois, Reference Vuilleumier and Pourtois2007). Consequently, future studies that combine ERP and hemodynamic measurements in SAD should further investigate this important issue.
In contrast to the face-evoked P1 findings, this study also found evidence that individuals with SAD might show, at later stages of the information processing flow, reduced visual processing at emotionally cued locations. In SAD participants, probes replacing angry and happy faces in fact elicited smaller P1 amplitudes than probes replacing neutral faces. Control participants showed the opposite pattern.Footnote 5 Similarly, Santesso et al. (Reference Santesso, Meuret, Hofmann, Mueller, Ratner, Roesch and Pizzagalli2008) showed that non-anxious adults exhibited larger P1s to emotionally versus neutrally cued probes, but only following angry faces.
At least two interpretations for the P1-probe effect in SAD can be advanced. First, it is possible that visual processing of the probes was disrupted by continuing processing of preceding emotional faces (Rossignol et al. Reference Rossignol, Anselme, Vermeulen, Philippot and Campanella2007), resulting in smaller P1 amplitudes. Although plausible, this interpretation cannot explain the finding of increased amplitudes to emotionally cued probes in control participants. An alternative explanation is that SAD participants either attended the more ambiguous stimulus present in the visual field (i.e. the neutral face) (Cooney et al. Reference Cooney, Atlas, Joormann, Eugène and Gotlib2006) or showed attentional avoidance away from emotional faces (Mansell et al. Reference Mansell, Clark, Ehlers and Chen1999) at later stages of the information processing flow. If the latter is true, it remains to be tested whether attentional avoidance in SAD participants might occur automatically or might be controlled by strategic influences (Amir et al. Reference Amir, Foa and Coles1998). Regardless of the mechanisms, it is interesting to note that SAD participants showed significantly reduced overall face-locked C1 and N170 amplitudes relative to controls. This finding is consistent with the hypotheses that certain aspects of face processing might be avoided (Chen et al. Reference Chen, Ehlers, Clark and Mansell2002) or disrupted (e.g. Horley et al. Reference Horley, Williams, Gonsalvez and Gordon2004) in SAD (we note, however, that in contrast to P1, the C1 and N170 group differences were not modulated by emotions).
Similar to our previous study (Santesso et al. Reference Santesso, Meuret, Hofmann, Mueller, Ratner, Roesch and Pizzagalli2008), LORETA analyses of probe-evoked ERPs did not reveal differential activation in brain regions typically associated with attention-related P1 effects (i.e. extrastriate visual areas) (Mangun et al. Reference Mangun, Hopfinger and Heinze1998). A possible explanation is that differences between neutrally and emotionally cued probes emerging at the scalp level were not strong enough to reach statistical significance in the LORETA analyses, which used a higher statistical threshold and might be affected by additional sources of variance (e.g. assumption of a spherical head, issues with the inverse problem). However, it should be emphasized that the P1 effect to the probe was right-lateralized, replicating prior findings (Pourtois et al. Reference Pourtois, Grandjean, Sander and Vuilleumier2004). Similarly, the P1 to the face was also more pronounced in the right hemisphere, in line with a substantial literature emphasizing right hemisphere dominance for face processing (Adolphs, Reference Adolphs2002).
The limitations of the present study should be acknowledged. First, although ERP analyses provided evidence for abnormal attentional processes in SAD participants, no group differences emerged for RT data. This may be due to our relatively small sample size, which represents one of the main limitations of this study, and/or to the specific characteristics of our paradigm, particularly the chosen stimulus-onset asynchronies and its go/no-go component. Unlike classic dot-probe studies in which a behavioral response is required on each trial, our participants had to withhold responses on no-go trials, possibly introducing novel sources of variance (e.g. decision making, inhibition of motor responses). Moreover, by design, ERP waveforms were derived exclusively from no-go trials to avoid potential contamination of movement artifacts to early ERP components (e.g. C1), whereas RT data were assessed during go trials. Thus, although this particular version of the dot-probe paradigm has been found to induce reliable ERP correlates of attentional biases in two independent control samples (e.g. Pourtois et al. Reference Pourtois, Grandjean, Sander and Vuilleumier2004; Santesso et al. Reference Santesso, Meuret, Hofmann, Mueller, Ratner, Roesch and Pizzagalli2008), the integration of RT and ERP data is suboptimal.
An alternative explanation for the lack of group RT differences may be reduced power for the behavioral analyses, particularly because only 30% of the trials (i.e. go trials) could be used for behavioral analyses. Nevertheless, separate analyses for each group revealed that SAD, but not control, participants did react significantly faster to probes cued by angry as opposed to happy or neutral faces (‘within-subjects bias’; Bar-Haim et al. Reference Bar-Haim, Lamy, Pergamin, Bakermans-Kranenburg and van Ijzendoorn2007).
A final limitation of the present study arises from presenting probes with random interstimulus intervals (100–300 ms). Although this technique reduces overlap from early and later ERP components, it also prevents a precise delineation of the time course of attentional effects. To better understand the temporal unfolding of attentional biases in SAD, ERP studies using both short (e.g. 100 ms) and long (e.g. 500 ms) stimulus-onset asynchronies in the same participants will be required.
Despite these limitations, the present study suggests that, for participants with SAD, early (possibly amygdala-related) threat detection may trigger increased activation in visual areas (including the FG) leading to rapid hypervigilance, which was reflected in potentiated P1 responses, increased accuracy, and shortened RTs to angry faces. In addition to this initial hypervigilance, SAD participants were characterized by reduced visual processing of emotionally cued locations during the P1-probe time-window. When seen within the framework of other studies (e.g. Amir et al. Reference Amir, Foa and Coles1998; Vassilopoulos, Reference Vassilopoulos2005; Garner et al. Reference Garner, Mogg and Bradley2006), the present ERP findings suggest the presence of a hypervigilant-avoidant pattern of attention in SAD. We recommend that future studies examine whether these ERP findings extend to emotional expressions of varying degrees and valences, and/or to other anxiety disorders in order to clarify how hypervigilance and avoidance play a role in the maintenance of these disorders and their potential cognitive treatments.
Acknowledgements
This work was partially supported by National Institute of Mental Health (NIMH) grants R01MH68376 awarded to D. A. Pizzagalli and R01MH078308 awarded to S. G. Hofmann.
Declaration of Interest
Dr Pizzagalli has received research support from GlaxoSmithKline and Merck & Co. Inc. for projects unrelated to the present study. Dr Hofmann is a paid consultant by Organon for issues and projects unrelated to this study.