Introduction
Activated carbon (AC) is widely used in industrial fields as well as in civil life because of a high specific surface area, abundant pore volume, variable surface chemical properties and high mechanical strength, as well as strong physical adsorption capacity [Reference Walker and Weatherley1]. AC is mainly used for water purification, wastewater treatment, adsorption of harmful gases, electrode materials, hydrogen storage materials, etc.
The traditional AC is mainly made of coal as raw material. However, taking the coal as the precursor was considered costly. In recent years, with the improvement of people’s living standards, the demand for AC is increasing sharply. Therefore, a new cheap material for the preparation of AC is urgently needed to be discovered.
Biomass is a kind of agricultural and forestry waste, which has wide sources and low price. Recently, some researchers began to prepare AC from biomass. It was proved that the agricultural by-products can be used for the preparation of AC with a high adsorption capacity for dye [Reference Savova, Apak, Ekinci, Yardim, Petrov, Budinova, Razvigorova and Minkova2]. Most of biomass waste reported for preparation AC are bamboo [Reference Liu, Tong, Peng and Liang3], bagasse [Reference Tsai, Chang, Lin, Chien, Sun and Hsieh4], olive stones [Reference Martínez, Torres, Guzmán and Maestri5], and cotton stalk [Reference Deng, Yang, Tao and Dai6].
Recently, plastic products or high-molecular polymer has been investigated for the preparation of AC. Duan Yuandong, Song Lingjun, [Reference Song7] and Hui Li [Reference Li, Yuan, Tang, Wang, Sun, Li, Tang, Wang, Gong and He8] have focused on the preparation of AC from plastic products or high-molecular polymer. It has already been proven that some specific plastic products like polypropylene plastic (PP) can improve the stability and the molecular weight size of lignin, which produces the positive effect to the lignin carbonization.
In recent years, many studies had been reported on the preparation of AC from various agricultural wastes and sludge, rubber by-products and plastic products. However, few articles have been reported on the preparation of AC from the mixture of sycamore sawdust (SS) and PP was chemically activated for dyes adsorption although PP may have a greater impact on the performance of ACs. Thus, a new method of preparing AC with a high surface area from the mixture of biomass and PP is proposed in this article.
In this article, ACs were prepared from the mixture of SS and PP by chemical activation, followed by characterized by BET surface area, ash analysis, elemental analysis, iodine number and surface functional group analysis by Fourier transform–infrared spectroscopy (FT-IR) analysis and scanning electron microscopy (SEM). Meanwhile, the adsorption properties of the AC for methylene blue (MB), including adsorption kinetics and adsorption isotherm, were studied.
Results and discussion
Characterizing pore structure of ACs
In this section, the effect of PP addition was investigated to the morphology and structure of AC. The characteristics of the obtained AC may be influenced by the raw material or precursor [Reference Mozammel, Masahiro and Bhattacharya9]. Therefore, the effect of PP addition was studied when the PP content was set to 0, 10, 20, 30, and 40%, respectively, in this section. AC was prepared under the condition of a mass ratio of 2 (activator to sawdust), an activation temperature of 950 °C, and an activation time of 40 min.
Nitrogen adsorption
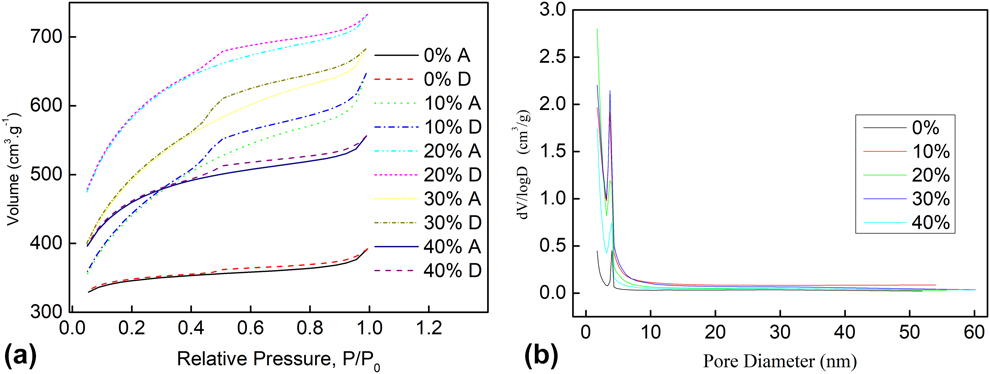
Figure 1(a) showed the N2 adsorption–desorption isotherms and Fig. 1(b) showed the pore-size distribution of the AC, investigating the surface characteristics of the final products.
(a) N2 adsorption–desorption isotherms, and (b) BJH adsorption cumulative pore volume for granular AC.
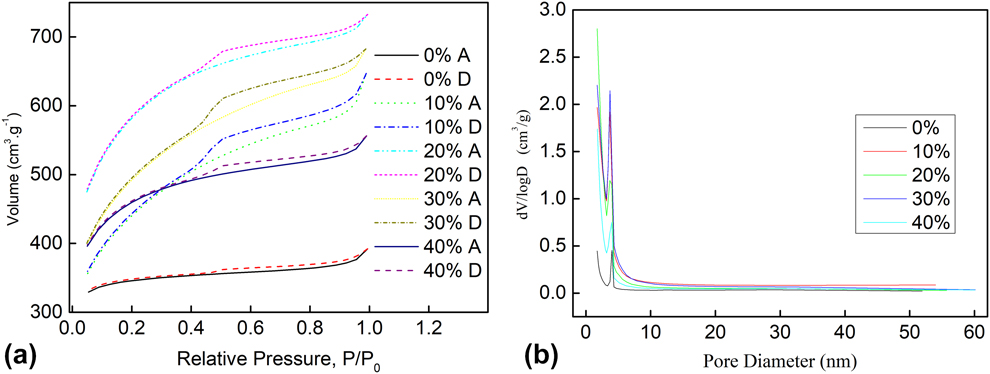
According to IUPAC, the physical adsorption isotherms can be divided into 6 categories. The various adsorption isotherms in practice are basically the different combinations of 6 kinds of isotherms [Reference Gregg and Sing10]. All isotherms exhibited a type Ⅱ character nitrogen isotherm from Fig. 1(a). At low relative pressure (P/P 0 < 0.2) and high relative pressure, the hysteresis loop rised sharply, revealing the presence of micropores in the porous structure. In addition, the isotherm showed a B-type hysteresis loop, indicating there were parallel slit-shaped pores in AC [Reference Boer11]. According to the results, the average pore size was 2.6339 nm and the total pore volume was 1.1186 cm3/g, indicating that the AC mainly contains mesoporous pores. As can be seen from the distribution of the diameter of AC in Fig. 1(b), the pore size of AC was concentrated at about 4 nm, indicating that the sample mainly contains mesoporous structure.
Activate SS with different PP contents to obtain AC. Table I showed the ash content and elemental composition of the obtained AC. The ash content of samples varied from 8.58 to 12.58%. The ash content was slightly higher, considering that some of the nonwashed salts remain in AC. Ash was obviously decreased when the PP was added. The more the PP content the less the ash. The less ash formed after the carbonization of the PP when the proportion of PP was increased.
Some physicochemical characteristics of the ACs obtained.

According to the result of elemental analysis, the content of O and H elements in the AC samples was greatly reduced compared with the raw material, whereas the content of C element greatly increases. This result was due to the fact that part of the O and H elements was removed in the form of water. Meanwhile, it can be seen from the Table I that the content of PP rarely takes effect on the element composition of produce AC.
Both the elements in the AC sample through adding PP and the ordinary AC sample are almost the same. This was taken into account that the main elements in the PP were roughly the same as the SS.
The iodine number was an index used to determine the porosity and adsorption capacity of AC [Reference Ozdemir, Şahin, Orhan and Erdem12]. The results were given in Table I, showing that the iodine number increases first and then decreases with the increase of PP content. Especially, when the PP content was 20%, the iodine number reached the maximum of 1460 mg/g, which was in accordance with the trend of BET.
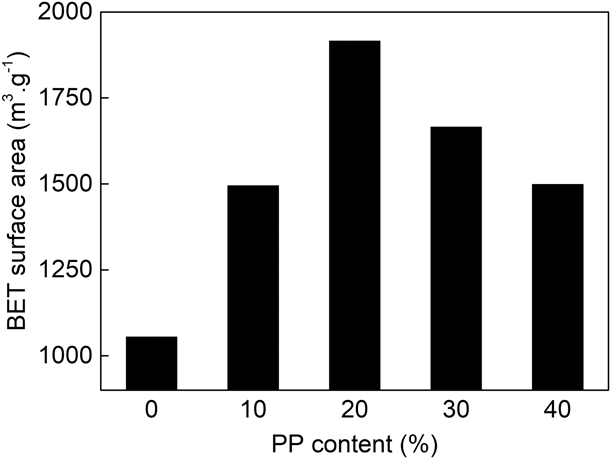
Figure 2 showed the BET surface area of AC. It was changed from 1055.1 to 1916.1 m2/g, with the increase of the PP content from 0 to 20%. When the PP content was over 20%, the BET surface area began to drop. This can be explained that the heat loss of PP occurs in the range of 385–490 °C; the pyrolysis residue rate was 1.4% [Reference Liu, Ma, Chen, Zhao and Zhou13]. However, the biomass will decompose only when the temperature was higher than 700 °C, under the action of activation reagent [Reference Li-ping, Wei-gang and Xue-min14]. Therefore, when the experimental temperature increases, the PP precipitate first, the original space occupied by PP formed a rich pore structure, which allowed the activation reagent to enter the interior of the AC. At the same time, porous effect enhanced heat transfer effect, resulting in that the center temperature of columnar AC was close to the surface, and the activation process was more homogeneous. More pores with adsorption capacity were developed. When the PP content was more than 20%, the reaction was accelerated, the original pore structure was ablated because the reaction is accelerated and the material is further activated [Reference Li-ping, Wei-gang and Xue-min14].
Effect of PP content on BET surface area.

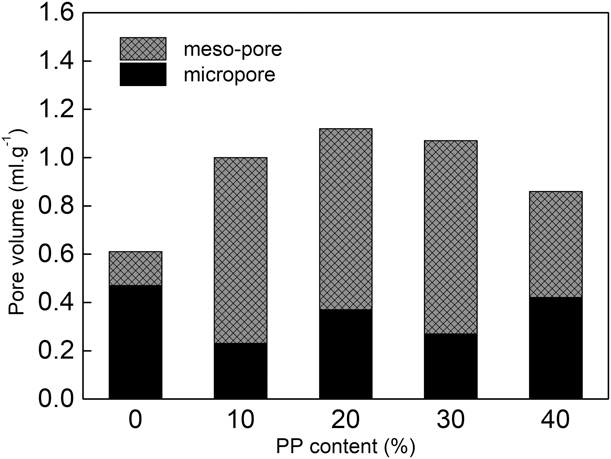
It can be seen from Fig. 3 that mesopore volume and mesopore rate increased. The pore volume of the micropore decreased a little and then rises slightly, but the range was much smaller than that of mesopores. It indicated that the pore structure was transformed into the mesoporous structure. During the activation process, the mesoporous pores were mainly formed after the PP were separated from the original pores.
Pore volume distribution of AC.

Comparison of the external surfaces of ACs using SEM
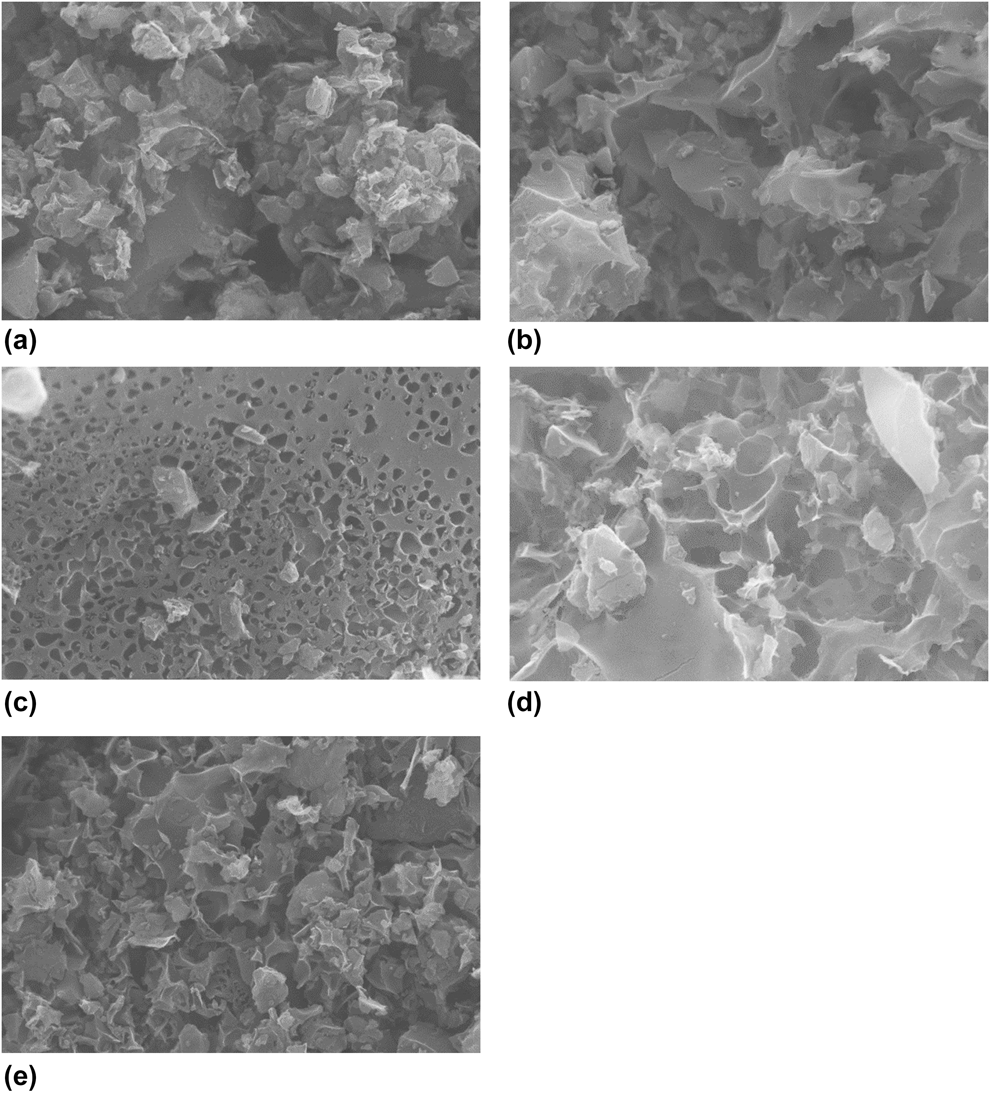
Figure 4 showed the SEM images of AC prepared. It could be seen that the PP takes an effect on the surface morphology of AC. The surface of the AC prepared without the addition of PP was moderately smooth. There were fewer channels and large pore structures on the surface of AC. SEM images show the slightly damaged and a rough surface with the addition of PP in preparation process. Developed porosity structures were observed in Fig. 4(c) when the addition of PP is 20%, which was caused by the dehydration of the activator and PP promoting the development of porosity.
SEM photograph of ACs (a, b, c, d, and e represent SEM graphs with PP content of 0%, 10%, 20%, 30%, and 40%, respectively).

Surface chemistry of the ACs
To determine the surface functional groups of AC, samples with different PP content prepared under the same activation condition were selected for FTIR analysis. The results could be seen from Fig. S1.
Such compound spectra give information related to the chemical bonds, which give the detailed molecular structure of the materials. Table SI shows the information of FTIR corresponding to the chemical functional groups studied in literature. In Fig. S1, the spectra of these AC samples exhibited very similar adsorption patterns, but differed in absorbance intensity. This suggests that the functional groups were similar in these AC samples, the peaks of which at 1610 cm−1, 1375 cm−1, and 1100 cm−1 were ascribed to C=O, –CH, and C–O, respectively [Reference Chuang, Siengchum and Isenberg15].
Analysis of thermal characteristic
It can be observed the mass of the raw material changes with temperature by thermogravimetric analysis (TG), which reflect the degree of pyrolysis of the sample. In this work, the temperature rising range (from 50 to 950 °C) and heating rate (10 °C/min) were similar to that during the carbonization process. The pyrolysis of pure SS and mixture (SS with 20% PP) was analyzed.
Shafizadeh et al. [Reference Shafizadeh16] found that the pyrolysis temperature of three components of biomass (hemicellulose, cellulose and lignin) were 150–350 °C, 275–350 °C, 250–500 °C, respectively. For pure SS, during the whole pyrolysis process, there were three significant peaks in the DTG curve [Fig. S2(a)]. The mass loss occurring at 50–150 °C was mainly caused by the evaporation of water. At this stage, there were about 10% weight loss, which was close to the moisture percentage of the SS (Table SIV). The second peak was observed when the temperature reached 200 °C, which mainly due to hemicellulose began pyrolysis in a large scale and the cellulose begins to pyrolysis at 200 °C. At this time, the products were mainly water steam, CO2 and hydrocarbons [Reference Shen and Gu17]. The third sharp peak was observed when the temperature reached 300 °C. Because cellulose has the highest decomposition rate at 300 °C [Reference Lou, Wu and Lv18]. When the temperature exceeded 500 °C, the pyrolysis of the three components in biomass was completed. Therefore, the mass of the remaining samples did not change significantly.
For mixture of SS and PP, there were four apparent weightlessness peaks in the DTG curve [Fig. S2(b)]. However, temperatures of the peaks of the mixture were different from that of the SS. The second peaks and the third peaks appear when temperatures increase to 300 and 460 °C, respectively, which was probably because the pyrolysis interval of plastic was slightly higher than that of cellulose. Therefore, the pyrolysis temperature range of the mixture moves to the right. At the same time, the mass loss of these two stages was about 60%, which was larger than the mass loss of pure sawdust. After more than 600 °C, the mass of the sample was stable at 12%.
Tang et al. [Reference Tang, Dang, He, Li, Kong, Tang and Gu19] compared the heat-resistance index (T HRI) and T g value of f-Kevlar cloth/BADCy and pristine Kevlar cloth/BADCy wave-transparent laminated composites, and the values were increased by 4.5 and 12.1%, indicating that adding POSS made the functional Kevlar/BADCy substrate interface more stable. Gu et al. [Reference Gu, Lv, Wu, Guo, Tian, Qiu, Li and Zhang20] fabricated the dielectric thermally conductive mBN/PI composites with excellent dielectric constant, high thermal conductivity and excellent thermal stability (T HRI of 279 °C and glass transition temperature of 240 °C), which has a great potential in integration and miniaturization of microelectronic devices.
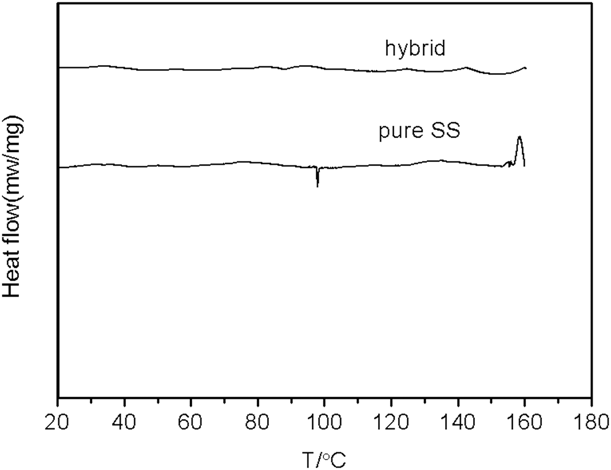
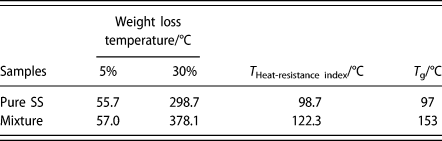
Figure 5 showed the DSC curves of the pure SS and mixture, and the corresponding thermal data are listed in Table II. The mixture had higher T HRI (122.3 °C) value than pure SS (T HRI of 98.7 °C), but lower T g value (122.3 °C) than pure SS (T g of 153 °C). The results showed that the mixture had better thermal stability.
 $${T_{{\rm{Heat ‐ resistance}}\;{\rm{index}}}} = 0.49 \times \left[ {{T_5} + 0.6 \times \left( {{T_{30}} - {T_5}} \right)} \right]\quad,$$
where T 5 and T 30 are corresponding decomposition temperatures of 5% and 30% weight loss, respectively [Reference Guo, Lyu, Yang, Lu, Ruan, Wu, Kong and Gu21].
The DSC curves of pure SS and mixture.

Characteristic thermal data of pure SS and the mixture.
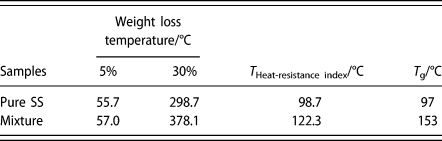
The T Heat-resistance index was calculated by Eq. (1).
If it is considered that there is no interaction between the plastics and biomass during the co-pyrolysis process, the characteristic parameters of the pyrolysis of the mixture can be calculated by the mixing ratio weighting of the characteristic parameters of the pyrolysis of the two substances separately [Reference Zhu, Song and Lin22].
 $${w_{{\rm{calculated}}}} = {w_{{\rm{b,t}}}}{v_{\rm{b}}} + {w_{{\rm{c,t}}}}\left( {1 - {v_{\rm{b}}}} \right)\quad ,$$
where w b,t and w c,t are the pyrolysis weightlessness rates of PP and SS, respectively, v b is the PP content in mixed sample proportion.
Comparing the calculated characteristic parameters with experimental values, whether there is a synergistic effect between them could be determined [Reference Moghtaderi, Meesri and Wall23]. By calculating the relative deviations between the calculated and experimental values (δ, %) with Eq. (3), the degree of interaction between the materials in the pyrolysis can be measured.
 $$\delta = {{\left[ {{{\left( w \right)}_{{\rm{measured}}}} - {{\left( w \right)}_{{\rm{calculated}}}}} \right]} \over {{{\left( w \right)}_{{\rm{measured}}}}}} \times 100\% \quad .$$
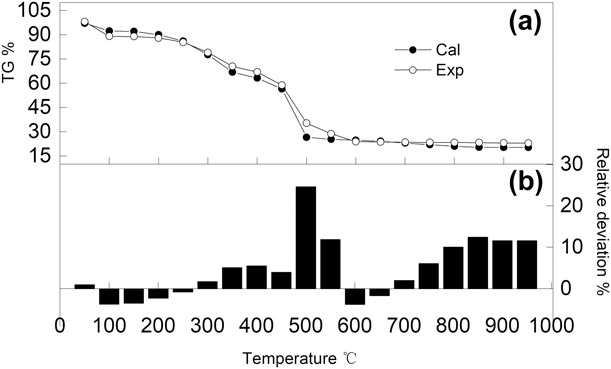
Figure 6 showed the comparison between calculated value and experimental value of the weight loss rate of the mixture. It can be clearly seen in the diagram that the pyrolysis of the mixture is obvious synergy at 500–600 °C and after 750 °C. The higher weightlessness rate is beneficial to the preparation of AC and can promote the adsorption capacity of AC. Therefore, it can be preliminarily considered that adding proper amount of PP into sawdust can improve the adsorption performance of the prepared AC.
(a) Comparison between calculated and experimental values of weight loss ratio, (b) Variation of relative deviation.

Adsorption studies of MB onto AC
Adsorption isotherm
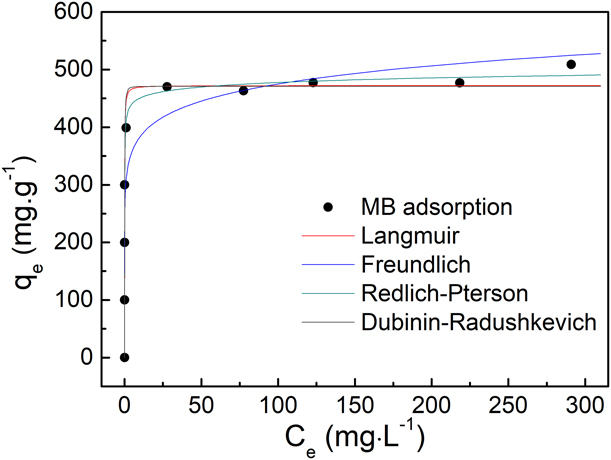
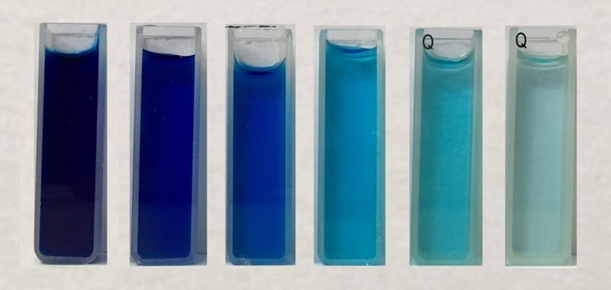
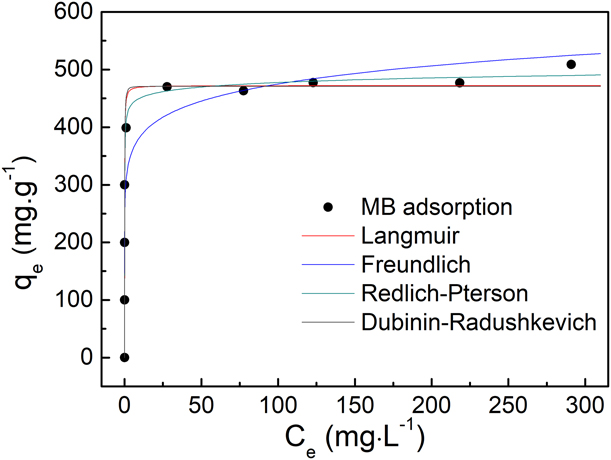
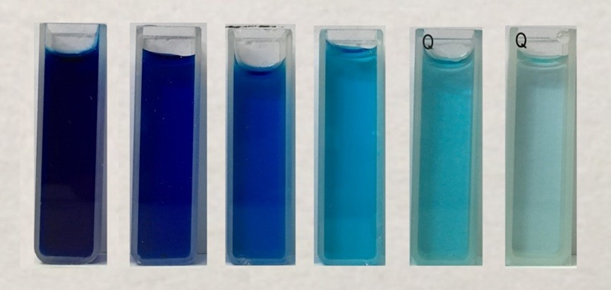
The isotherm reflected the nature of the surface properties of the solid, the pore structure and the force between the gas–solid molecules. When adsorption was balanced, it can also predict how adsorption molecules were distributed at the solid/liquid interface. The nonlinear fit of experimental data to Langmuir, Freundlich, Redlich–peterson and Dubinin–Radushkevich isotherm models was shown in Fig. 7, and the obtained parameters for each model were listed in (Table SII). Figure 8 was the MB solution at different adsorption time in the adsorption kinetics experiment, which could be seen that the concentration of MB was getting lower and lower as the time of adsorption was prolonged.
Non-linear fits of Langmuir, Freundlich, Redlich–Peterson and Dubinin–Radushkevich isotherm models to the MB adsorption.
MB solution at different adsorption time in the adsorption kinetics experiment (The adsorption time from left to right is prolonged in turn).
From the results, considering the highest R 2 and the low value of Δq, the Redlich–Peterson model fitted better to the experimental data. It was composed of a combination of the Freundlich and Langmuir models, which were distinguished by an exponential, g. When the g parameter of the equation (Table SII) took a value of 0, the Redlich–Peterson model converged to Henry model. Conversely, when g approached 1, the behavior of the model followed the Langmuir isotherm. Besides, if g was less than 1 and the K RP and a RP constants are far greater than 1, the Redlich–Peterson isotherm is reduced to Freundlich model. Taking g value (0.9894) into consideration, the isotherm behavior was present as the Langmuir isotherm model, and the adsorption process occurred on the uniform surface [Reference Rangabhashiyam and Selvaraju24]. It can be inferred from the theoretical basis of Langmuir isotherm model that the AC had uniform surface and adsorption energy equivalent sites; molecules occupy free sites by monolayer adsorption, where interactions were negligible [Reference Ignatowicz25]. The maximum monolayer adsorption capacity (q m) determined by Langmuir model was 472.19 mg/g, closing to the experimental value (476.88 mg/g). R L was a dimensionless separation factor for the Langmuir isotherm and was an important parameter to characterize whether the adsorption process was favorable (0 < R L < 1), linear (R L = 1), unfavorable (R L > 1) or irreversible (R L = 0). As can be seen from Table SII, AC adsorption of MB was favorable as well as irreversible since the R L values were very close to 0 (0.00007–0.0006).
The Freundlich model considers the empirical assumption that adsorption process occurs on multiple surfaces. It can be seen from Fig. 7 and Table SII that the model did not adequately describe the experimental data, which was evidenced by a lower R 2 value (0.8919) and the higher Δq e value (4.46%). The n F parameters reflected important information, which indicates the adsorption process was physical since its value (10.73) was bigger than 10.
The Dubinin–Radushkevick model is important for providing information on the adsorption properties of the free energy involved [Reference Rangabhashiyam and Selvaraju24]. From the K DR constant in the Table SII, the adsorption of free energy (E) can be calculated, which was 5.97 kJ/mol. When the E value ranges from 4 to 8 kJ/mol, the adsorption process is mainly influenced by the intermolecular Van der Waals forces and physical adsorption. When the value of E is in 2–40 kJ/mol, the adsorption mechanism is mainly intermolecular hydrogen bond. When the value of E is in 60–80 kJ/mol, the adsorption mechanism dominated by chemical adsorption [Reference Site26]. In this work, the value of E is 5.9667 kJ/mol, which means the existence of intermolecular Van der Waals forces and the intermolecular hydrogen bonding in the adsorption process.
Adsorption kinetics
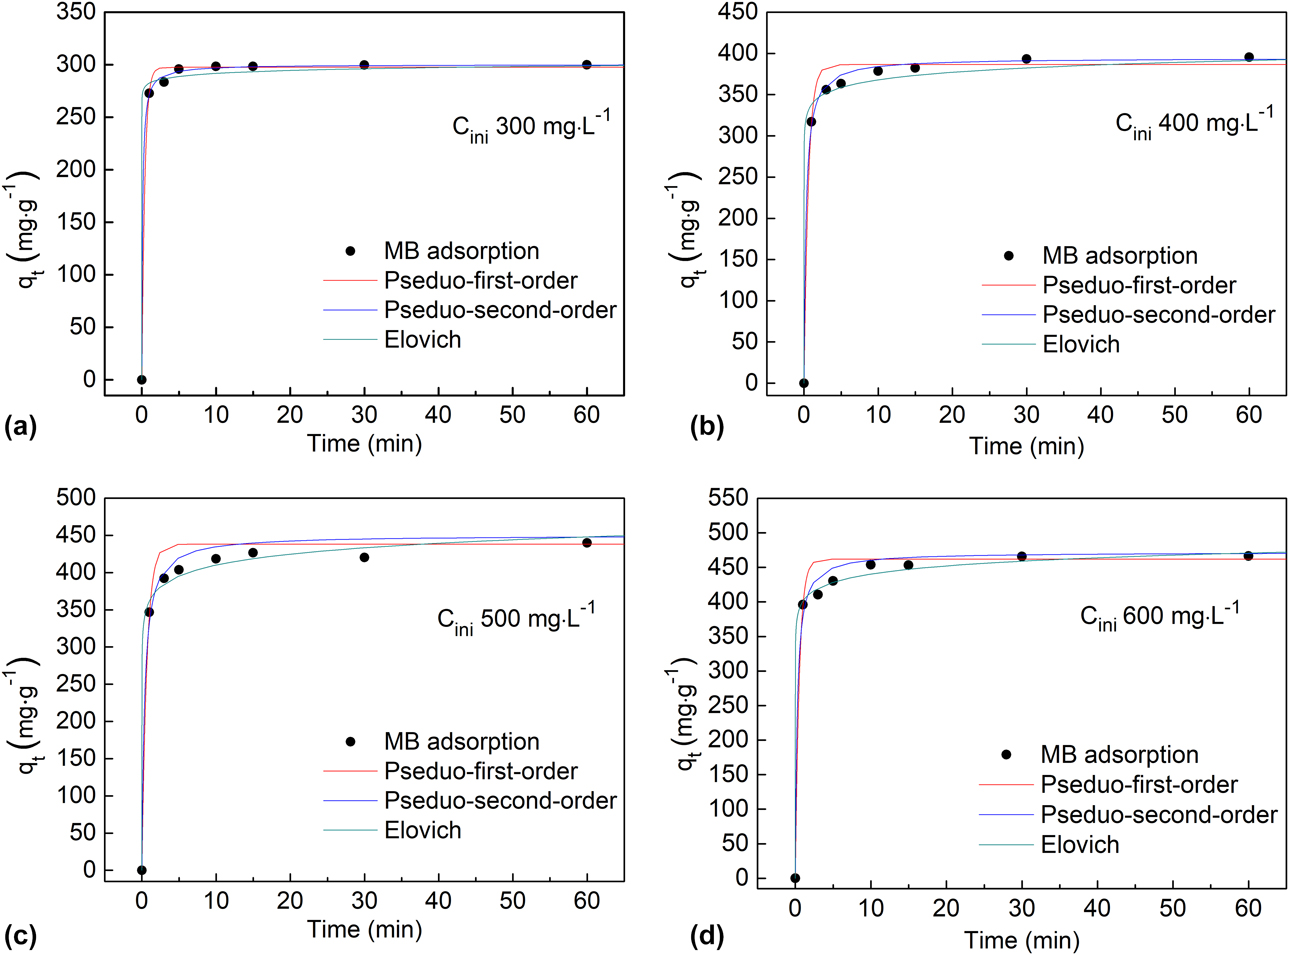
Kinetic studies can provide some information about the extreme step of the adsorption process and the different transition states that resulted in the adsorbent–adsorbate final complex formation. Figure 9 showed the nonlinear fitting of pseudo-I-order, pseudo-II-order and Elovich models with experimental data, and the kinetic parameters were shown in (Table SIII). When the initial concentration of MB solution was low (300 mg/L), the adsorption equilibrium was reached after 15 min; and as the initial concentration increased, the time to reach equilibrium was gradually increased [Figs. 9(a)–9(d)]. The data showed that all models had higher R 2 values and lower Δq e values, indicating that each model fitted well with the experimental data.
Non-linear fits of Pseudo-first-order, Pseudo-second-order and Elovich kinetic models to the MB adsorption at concentrations of 300 mg/L (a), 400 mg/L (b), 500 mg/L (c), 600 mg/L (d).
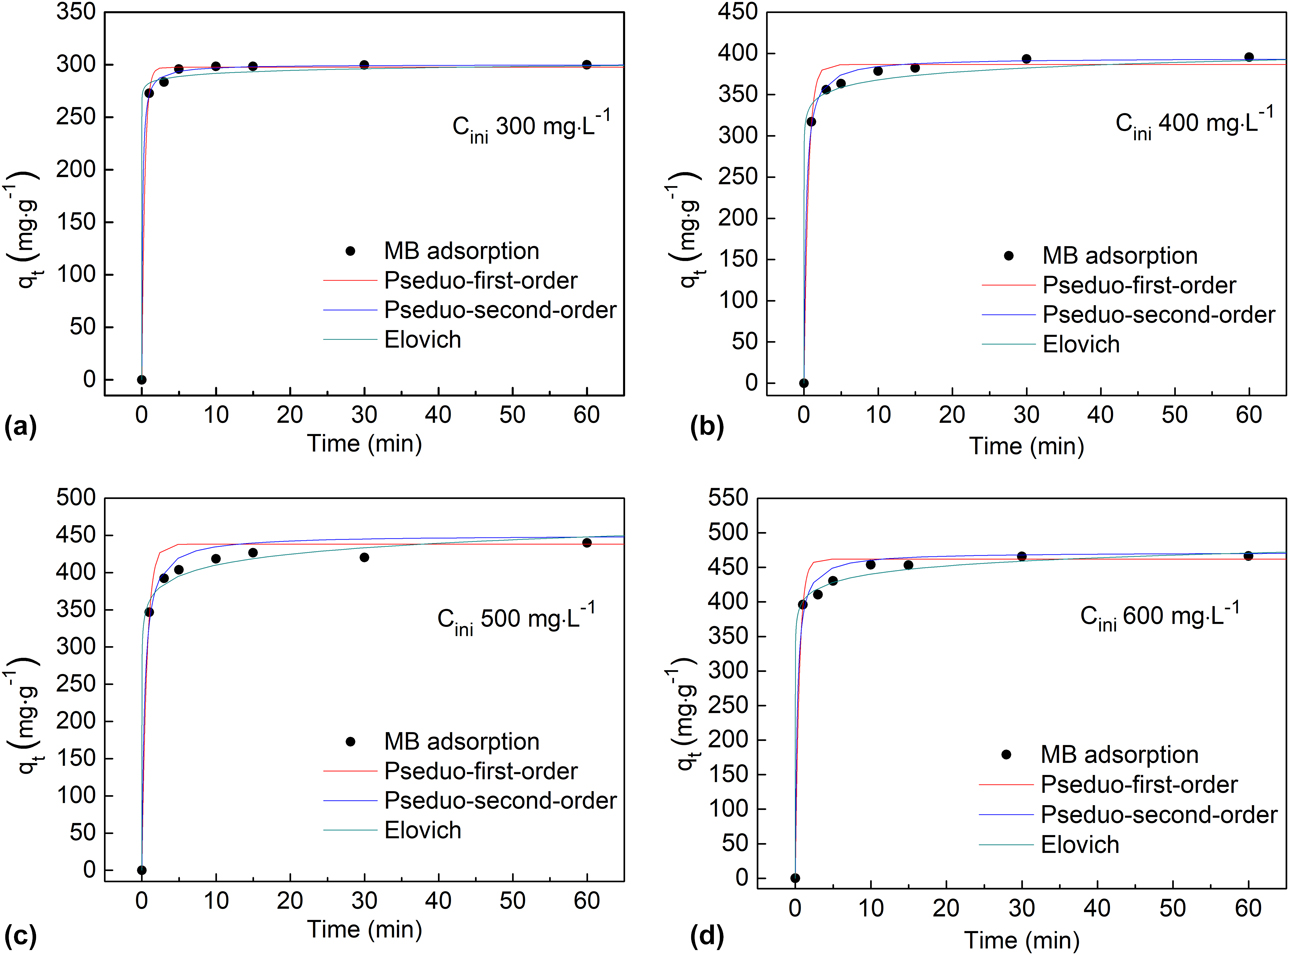
When the initial concentration of MB solution was 300 and 400 mg/L, the R 2 (0.9994 and 0.9975) values of the Pseudo-second-order model was the highest, so it fitted best with the experimental data, implying that the adsorption rate at this time was controlled by chemisorption, and the valence adsorption forces generated by the shared electrons between the MB molecule and AC molecule [Reference Foo and Hameed27]. When the initial MB concentration was 500 and 600 mg/L, the kinetics followed the Elovich model and occurred on the energetically heterogeneous surface of AC through chemical adsorption [Reference Aksakal and Ucun28]. Meanwhile, the α described the initial adsorption rate and β described the rate of desorption. The data in Table SIII showed that the concentration had a high value of α (2.79 × 10¹¹) compared to β (0.0587) [Reference Cukrowski29], indicating that the adsorption process was feasible and irreversible [Reference Vargas, Cazetta, Martins, Moraes, Garcia, Gauze, Costa and Almeida30].
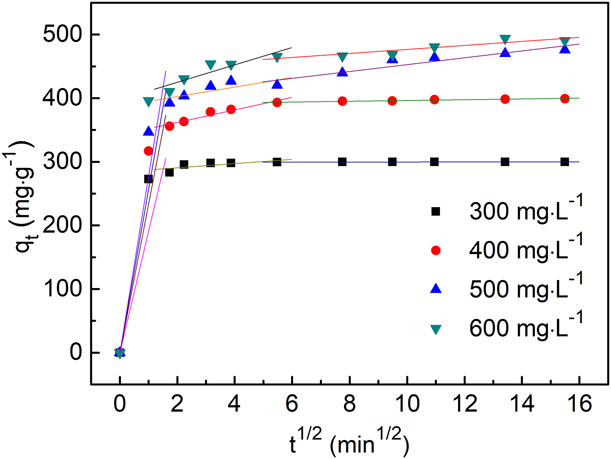
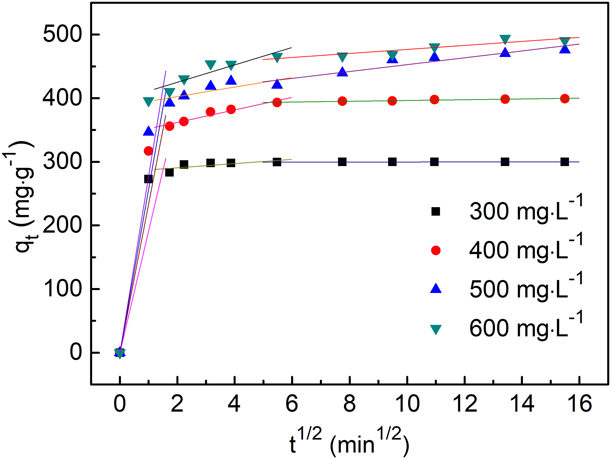
The rate and adsorption mechanisms were controlled by three successive steps, adsorbents were transported to the external surface of the adsorbent to form a diffusion film, adsorbents were transported to the internal surface of the adsorbent and the solute particles were adsorbed to the active sites on the solid surface.
As can be seen from Fig. 10, the adsorption process of each concentration was more than one stage, so the linear characteristics of the intraparticle diffusion model were not observed. Among them, the linear fit of the second and third stages is extremely deviated from the origin, indicating that the interparticle diffusion occurred at this stage but was not the main adsorption mechanism, and other factors affecting the adsorption process.
Linear fits of intraparticle diffusion for MB adsorption at concentration of 300, 400, 500, and 600 mg/L.
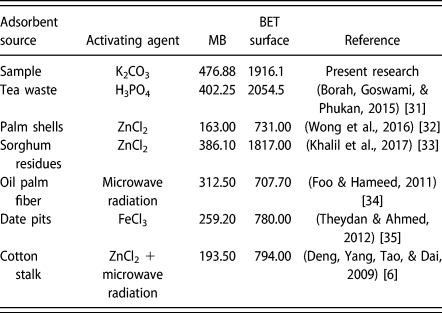
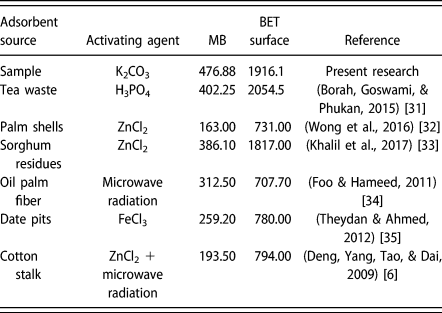
The comparison of the AC character such as yield and MB number with other sources of the adsorbent was shown in Table III. Using sawdust and PP with K2CO3 activation can produce the high-quality AC. Particularly, sawdust was an agro-waste produced in agricultural and forestry waste and was abundantly available. The PP in this study is a solid waste. Therefore, because of the low cost of the precursors, the prepared AC is a low-cost adsorbent.
Comparison for different AC sample.
Conclusion
The effect of plastic on the performance of AC and adsorption of MB on AC was studied in this article. The results showed that the performance of AC was greatly improved after adding 20% of PP. The results of the N2 adsorption–desorption isotherms showed that BET surface area and the total pore volume of AC prepared under the optimum conditions were 1916.1 m2/g and 1.12 cm3/g, respectively. The characterization results of AC showed that the AC prepared under the optimum conditions had high carbon content (79.78%) and alkaline surface functional groups and highly porous surface with cracks, channels and large holes. Besides, and the highest iodine number could reach 1460 mg/g. SEM images indicated that the sample has a rich pore structure. Additionally, the adsorption equilibrium data of MB onto AC were best fitted to the Redlich–Peterson model. The maximum adsorption capacity monolayer was of 476.88 mg/g, which showed that AC has high adsorption capacity. The kinetic data showed better fit to the pseudo-second-order model.
Materials and methods
Materials
SS was from a wood processing plant in Shandong Province, China. And PP was from Dongguan Chun Jin PP raw material Co., Ltd., in Guangdong Province, China. The activation reagent was K2CO3. And all chemicals were laboratory grade and purchased from Shanghai Sinopharm Chemical Reagent Co., Ltd., China.
The SS contains 9.40% moisture, 3.96% ash, 73.10% volatile matter and 13.54% fixed carbon. The components analysis showed that the SS was mainly made up of carbon (40.12%), oxygen (41.75%) and hydrogen (4.56%) (Table SIV). The mainly three components analysis of SS was shown in Table SV. The results revealed that the SS consisted mostly of cellulose (50.64%), hemicellulose (17.50%) and lignin (18.73%), as expected for much lignocellulosic materials which quite suit for AC preparation.
Preparation of AC
The process of preparing AC was as follows: (I) SS was dried at 105 °C to constant weight in a drying oven (DHG-9070AG, Shanghai Sanfa Science Instruments Co., Ltd., China), then grinded to a uniform size of 40 mesh; (II) grinding PP into 40 mesh of uniform size; (III) mixing the samples got in (I) and (II) with the activation reagent in a certain proportion, and pressing the mixture into columnar particles by using a tablet press, the particle density was controlled to 1.1 g/cm3; (IV) put the particles into a tubular furnace (GSL-1700X, Hefei Kejing Materials Technology Co., Ltd., China) for pyrolysis with purified nitrogen. The tube furnace had a heating rate of 10 °C/min and the nitrogen gas inlet rate of 600 cm3/min; (VI) washed the product obtained from the furnace with 1 M HCl solution, then rinsed repeatedly the product residue with deionized water until the solution was neutral; (VII) the final product was dried at 105 °C for 24 h and finally placed in a sealed bag.
The PP content ω was defined as the ratio of the weight of PP to the total weight of raw material.
 $$\omega = {{{M_{\rm{p}}}} \over {{M_{\rm{p}}} + {M_{\rm{w}}} + {M_{\rm{s}}}}} \times 100\% \quad ,$$
where ω is the PP content, M p is the mass of PP, M s is the mass of SS, and M w is the mass of K2CO3.
Characterization of samples
The SS was characterized by proximate and ultimate analysis, components analysis, FTIR and TG analysis. The AC was characterized by physical N2 adsorption/desorption at 77 K (Micromeritics Instrument Corporation, TriStar II 3020 3.02, Norcross, Georgia, USA). The specific surface area (S BET) was derived from N2 adsorption isotherms by means of the BET equation. The pore size distributions and medium pore diameter were determined using the density functional theory (DFT) [Reference Oliveira, Pereira, Guimaraes, Vallone, Pereira, Mesquita and Sapag36]. Scanning electron microscope (SEM, JSM-6490LV, JEOL, Japan) was used to scan the surface of AC to determine its performance. Fourier transform–infrared spectroscopy (FTIR; Nicolet 67, Thermo Nicolet Inc., Thermo Nicolet, USA) were used to analyze the surface groups.
Adsorption isotherm and kinetic models
A 1000 mg/L MB solution was prepared and diluted to the desired concentration before use. In the experiment, 200 mL of MB solution with a concentration of 100–800 mg/L was measured for adsorption experiments. 0.020 g of AC was weighed into an Erlenmeyer flask containing the MB solution, and then the Erlenmeyer flask was placed in a mechanical shaker at room temperature for a predetermined time and at a stirring speed of 200 rpm. After the experiment, membrane filter paper was used to filter the mixture. The absorbance at 665 nm was measured by a UV-Vis spectrophotometer to determine the remaining MB concentration. The maximum adsorption capacity q m (mg/g), the balanced adsorption capacity q e (mg/g), and the adsorbed capacity of MB at time t onto AC, q t (mg/g), were calculated by Eq. (5)
 $${q_{\rm{m}}} = {q_{\rm{e}}} = {q_t} = {{\left( {{C_{\rm{o}}} - {C_{{\rm{e,}}t}}} \right)V} \over W}\quad ,$$
where C o (mg/L) is the initial concentration of the solution; C e,t (mg/L) is the equilibrium concentration of the solution; V (L) is the volume of the solution; W (g) is the mass of the adsorbent.
The kinetic study of the adsorption process was mainly used to describe the rate of adsorption of solute by the adsorbent. The data were fitted by kinetic model to explore its adsorption mechanism. The shape of the adsorption isotherm reflected the interaction of the solid surface structure, pore structure and solid-adsorbed matter. By analyzing these isotherms, the adsorption interaction and the characterization of the solid surface can be known. In this article, four isotherm models (Freundlich, Langmuir, Redlich–Peterson and Dubinin–Radushkevich) and three kinetic models (pseudo-I-order, pseudo-II-order and Elovich) were investigated. All kinetics and isotherm models used the nonlinear equation of fitting to the experimental data (Table SVI). Using Origin 8.0 software, Northampton, Massachusetts, USA performed nonlinear regression analysis, and the nonlinear model was considered as the best choice for estimating kinetic and isotherm parameters, because of the inherent deviation, different estimation errors and fitting distortions, which might be caused by linearization [Reference Khan and Khan37]. To find a suitable model and compare to describe the model applicability on reflecting the AC adsorption of MB, the determination coefficient (R 2) and the normalized standard deviations Δq e (%) were evaluated, which were calculated through the relation shown in Eq. (6).
 $$\Delta {q_{\rm{e}}}\left( \% \right) = 100\sqrt {\sum {{{{{\left[ {{{\left( {{q_{{\rm{e,exp}}}} - {q_{{\rm{e,cal}}}}} \right)} / {{q_{{\rm{e,exp}}}}}}} \right]}^2}} \over {n - 1}}} } \quad ,$$
where n is the number of data points, q e,exp is experimental equilibrium adsorption capacity values, and q e,cal is the calculated equilibrium adsorption capacity values.
Supplementary material
To view supplementary material for this article, please visit https://doi.org/10.1557/jmr.2019.193.
Acknowledgments
The authors gratefully acknowledge the Hefei City’s independent innovation policy to transfer research and development projects (J2018G15).