Introduction
Sugar beet is considered a major crop for sugar production over the world. Morocco imports 100% of seeds needed for sugar beet cropping and also imports large amounts of sugar annually. Cropping sugar beet in the tropical and subtropical regions is a significant goal (Abou-Elwafa et al., Reference Abou-Elwafa, Abdel-Rahim, Abou-Salama and Teama2006, Reference Abou-Elwafa, Abdel-Rahim, Abou-Salama and Teama2013; Balakrishnan and Selvakumar, Reference Balakrishnan and Selvakumar2009). Germplasm enhancement and the establishment of adapted varieties to the Moroccan environments primarily require the identification of vernalization area, and the evaluation of the seed production potential.
Sugar beet is a biennial crop that has intraspecific variations in its vernalization requirement (Letschert et al., Reference Letschert, Lange, Frese and van den Berg1994). During the juvenile stage before vernalization, the metabolism of sugar beet is directed towards sucrose accumulation in the taproot (Oltmanns et al., Reference Oltmanns, Kloos, Briess, Pflugmacher, Stahl and Hehl2006). For seed production, an overwintering period of cold between 4 and 7 °C (vernalization) is required for the root bolting at the second growing season and for the initiation of the reproductive stage (Smith, Reference Smith and Fehr1987; Letschert, Reference Letschert1993). Selection among half-sib families (HSFs) is the adopted method in sugar beet germplasm enhancement. After each progeny test evaluation, the best families are intercrossed to establish a new improved population (Bosemark, Reference Bosemark, Cooke and Scott1993).
With the family selection approach, loss of vigour is imminent because of the inbreeding effect (McFarlane, Reference McFarlane and Johnson1971; Panella, Reference Panella and Frese1998). Open pollination between different performing individuals belonging to different HSFs is of great interest to the breeding programmes. Selection among HSFs is an important and efficient method since there are more genotypic variability and higher germplasm enhancement involved. This approach is based on oriented selection at the individual genotype level. The open-pollinated population resulted from the pollen flow between performing individuals influence positively the potential of the offspring population. Selection among the HSFs provides a source of potential parents that lead to improved populations.
Effective control of bolting and flowering is essential for both the cultivation and breeding of sugar beet crops (Mutasa-Göttgens et al., Reference Mutasa-Göttgens, Qi, Zhang, Schulze Buxloh, Jennings, Hohmann, Muller and Hedden2010). Synchronization of flowering induction of improved population serves to maximize the yield. For reproduction, Beta vulgaris is an obligate outbreeding crop with a complex self-incompatibility system (Maletsky and Weisman, Reference Maletsky and Weisman1978); its pollen is easily transported by wind, and to some extent by insects too (Down and Lavis, Reference Down and Lavis1930; Archimowitsch, Reference Archimowitsch1949; Free et al., Reference Free, Williams, Longden and Jonhson1975).
In comparison with other crop species, sugar beet seed quality is a crucial factor that influences significantly cropping and economic achievement. The genotype and the growing environment have a significant effect on seed stalk expansion as well as on yield and seed quality (Jagosz, Reference Jagosz2015).
To contribute to the sugar beet cropping extension and to the sugar national self-sufficiency, INRA-Morocco initiates a breeding programme to enhance its germplasm in the local environment. The maternal pedigree selection method has been adopted; it is based initially on developing enhanced germplasm adapted to the local conditions for the plant vernalization and seeds' production, followed by a progeny test for root and sugar yield traits.
Hence, this study aims to evaluate the progress of seed production and plant cycle duration for 18 selected sugar beet HSFs under local environmental conditions for three cropping cycles.
Materials and methods
Plant material
The sugar beet plant material used in this study was developed by breeders and developers of the USDA-ARS programmes. It is a diversified sugar beet germplasm developed through crosses between five accessions (PI 651015, PI 651016, PI 658059, PI 658061 and PI 658062), and used to test its adaptation, seed production potential in the Moroccan environment and to enhance its variability. The 18 studied families were selected among the segregating progenies. The main selection traits were seed production and root and sugar yield, self-sterility, germy level, hypocotyl colour and resistance to rhizomania strains.
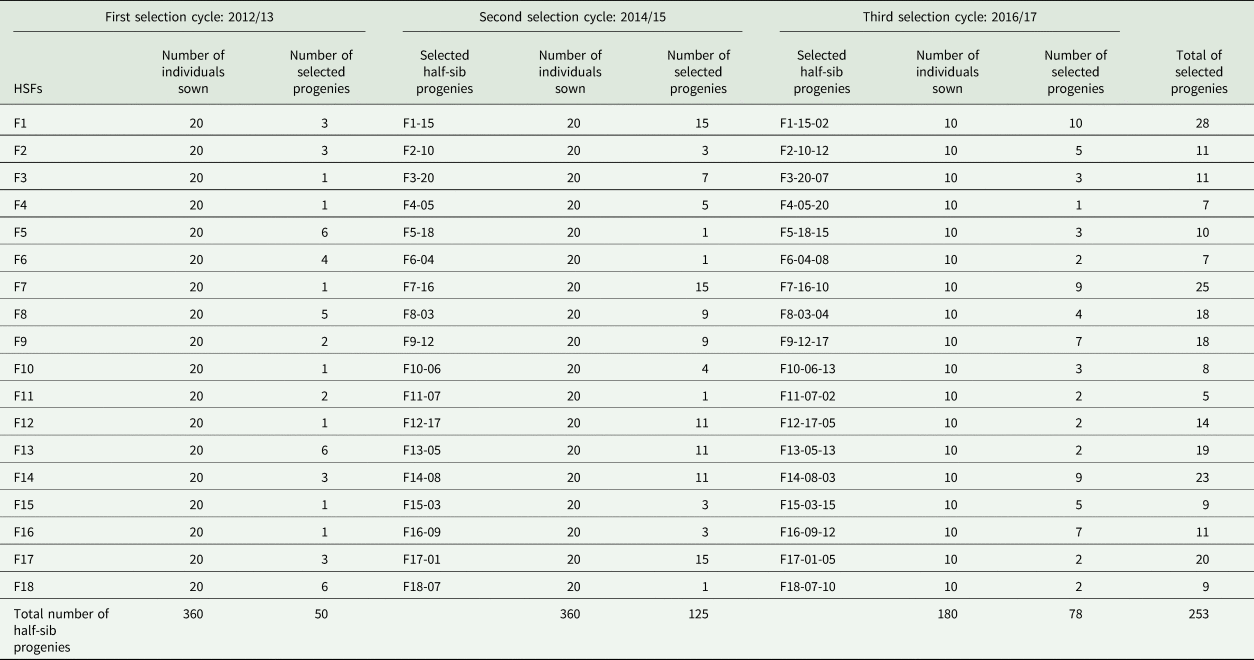
The respective progenies of eighteen sugar beet HSFs were evaluated for three selection cycles (C1, C2 and C3) in 2012/13, 2014/15 and 2016/17 campaigns (Table 1). For each selection cycle, 10–20 seeds per HSF were planted to evaluate the traits' progress. After each selection cycle, the seeds of the performing plants have constituted the half-sib progenies for the next cycle. The half-sib progenies were replicated in the field by open pollination between the selected individuals belonging to 18 HSFs and planted randomly in the experimental plot. Sugar beet is an allogamous species; therefore, the parents breeding values are key factors for the population breeding improvement. Valuable individuals for the intended selection criteria constitute potential parents for the next selection cycle.
Studied HSFs during three selection cycles for seed production evaluation

Fx-i, Fx-i-j, the same letters in family codes signify that it belongs to the same maternal plant.
The number of selected progenies per HSF was based on the selection criterion, as the vernalization induction, bolting behaviour, cycle length, diseases resistance and yield components. Considering that for roots production, plants have an adequate sugar and root yield spending a period of about 180–230 days in the field. The bolting before this period is undesirable; it negatively influences the productivity because the plant uses sugar root reserves for the reproductive stage. Therefore, every selection cycle starts with a pre-selection by removing early bolting individuals (before 220 days). Low vigour plants discard naturally since they don't achieve their reproduction stage. After the remained plants harvest, the quality of the seed and the frontward behaviour of half-sib progenies help to select individuals for the next selection cycle. Selected individuals must meet all the main selection criteria (Table 2).
Average of the principal selection criteria of the half-sib progenies after a cycle of selection

The frequency of the selected individuals after each trial is variable depending on the HSF and the selection cycle. This variability depends mainly on the response to vernalization and the elimination of plants that showed an early bolting tendency. The frequency of selected individuals is increased through the selection cycles with a value of 13.9% for the first selection cycle, 34.7% for the second selection cycle and 43.3% for the third selection cycle.
Site of trials
The seed production trials were conducted at INRA-Morocco Merchouch experimental station at 40 km south-east of Rabat. The site is at a latitude of 33°60′41N, a longitude of 6°71′60W and a 339 m elevation. Average minimum and maximum temperatures are, respectively, 4.3 and 32.9 °C and annual rainfall is 449 mm. Merchouch climate conditions were quite appropriate to induce plant bolting and seed production of the half-sib sugar beet tested families. Vernalization refers to the plant's requirement of low temperatures before the rosette stage for the induction of flowering (Salimi and Boelt, Reference Salimi and Boelt2019). The 0–15 °C range and 5–20 week period of low temperature, have an important role in the extent of vernalization (Durrant et al., Reference Durrant, Mash and Jaggard1993; Sadeghian and Johansson, Reference Sadeghian and Johansson1993; Abou-Elwafa et al., Reference Abou-Elwafa, Abdel-Rahim, Abou-Salama and Teama2006; Kockelmann et al., Reference Kockelmann, Tilcher and Fischer2010; Mutasa-Göttgens et al., Reference Mutasa-Göttgens, Qi, Zhang, Schulze Buxloh, Jennings, Hohmann, Muller and Hedden2010).
Methods and techniques
Seed germination was carried out in alveolar plates of 25 cm3. Indirect sowing allows selection for plant vigour before transplantation in the soil. The sowing was carried out 2 months later, in September, the transplantation in November of the same year. Genotypes were planted according to a polycross open-pollinated design with 1 m spacing between plants. Irrigation was provided on a regular basis as needed to avoid water stress. At maturity, genotypes were harvested separately.
Measurements and data collection
Evaluated parameters gathered around the phenological stages (expressed in day), such as the number of days to bolting (NdB), number of days to flowering (NdF), flowering period duration (DF), number of days to maturity (NdM) and maturity duration (DM). Yield components that were measured in grams, were grain yield per plant (GY), and one thousand glomeruli weight (TKW). The multigermy ratio (RMg), which is related to the type of glomerulus, was classified according to three categories; class 1 has more bigerm glomerulus, class 2 has mainly trigerm glomerulus and class 3 presents glomerulus with more than three seeds. The germination rate (Gr) was evaluated to test the quality of seeds harvested on the HSFs. The Gr was presented as a value between 0 and 1 or as a percentage (0–100%). The germination test was performed on pleated paper according to the International Rules for Seed Testing (ISTA) standards method.
Air humidity and temperature are determinant factors on seed germination. Sugar beet seeds germinate rapidly when the soil moisture in the seedbed is at 20–23%, and air and soil temperature range between 15 and 25 °C (Sroller and Svachula, Reference Sroller, Svachula, Baier, Bures and Coufal1990; Copeland and McDonald, Reference Copeland and McDonald2001; Spaar et al., Reference Spaar, Dreger and Zacharenko2004). To ensure the basic conditions for germination, the use of yet pleated bolting paper is an effective method to evaluate seed germination capacity (Fig. S1, Supplementary material). Each HSF test concerns two repetitions of 50 seeds. The paper folds carrying the seeds are placed in a plastic bag and incubated at 20 °C. After 3 days, the germinating rate evaluation took place. The young emerging plants are then transferred in alveolar plates for subsequent field tests.
Statistical analysis
The data were analysed using statistical software R version 3.5.1 and STATISTICA 6Fr. The different statistical analysis methods are used to estimate the generation, HSF and individual effects on quantitative traits. The seed production potential evaluation was performed at the three selection cycles using two models for the analysis of variance (ANOVA). The HSF and the selection cycle are considered as classifying, explanatory and predictor variables. The decomposition and one-way ANOVA approach was especially adopted to provide an exploration of HSFs' behaviour through selection cycles. The decomposition (factorization) consists of original data matrix rearrangement to generate categorical variables (factors). In our case, the categorical variable is the possible individual values assigned to groups according to classifying variables (HSF and selection cycle). The second test was the main effects ANOVA, executed to evaluate the overall effect of each independent variable on quantitative parameters. These two analysis applications are defined options to explain the variability behaviour of the studied traits at three levels: HSF, generation and their combination (HSF/generation). In the same context, the multiple linear regression analysis was conducted using a linear combination of explanatory variables. The Tukey's HSD (honestly significant difference) test was performed for post-hoc multiple comparisons (Tukey, Reference Tukey and Braun1953). The Tukey's HSD is the most used pairwise test for controlling the per comparison error rate.
To analyse the variability and to classify improved germplasm, the multivariable analysis was used to describe the selected population structure and its seed production potential at the third cycle of selection. Principal component analysis (PCA) and ascendant hierarchical clustering were performed using the nine studied parameters, that are the number of days to bolting (NdB), the number of days to flowering (NdF), the flowering period duration (DF), the number of days to maturity (NdM), the maturity duration (DM), the plant grain yield (GY), one thousand glomeruli weight (TKW), the multigermy ratio (RMg) and the germination percentage (Gr).
Each dimension of the multivariate analysis can be described by the quantitative and/or categorical variables that participate in the construction of the factorial axes (Lê et al., Reference Lê, Josse and Husson2008).
For the hierarchical clustering, we used Ward's method that is based on Huygens theorem that allows splitting the total variance between and within-groups. This method allows to aggregate two clusters to minimize the growth within-inertia, in other words, to reduce the between-groups inertia at each step of the algorithm (Ward, Reference Ward1963; Husson et al., Reference Husson, Josse and Pagès2010).
Results
Seed production potential through selection cycles
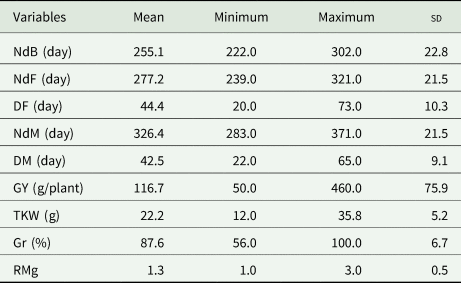
The first part of the results comprises a general analysis of seed production potential through selection cycles. Statistical description analysis of the grain yield displayed fluctuation values between 50 and 460 g. The thousand glomeruli weight ranged between a minimum of 12 g, a maximum of 35.8 g and a mean of 22.2 g. The germination rate reached 87.6% with a minimum and a maximum of 56 and 100%, respectively (Table 3).
Mean, minimum, maximum and sd for the studied parameters

NdB, number of days to bolting; NdF, number of days to flowering; DF, flowering period duration; NdM, number of days to maturity; DM, maturity duration; GY, grain yield per plant; TKW, one thousand glomeruli weight; Gr, germination rate; RMg, the multigermy ratio.
The comparative analysis according to the HSF and selection cycle were performed using the following parameters: the number of days to bolting (NdB), the number of days to flowering (NdF), the flowering period duration (DF), the number of days to maturity (NdM), the maturity duration (DM), one thousand glomeruli weight (TKW) and the germination percentage (Gr).
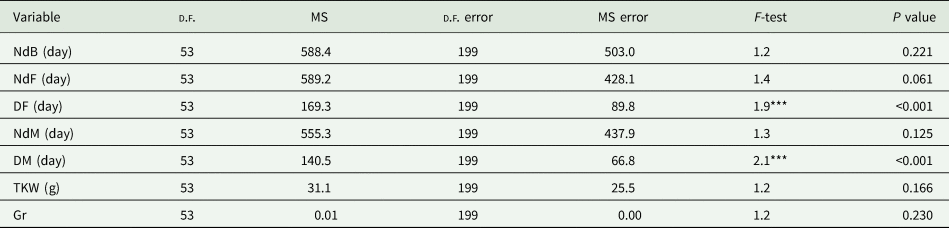
The decomposition and the one-way ANOVA reveal differences in the behaviour of the variables (Table 4). The results showed significant variability for the flowering duration (P < 0.001) and maturity duration (P < 0.001). The traits' means and standard deviations (sd) of three selection cycles (C1, C2 and C3) are provided in the Supplementary material (Table S1).
One-way ANOVA to evaluate the categorical variable (HSF/selection cycle) effect on quantitative traits

NdB, number of days to bolting; NdF, number of days to flowering; DF, flowering period duration; NdM, number of days to maturity; DM, maturity duration; TKW, one thousand glomeruli weight; Gr, germination rate; D.F., degree of Freedom; MS, mean square.
P levels (*P < 0.05, **P < 0.01, ***P < 0.001).
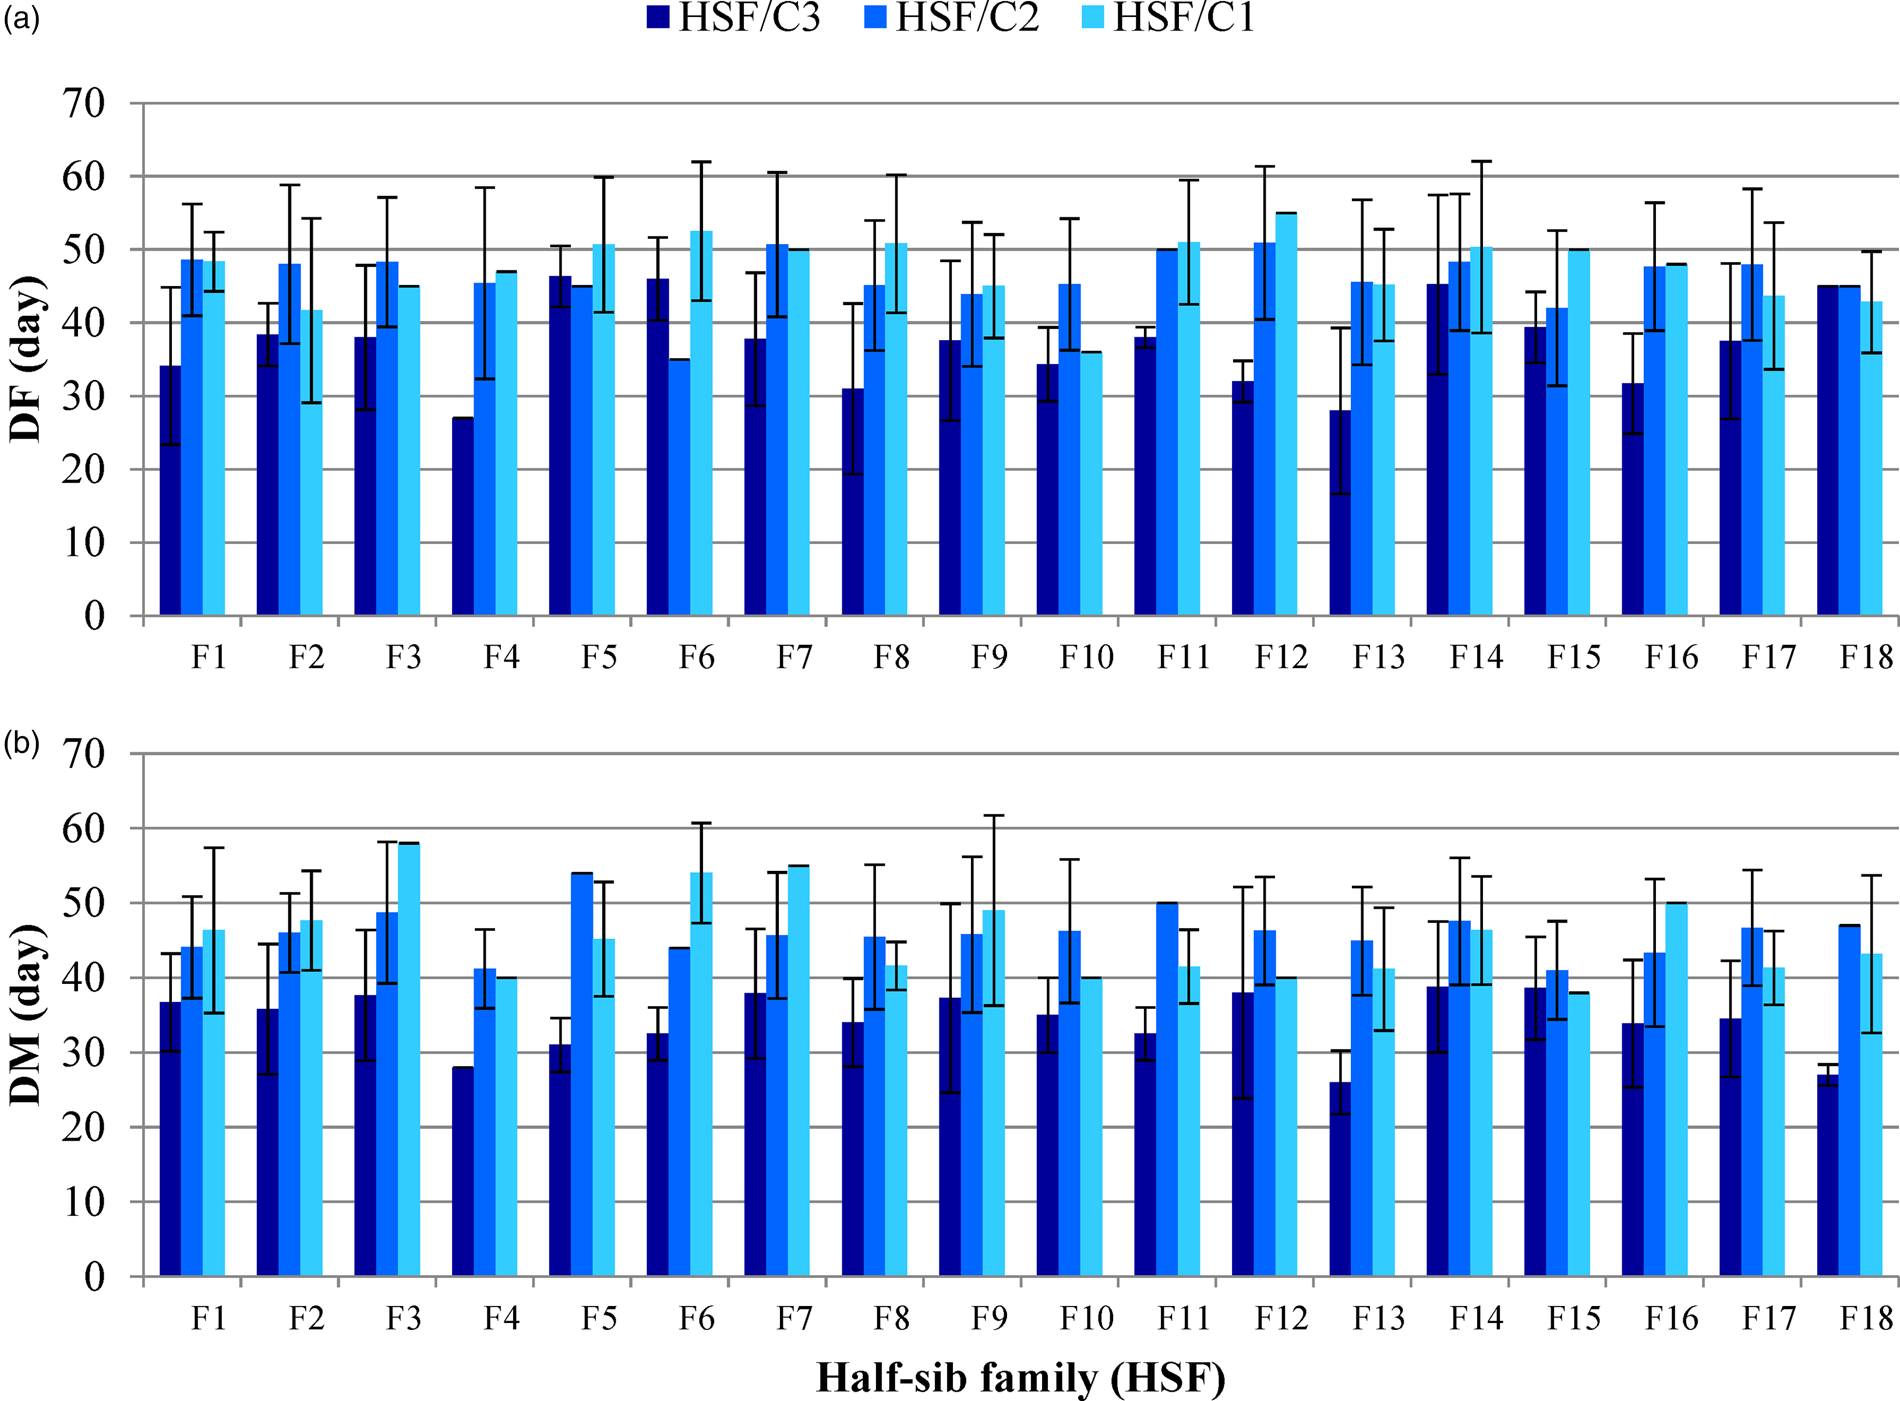
The comparison graph shows major differences for the flowering duration; the HSFs' averages were between 27 and 55 days for F4 and F12, observed during C3 and C1, respectively (Fig. 1(a)). The maturity duration also showed large variability between HSFs at the three generations (Fig. 1(b)). The shorter DM was 26 days recorded by F13 in C3, and the longest DM was 58 days registered by F3 in C1.
(Colour online) Means (±sd) of the 18 HSFs' flowering period duration (DF) (a) and maturity duration (DM) (b) during the three selection cycles, C1, C2 and C3.

The graphs' illustrations of the number of days to bolting (NdB), the number of days to flowering (NdF), the number of days to maturity (NdM), one thousand glomeruli weight (TKW) and the germination rate (Gr) are provided in the Supplementary material (Figs S2(a), S2(b), S2(c), S3(a) and S3(b)).
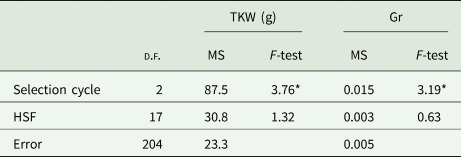
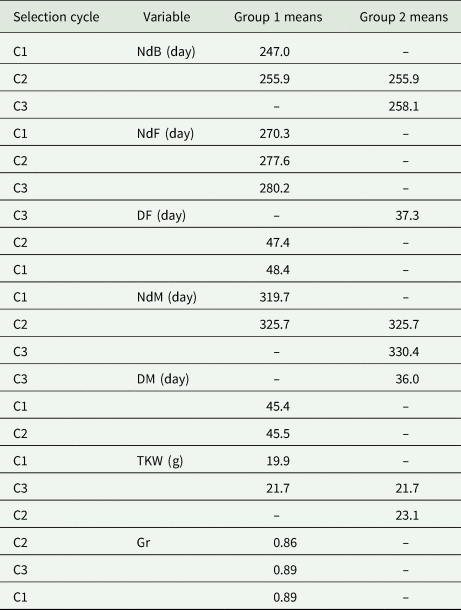
The main effects variance analysis revealed significant differences between generations for the studied traits (Tables 5 and 6). The selection cycle has a very high significant effect on the flowering duration and a significant effect on the other phenological traits, such as the durations to bolting, to flowering and to maturity, and the maturity duration (Table 5). One thousand glomerulus weight and germination rate were also significantly influenced by the selection cycle (Table 6). In this ANOVA model, the HSFs' main effect on the dependent variable represents the average influence of this independent variable; consequently, the ANOVA did not reveal any differences between the HSFs. This analysis aims to evaluate the population improvement progress through the selection cycle's overall effect on the studied traits. The differences between generations can be revealed by the multiple comparison procedures. In this context, the Tukey's HSD test was conducted to explore these differences (Table 7). After three selection cycles, plant cycle duration increased by 10.7 days. The analysed data present a strong confirmation of the seed production progress (Table 7).
Analyses of variance for phenological parameters

NdB, number of days to bolting; NdF, number of days to flowering; DF, flowering period duration; NdM, number of days to maturity; DM, maturity duration; D.F., degree of Freedom; MS, mean square.
P levels (*P < 0.05, **P < 0.01, ***P < 0.001).
Analyses of variance of the seed quality parameters

TKW, one thousand glomeruli weight; Gr, germination rate; D.F., degree of Freedom; MS, mean square.
P levels (*P < 0.05, **P < 0.01, ***P < 0.001).
Group of means revealed by the Tukey's HSD test for the studied parameters according to three selection cycles

HSD, honestly significant difference; C1, first selection cycle; C2, second selection cycle; C3, third selection cycle; NdB, number of days to bolting; NdF, number of days to flowering; DF, flowering period duration; NdM, number of days to maturity; DM, maturity duration; TKW, one thousand glomeruli weight; Gr germination rate.
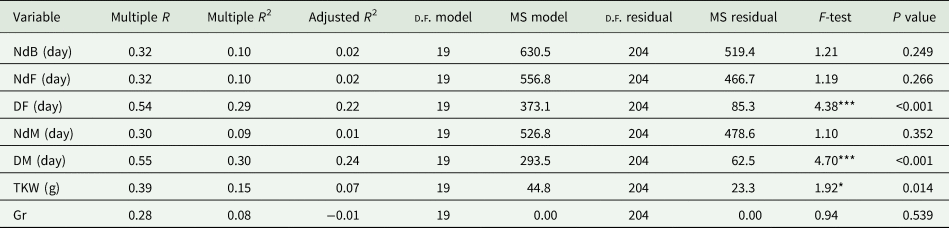
To explain differently the variance of the studied traits, the multiple linear regression analyses (Table 8) was performed using a linear combination of predictor variables (HSF and selection cycle). The coefficient of determination, R 2, predicts the percentage of variance in the dependent variables from the predictors. Significant values resulted from the following parameters, flowering duration (DF, R 2 = 0.29), maturity duration (DM, R 2 = 0.30) and one thousand glomerulus weight (TKW, R 2 = 0.15). This analysis supports the results obtained by the decomposition and one-way ANOVA approach. The HSFs behaved differently between the generations for the traits with significant variability. The non-significant effect of the combination between the selection cycle and HSF on the phenology traits (numbers of days to bolting, flowering and maturity) is mainly the result of the initial pre-selection (elimination of plants with relative early bolting). On the contrary, the general means (the population means) revealed significant differences; two groups of means for NdB and NdF (Tukey's test, Table 7) and recorded progress along with the advancement of generation.
Multiple linear regressions model for dependent variables and predictors (HSF and selection cycle)

NdB, number of days to bolting; NdF, number of days to flowering; DF, flowering period duration; NdM, number of days to maturity; DM, maturity duration; TKW, one thousand glomeruli weight; Gr, germination rate; R, coefficient of determination; D.F., degree of Freedom; MS, mean square.
P levels (*P < 0.05, **P < 0.01, ***P < 0.001).
Variability and classification of the improved germplasm
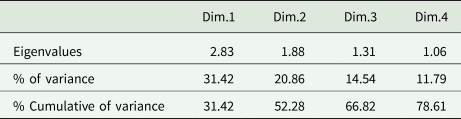
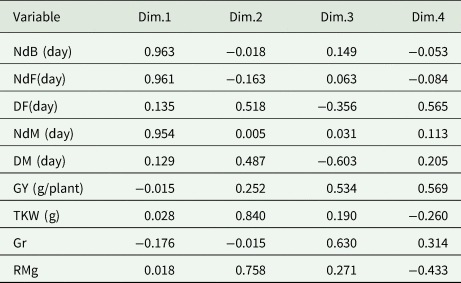
PCA was performed on the 78 selected progenies in the third selection cycle using the studied variables. The first principal component explained 31.4% of the total variation, and the second factor an additional 20.9%, a total for both of 52.3% (Table 9).
Eigen values of principal components (PC: Dim.1, Dim.2, Dim.3 and Dim.4)

Dim., dimension.
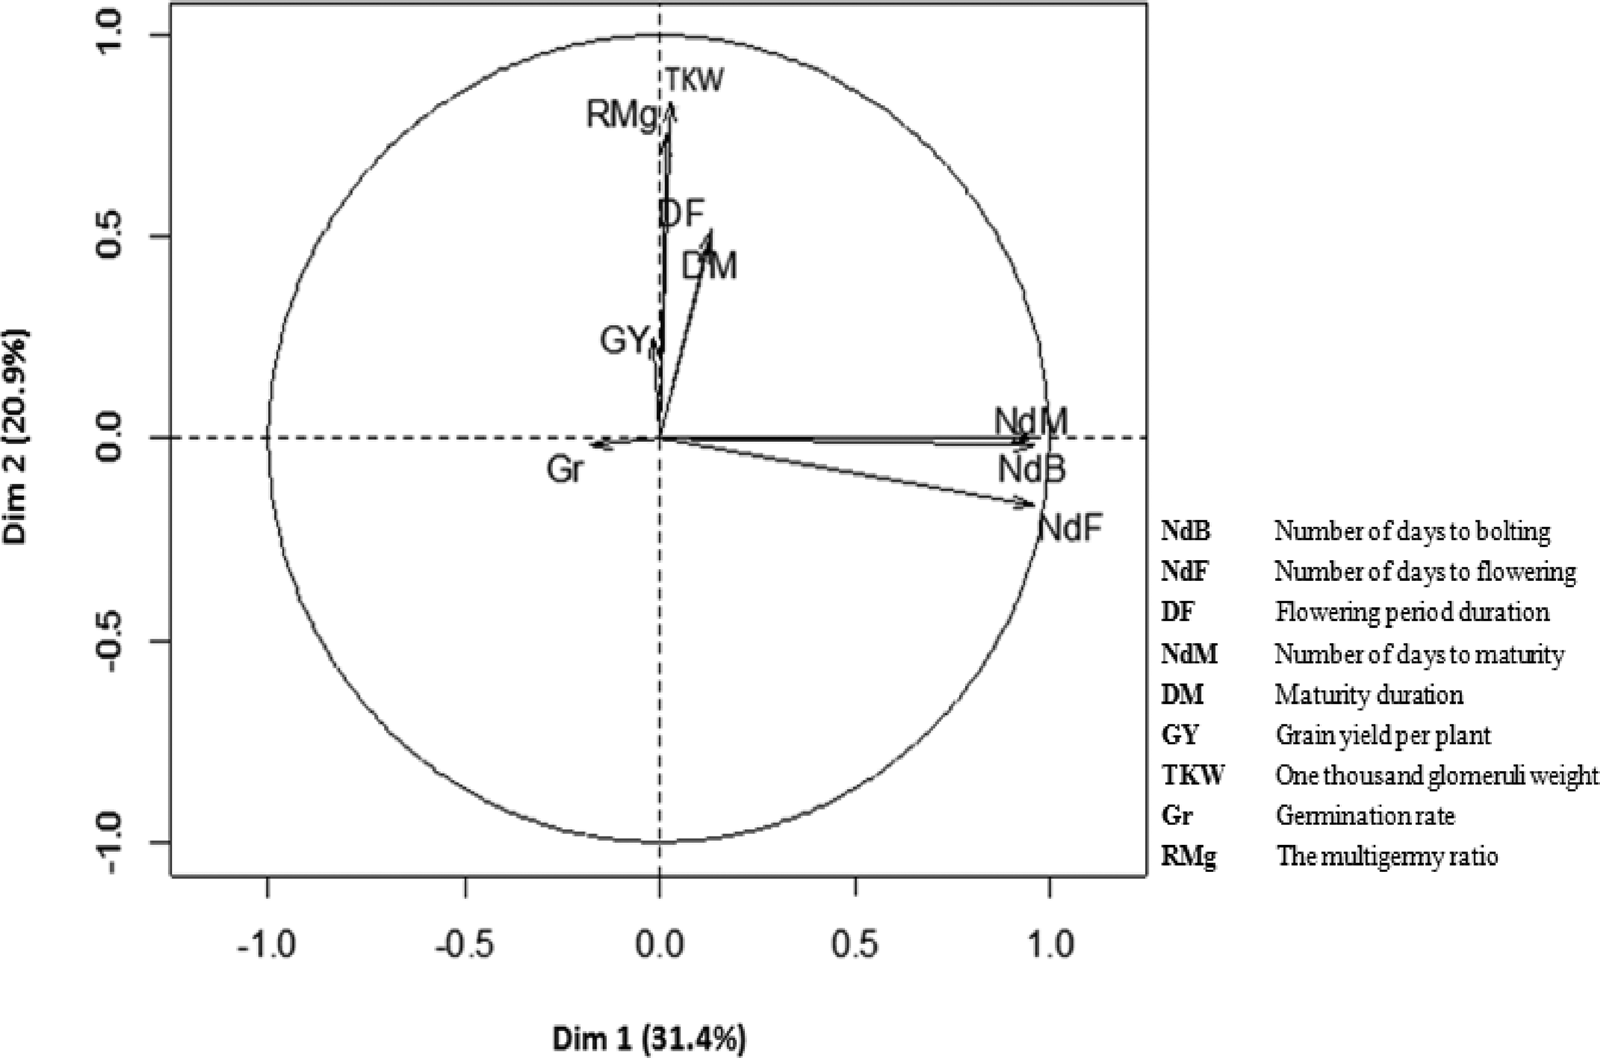
The phenological parameters were significantly correlated with the first PCA axis (Fig. 2); the second axis is moderately correlated with both flowering and maturity durations. Thousand-glomerulus weight and multigermy ratio were slightly correlated with PC2. The following phenological traits: numbers of days to bolting, to flowering, and to maturity, present significant correlations, as is the correlation between thousand glomeruli weight and multigermy ratio. Flowering and maturity durations are closely correlated. The first axis explains the cycle duration of the studied families; PC2 defines the seed quality and the duration of the phenological stages. Grain yield is positively correlated with the third and fourth principal components (Table 10). Both last components were considered in the ascending hierarchical classification to structure the selected half-sib progenies.
Projection of the variables on the factor plane (Dim.1; Dim.2) for the PCA of seed production potential of the selected 18 HSFs during the third selection cycle.

Coordinates of the variables on the first five principal components of the PCA

NdB, number of days to bolting; NdF, number of days to flowering; DF, flowering period duration; NdM, number of days to maturity; DM, maturity duration; GY, grain yield per plant; TKW, one thousand glomeruli weight; Gr, germination rate; RMg, the multigermy ratio; Dim., dimension.
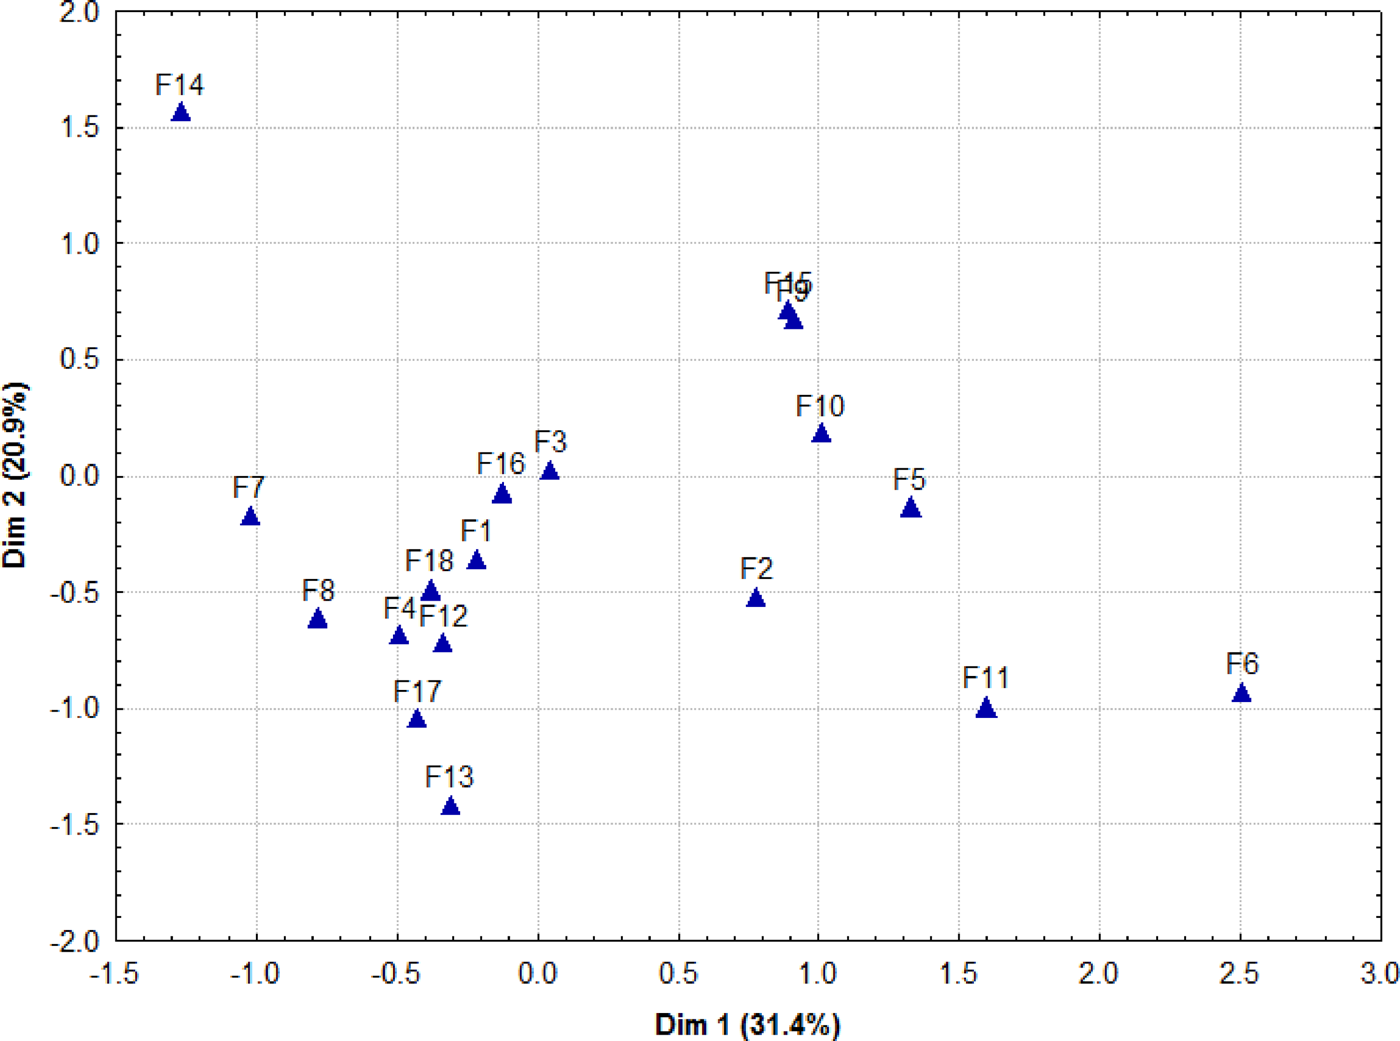
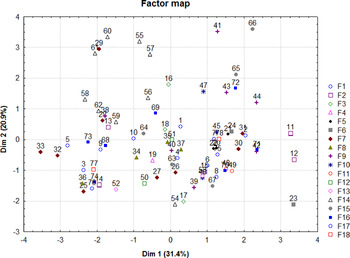
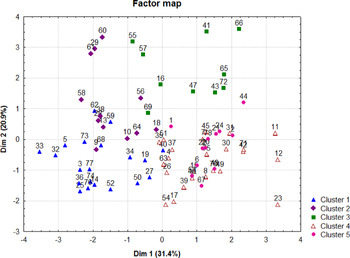
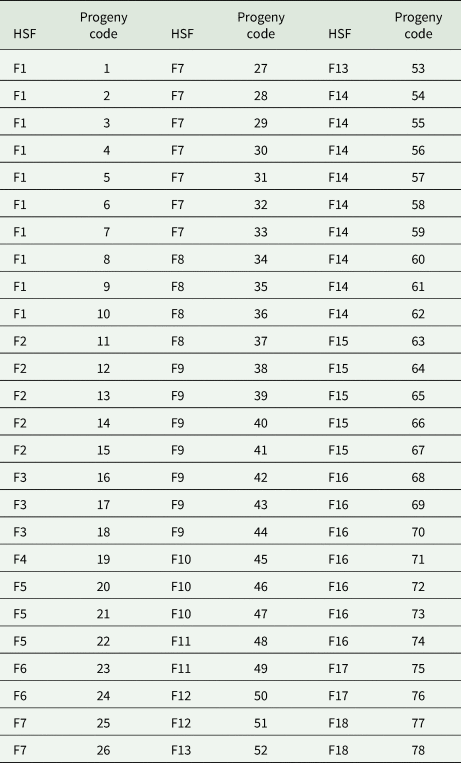
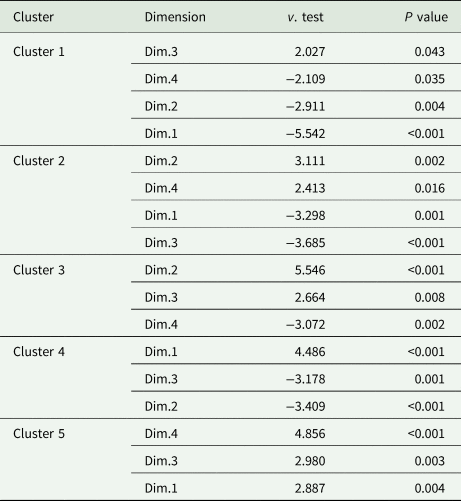
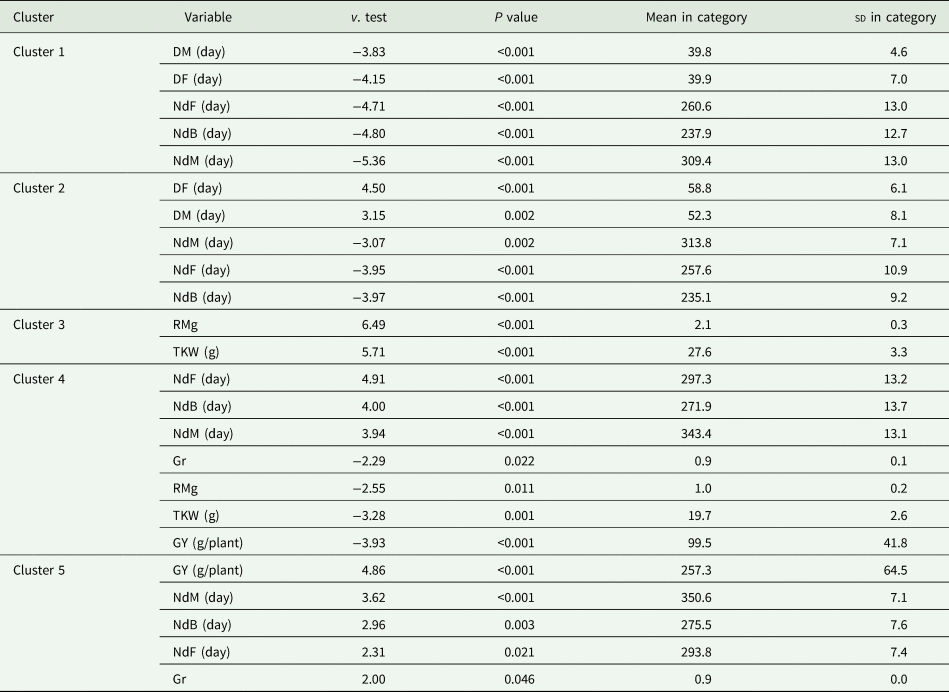
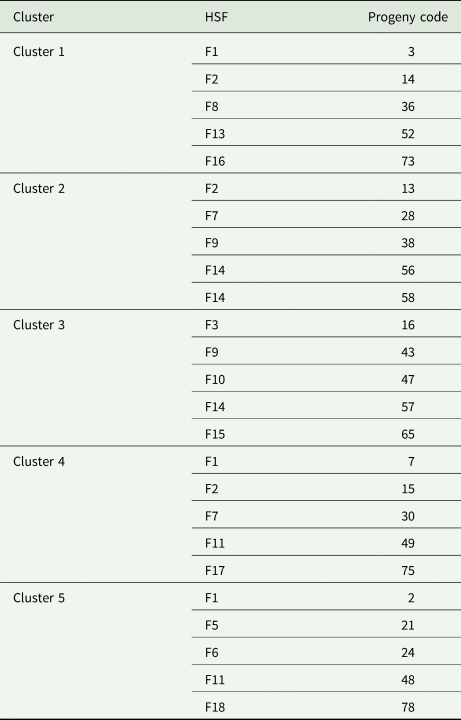
The half-sib progenies selected in the third cycle (Table 11) are illustrated on the PC1–PC2 graph for the HSFs (Fig. 3) and for individual plants (Fig. 4). High variation is found between families. According to this analysis, F2, F5, F6, F9, F10, F11 and F15 families have long-cycle ranging from 343.4 to 350.6 days to maturity. The F7 half-sib progenies were relatively short-cycle registering a mean of 315.2 days. During the third selection cycle, we carried out an ascending hierarchical classification analysis. The main axes revealed by the PCA were used to achieve an ascending hierarchical classification; clusters represented on the first two principal components map (Fig. 5) are described by the principal components (Table 12). Groups' description, based on the quantitative traits, was conducted according to the specific coordinates of the principal components. Links between the cluster's variables and the quantitative variables were explored (Table 13). The results are presented as follows: the average of the cluster variable (the category mean), the average of the whole variable data set (overall mean), the associated sds and the P value corresponding to the following hypothesis test: ‘Categories mean is equal to the overall mean’. The v-test was used to analyse the significance of the difference between the cluster and overall means. Large variability is found between genotypes within clusters. Cluster 1 represents short-cycle individuals and gathers the F1, F7, F8, F13, and F16 half-sib progenies that mature after only 309.4 days on average. Cluster 2 associates F14 half-sib progenies that are short-cycle and have long flowering and maturity durations; their numbers of days to maturity mean 313.8, flowering duration mean is 58.8 and maturity duration is 52.3 days. Cluster 3 groups the F9, F10 and F15 progenies that are long-cycle and have high multigerm glomerulus and thousand glomeruli weight ratio; its multigermy category mean is 2.1 and TGW 27.6 g. Cluster 4 associates F6 and F11 half-sib progenies that are long-cycle and of bigerm glomeruli type; their number of days to maturity is 343.4, multigermy ratio of 1.04, TGW of 19.7 g and grain yield per plant of 99.5 g. Cluster 5 groups the F2, F5 and F10 half-sib progenies that are long-cycle (350.6 days), and have high grain yield per plant (257.3 g) and germination rate (93%). A large seed production potential variability has been founded between half-sib progenies and even between individuals (Table 14).
(Colour online) Projection of the selected 18 HSFs during the third selection cycle on the factor plane (Dim.1; Dim.2) for the PCA of seed production parameters.

(Colour online) Projection of the selected 78 progenies of 18 HSFs in the third selection cycle on the factor plane (Dim.1; Dim.2) for the PCA of seed production parameters.

(Colour online) Factor map, representation of the clusters on the map induced by the first two principal components for the selected 78 progenies of 18 HSFs in the third selection cycle.

HSFs and corresponding codes of their 78 progenies selected in the third selection cycle

Link between the cluster variable and the quantitative variables for the ascending hierarchical classification

Dim., dimension.
Link between the cluster variable and the quantitative variables for the ascending hierarchical classification

NdB, number of days to bolting; NdF, number of days to flowering; DF, flowering period duration; NdM, number of days to maturity; DM, maturity duration; GY, grain yield per plant; TKW, one thousand glomeruli weight; Gr, germination rate; RMg, the multigermy ratio; sd, standard deviation.
Five best individuals closest to the centre (paragons) of the five clusters of the ascending hierarchical classification

Discussion
Analyses of collected data show evidently the great seed production potential of the sugar beet selected germplasm. The vernalization ability of the Merchouch target site is validated through HSFs' evaluation. Grain yield reached a maximum of 460 g per plant and seed germination 87.6%; thus, the Merchouch site could represent a good environment for sugar beet seed production.
The germination percentage of the produced seeds varied between 57 and 100%; the general mean of 87.6% reflects their skilful potential. The germination rate has usually a positive correlation with seed viability. A previous B. vulgaris hybrid investigation revealed differences in the seeds’ viability and a significant effect of the ploïdy level. In fact, according to Hallahan et al. (Reference Hallahan, Fernandez-Tendero, Fort, Ryder, Dupouy, Deletre, Curley, Brychkova, Schulz and Spillane2018) diploïd hybrids of sugar beet exhibit positive heterosis effects on the seeds; they recorded viability values around 100 and 75% when evaluating hybrids. The great seed germination and variability progress of the sugar beet developed germplasm enhanced significantly the reproductive potential of the half-sib sugar beet populations under study.
Many studies have been conducted on the effect of weather on the sugar beet grain yield. Specific weather conditions are required during flowering and seed ripening stages, as well as for vernalization and bolting (Hemayati, Reference Hemayati2009). The flowering schedule of the varieties reflects their adaptation to the environment by adjusting their vegetative and reproductive stages to environmental signals. The HSF selection strategy was adopted to establish resilient germplasm for further multi-environment investigation. From this perspective, the concept of mega-environments was chosen to assess the adaptation and plasticity of the genotypes. The mega-environments concept is based on the effects of the genotype and the genotype–environment interaction. This concept helps to assess the adaptive ability of the cultivars (Studnicki et al., Reference Studnicki, Lenartowicz, Noras, Wójcik-Gront and Wyszyński2019).
Progressive evolution of HSFs' major traits was noticed; a significant effect on the growth cycle duration between generations was confirmed. The number of days to maturity was augmented by 10.7 days between the first and the third selection cycles. The plant cycle duration has increased from 319.7 to 330.3 days and seems to be beneficial as it preserves the level of sugar in the root and maintains the inhibition of bolting during the vegetative stage; it also improves seed production during the reproductive season.
Controlling the early bolting and the vernalization during the selection process is critical, by choosing a suitable site and getting rid of early bolting plants help to get the expected seed and root production results. The early bolting behaviour in some plants is undesirable but after the transition to the generative stage, the main shoot elongation impacts negatively the root productivity. Early bolting has always been addressed in breeding programmes and resulted in improved early bolting resistance of modern cultivars (Milford et al., Reference Milford, Jarvis P and Walters2010).
An important variability of the varietal tendency to bolting and sensibility to various environmental factors was reported (Abou-Elwafa et al., Reference Abou-Elwafa, Abdel-Rahim, Abou-Salama and Teama2013). Grain yield is usually the principal plant breeding criteria breeders select; it reinforces the germplasm enhancement for seed production in a target environment. The wide genotypic variability found between half-sib progenies represents an added value for the selection purposes. The combination of the HSF and year factors revealed a significant effect on the phenological stage duration. Sugar beet yield potential depends upon several factors (Nikpanah et al., Reference Nikpanah, Seifzadeh, Hemayati, Shiranirad and Taleghani2015) including temperature at critical growth stages and rainfall distribution during the cropping season (Kenter et al., Reference Kenter, Hoffmann and Märländer2006). The PCA revealed 52.3% of variability explained by the first and the second principal axes.
The half-sib progenies differ primarily by their cycle duration and yield components. Both the PCA and the hierarchical clustering separate the clusters nicely, the great differences within and between the HSFs and the variables. The F2, F5, F6, F9, F10, F11, F14 and F15 half-sib progenies were the most homogenous groups. They are mainly late and start maturing after 350 days; their grain production fits within 99.5–275.3 g/plant yield class. Thus, the grain yield and the cycle length seem to control the accessions' behaviour and could help selecting the most appropriate cropping season, sowing and harvesting dates. Many studies report that the seasonal growth-cycle timing is evidently a shaping factor on the seed production site selection because most of the selection traits are changing along the latitude and by the local climate (Van Dijk et al., Reference Van Dijk, Boudry, McCombie and Vernet1997; Elzinga et al., Reference Elzinga, Atlan, Biere, Gigord, Weis and Bernasconi2007; Van Dijk and Hautekèete, Reference Van Dijk and Hautekèete2007; Risberg and Granström, Reference Risberg and Granström2009). The best performing HSFs constitute the main population that is adapted to the target location. Those HSFs were identified as potential parents for subsequent breeding; they also help to select the type of cultivar to develop the pure line, hybrid or open-pollinated variety. Progeny tests are generally performed in a set of target and representative environments on half-sibs, full-sibs, testcrosses or recombinant breeds (Acquaah, Reference Acquaah2007; Brown and Caligari, Reference Brown and Caligari2008). The genotypic variability in HSFs' behaviour is essential to the breeding programme. With an open-pollinated genetic structure, it is quite easy to improve heterozygosis (Messmer et al., Reference Messmer, Wilbois, Baier, Schäfer, Arncken, Drexler and Hildermann2015). Genotype and appropriate environmental conditions were reported to be essential factors that enhance sugar beet seed production performance (El Manhaly et al., Reference El Manhaly, Ghura and Saleh2000).
The selected half-sib progenies present better performance and resistance to diseases. Such progress raised further challenges in our breeding programme. As recommended by Hoffmann and Kenter (Reference Hoffmann and Kenter2018), sugar beet breeding for pathogen resistance and root storage capability is the most leading challenge to provide full utilization of the developed germplasm. Our second challenge is the use of local wild beet species through interspecific hybridization to integrate into the germplasm new resistance genes to pathogens and pests, and other intended traits.
Conclusion
In conclusion to this investigation, Merchouch represents a suitable site for sugar beet vernalization and seed production. The gradual enhancement of HSFs' performance through the selection cycles allows picking the most accomplished and homogeneous HSFs. The developed germplasm obtained in the third selection cycle proves the efficiency of the adopted breeding methodology. The present investigation outputs will allow the following up of the agro-morphological and technological traits of the half-sib progenies through further generations.
Supplementary material
The supplementary material for this article can be found at https://doi.org/10.1017/S0021859621000800.
Acknowledgements
This research was performed in the National Institute of Agricultural Research of Morocco (INRA-Morocco) – Regional Center of Agricultural Research of Rabat.
Financial support
This work was funded by the National Institute of Agricultural Research of Morocco (INRA-Morocco).
Conflict of interest
The authors declare there are no conflicts of interest.