Introduction
Kidney size is an important indicator not only to evaluate children with renal diseases but also to determine adequate organ growth.Reference Lee, Son and Kwak 1 It is known that early-life conditions such as maternal age and nutritional status during pregnancy influence growth patterns, body composition and risk for non-communicable chronic diseases in later life.Reference Luyckx, Bertram and Brenner 2 Kidney size is also a potential surrogate measurement for the number of nephrons, which are the structural and functional unit of the kidneys. As the number of nephrons is determined largely in prenatal life, suboptimal kidney growth and development in fetal life lead to a smaller number of nephrons.Reference Geelhoed, Verburg and Nauta 3 Some lines of evidence suggest that retarded growth or small-for-gestational-age, low birth weight (LBW) and preterm babies have relatively smaller kidneys with a decreased number of nephrons.Reference Luyckx, Bertram and Brenner 2 , Reference Abitbol, DeFreitas and Strauss 4
Whereas cellular proliferation in almost all organs occurs mainly before the third trimester of normal pregnancies, 60% of nephrons form in the third trimester and have developed by 36 weeks of gestation.Reference Hinchliffe, Sargent, Howard, Chan and van Velzen 5 , Reference Hughson, Farris, Douglas-Denton, Hoy and Bertram 6 In late pregnancy, poor maternal nutrition (such as low-protein intake and vitamin A deficiency), reduced placenta perfusion or steroid administration leads to fetal growth restriction and a permanent nephron deficit of up to 30%, with a 50% reduction in the glomerular filtration rate (GFR) reported in previous studies.Reference Geelhoed, Verburg and Nauta 3 , Reference Langley-Evans, Welham and Jackson 7 , Reference Hinchliffe, Lynch, Sargent, Howard and Van Velzen 8 In addition, protein deficiency and nematode infection during pregnancy impaired organ growth and the growth factors of the fetus thymus, spleen, heart, brain and kidney.Reference Langley-Evans, Welham and Jackson 7 However, most epidemiological studies have generally investigated pregnancy health status and birth outcome or organ growth during infancy but not in later childhood in prospective birth cohort studies in developing country settings.
Kidney size in relation to the child’s conditions at birth along with consideration of the child’s socio-economic status has not been well studied to date. A limited number of observational and experimental studies have been conducted in high-income settings. Research in this area is particularly challenging and important for countries where restricted fetal growth, LBW infants, and infectious disease related to morbidity and mortality are still high, and where non-communicable diseases including hypertension and chronic kidney disease are upcoming threats.
Objective
The aims of the present study were to determine childhood kidney size and function in relation to early-life conditions at birth, with an especial focus on LBW.
Methodology
Maternal and Infant Nutrition Intervention in Matlab (MINIMat) study design
The MINIMat (trial registration; isrctn.org identifier: ISRCTN16581394) food and multiple-micronutrient trial in pregnancy is a large cohort study conducted in Matlab, a rural area of Bangladesh. In this trial, prenatal food supplementation and different micronutrient alternatives were randomly allocated in an area where maternal malnutrition is common. Recruitment of the women in the MINIMat trial was conducted in the Matlab HDSS area of Bangladesh over a 2-year period from November 2001 to October 2003. The women were randomized to an Early (around 9 weeks) or a Usual (around 20 weeks) invitation to food supplementation and to one of three daily micronutrient supplementations. The prenatal supplementation took the form of six different food- and micronutrient supplements daily from week 14 during pregnancy: (a) the UNICEF/UNU/WHO preparation of 15 different micronutrients including 30 mg iron and 400 μg folic acid, (b) 60 mg iron and 400 μg folic acid only or (c) 30 mg iron and 400 μg folic acid only. Women in the early invitation group also received 600 kcal food supplementation starting in the first trimester of pregnancy and women in the usual invitation group received similar amount of food supplements starting as the usual national program suggests in the second trimester. The initial outcome measurements were the effects of prenatal food and micronutrient supplementation on birth weight, infant mortality and maternal hemoglobin in pregnancy, as described elsewhere.Reference Persson, Arifeen and Ekstrom 9
From November 2001 to October 2003, 4436 pregnant women between 6 and 8 weeks of pregnancy were enrolled in the MINIMat trial. Ultrasound fetal biometry was performed at 14, 19 and 30 weeks of pregnancy. The gestational age of each woman was calculated on the basis of crown rump length or biparietal diameter before 14 weeks of gestational age.Reference Neufeld, Wagatsuma, Hussain, Begum and Frongillo 10 In total, there were 3267 singleton live births. Infants in the MINIMat birth cohort were then followed up at 15 days and at 1, 2, 3 and 4 months. They were weighed and their lengths measured every month until the age of 6 months and then every 2 months until the age of 1 year, and other follow-ups were conducted at the ages of 2 years, 4.5 years and 9 years. Of these, 2735 children were tracked and followed up at 4.5 years of age. The present study was a part of the MINIMat prospective birth cohort study in which a cross-sectional assessment of the children’s kidney size was conducted at 4.5 years of age and their estimated glomerular filtration rate (eGFR) was estimated at 9 years of age. Kidney volume was assessed on a sub-sample of 1156 children by ultrasound [organ biometric study of children born over a span of 1 calendar year of births (June 2003 to June 2004), constituting about 50% of the systematic sample, a full 1-year’s recruitment out of 2 years’ recruitment]. Of these, 77 preterm births (<37 gestational weeks) were excluded from the analysis because of different biological mechanisms of organ development; seven children, because of refusal to participate; three children, because of having only one kidney; and two children, because of macrosomia (birth weight>4000 g). Finally, 1067 full-term singleton children were involved for the kidney volume data analysis. When they were aged 9 years, cystatin C was measured in 457 children of the 1067 children who were born at clinics (the immune cohort) to estimate the eGFR rate. Thus, information on 457 children who participated in both the 4.5-year and 9-year follow-ups were used for the kidney function analysis.
For the kidney size measurement, an ultrasound machine (SSA 510A/P3, Famio-5; Toshiba Medical Systems, Tokyo, Japan) with a 3.75 MHz standard convex scanner with the ellipsoid method, which is known as a reliable method to measure kidney volume, was used.Reference Geelhoed, Kleyburg-Linkers and Snijders 11 The children were observed from the vertical dorsal view because in children the dorsal view usually provides a more satisfactory image than does the midaxillary view. If dilatation of the renal pelvis was observed, a postvoiding examination of the kidney was done.
Laboratory analytical methods
Serum cystatin C was determined using the sandwich enzyme immunoassay technique with commercially available quantitative ELISA test kits (Quantikine®ELISA, Human cystatin C Immunoassay, 4.5 h solid-phase ELISA and NS0-expressed recombinant human cystatin C, manufactured by USA&Canada) at the clinical laboratory, and the results displayed the levels of cystatin C in nanograms per milliliters in blood.
Biometric measurements
Information such as maternal age and other socio-economic variables was collected. In addition, the weight and height of the women were measured at enrollment (early pregnancy before 14 weeks), and their body mass index (BMI) (kg/m2) was calculated on the basis of that information. The BMI was categorized as follows: underweight (<18.5), normal weight (18.5–24.9) and overweight or obese (⩾25). The children’s length/height and weight were measured at birth, at 4.5 years and at 9 years. The body surface area (BSA) of each child was assessed using anthropometric measures: weight and height. Height-for-age (HAZ), weight-for-age (WAZ), weight-for-height (WHZ), BMI-for-age (BAZ) z-scores of each child were calculated by using WHO Anthro software, at 4.5 and at 9 years (except WHZ at 9 years). Gestational weeks <37 was considered as preterm birth; birth weight <2500 g, as LBW; and ⩾2500 g, as normal birth weight (NBW). Infants with a birth weight and/or birth length below the 10th percentile for gestational age was considered as intrauterine growth retardation (IUGR).Reference Wollmann 12 For the present analysis, the kidney volume was considered as the sum of the right and left kidney volumes. To assess kidney function, the eGFR was calculated using the Zappitelli formula (eGFRCyst=75.94/[cystatin C (mg/l)1.17], which is known to be a useful cystatin C-based equation for use in children.Reference Zappitelli, Parvex and Joseph 13 The BSA was calculated using the Haycock formula [surface area (m2)=weight (kg)0.5378×height(cm)0.3964×0.024265].Reference Haycock, Schwartz and Wisotsky 14 The BSA was calculated at 2 points of measurement (age 4.5 and 9 years) because we measured the kidney size at 4.5 years and the function at 9 years. The present study adjusted the eGFR by the BSA at 9 years of age and the kidney volume adjusted by the BSA at 4.5 years of age because the absolute eGFRReference Smith 15 and kidney size are strongly correlated with the BSA.Reference Konus, Ozdemir and Akkaya 16 The eGFR was scaled to the BSA of 1.73 m2 with the unit of measurement of milliliters per minute per 1.73 m2. Adjusting the BSA for the eGFR and the kidney size basically removes the variability of the kidney size and eGFR with respect to the body size of the growing child.
Data analysis
The present study estimated the kidney size and function of young Bangladeshi children. Descriptive statistics were used to describe the study participants and distribution of LBW and NBW children as well as differences in the distribution between male and female children. The mean differences were assessed using the t test for two independent groups: birth weight status and sex of the children. The normality of the distributions was also checked. Differences in the proportions of LBW and NBW children were examined using the χ2 test. Univariable and multivariable linear regressions were performed to examine the association of kidney volume and its function with birth status and with maternal and prenatal conditions (birth weight status, child’s age, sex, mother’s age, mother’s early pregnancy BMI, food groups, micronutrient supplementation groups and socio-economic index). Several multivariable linear regression models were performed to find out the association between kidney volume and birth weight status as well as association between kidney function and birth weight status. Variables in the multivariable models were chosen based on the ambient risk factors (biological and socio-environmental) which had been theorized earlier.Reference Luyckx, Bertram and Brenner 2 Three multivariable models were developed to identify the association between kidney volume and birth weight status. In the first model, we adjusted for the sex and age of the child at the 4.5 years follow-up. In the second model, additional variables of mother’s age and BMI status during early pregnancy, food groups and micronutrient supplementation groups were adjusted. The third model was adjusted for the socio-economic index along with the model 2 variables. A further multivariable model was performed in which kidney volume was adjusted initially by the BSA and then placed into the multivariable model to observe the association with birth weight status in which we controlled all variables adjusted in model 3. To understand the association between kidney function and birth weight status, another linear regression model was developed after controlling for the sex of the child, mother’s age, mother’s early pregnancy BMI, food groups, micronutrient supplementation groups and socio-economic index. IBM SPSS (version 23.0; IBM Corporation, Armonk, NY, USA) was used for the analysis.
Results
The mean (s.d.) maternal age at enrollment (6–8 weeks of pregnancy) was 26.2 (6.0) years, and 14.2% of the women were aged 19 years or younger. In total, 27% of the women were underweight (BMI <18.5 kg/m2) and 6.6% were overweight or obese at enrollment. One-third of the women were nulliparous. The mean gestational age at birth was lower in the LBW children than in the NBW children. The mean weight, height and BMI of the LBW children’s mothers were lower than those of the NBW children’s mothers (P<0.001). Of the study children, 50.6% were male. LBW was more common in the female than in the male children (57.2 v. 42.8%; P=0.006). The mean (s.d.) age of the children at the 4.5-year follow-up was 55.5 (1.4) months. The mean values for length and weight at birth and for height, weight, and BSA at 4.5 years were significantly lower in the LBW children than in the NBW children. Of the study children, 41.6% LBW children and 2.5% NBW children were IUGR, respectively. The LBW children were mostly from low socio-economic strata as compared with the NBW children (43.6 v. 34.8%; P=0.038). The impacts of the food groups and micronutrient supplementation groups were identical for the LBW and the NBW children (Table 1). The mean gestational age at birth was higher in the growth retarded LBW children than in the non-growth retarded LBW children (39.4±1.1 v. 38.8±1.3; P<0.001).
Participants’ characteristics, n=1067

LBW, low birth weight; NBW, normal birth weight; BMI, body mass index; IUGR, intrauterine growth retardation.
Those children (n=457) participated in both follow-ups, their mean (s.d.) ages at the 4.5-year follow-up and at the 9-year follow-up were 55.7 (1.3) and 106.4 (1.5) months, respectively. The mean values for length and weight at birth and for height, weight and BSA at 4.5 and at 9 years were significantly lower in the LBW children than in the NBW children. Of those children (n=457) who participated in both follow-ups, 31.6% LBW children and 3.3% NBW children were IUGR, respectively (Supplementary Table 1).
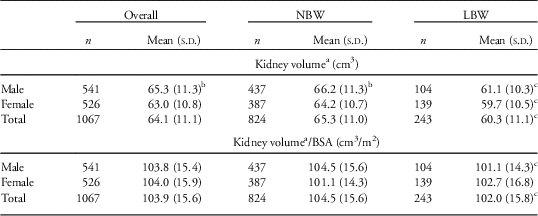
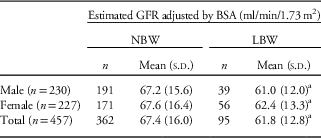
The mean (s.d.) kidney volume of the children at 4.5 years was 64.1 (11.1) cm3, with a significant mean difference observed between the NBW and the LBW children (65.3 [11.0] v. 60.3 [11.1]; P<0.001). The mean kidney volume differed between the male and the female children (P<0.001). Moreover, significant mean differences in the kidney volume/BSA were observed between the NBW and the LBW children (104.5 [15.6] v. 102.0 [15.8]; P<0.05). Male children born with the LBW status had a smaller mean kidney volume/BSA than did the male children born with NBW status (101.1 [14.3] v. 104.5 [15.6]; P<0.05) (Table 2). The mean eGFR was lower in the LBW children than in the NBW children (61.8 [12.8] v. 67.4 [16.0]; P=0.002). No significant difference was observed for the mean eGFR between the male and female children (66.2 [15.2] v. 66.3 [15.9]; P=0.925) (Table 3). In those children (n=457) who participated in both follow-ups, the mean kidney volume also differed significantly between the LBW and the NBW children (57.7 [9.3] v. 63.6 [10.7]; P<0.001). The mean kidney volume/BSA was smaller in the LBW children than in the NBW children (97.5 [14.4] v. 101.7 [14.9]; P=0.013).
Kidney volume of children by birth weight status and sex

LBW, low birth weight; NBW, normal birth weight; BSA, body surface area.
a Sum of right and left kidneys.
b P<0.05 between boys and girls.
c P<0.05 between groups.
Estimated glomerular filtration rate (GFR) by birth weight status and sex

LBW, low birth weight; NBW, normal birth weight; BSA, body surface area.
a P<0.05 between groups.
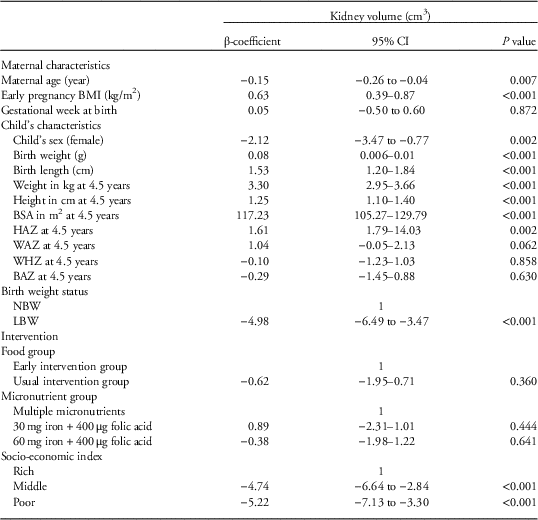
The LBW children had a smaller kidney volume than did the NBW children. The male children had a larger kidney volume than did the female children. Maternal early pregnancy BMI showed a positive correlation with kidney volume. Higher birth weight and birth length showed a positive association with a larger kidney volume. The BSA of the children at 4.5 years showed the highest positive correlation with kidney volume (β-coefficient=117.23). Increased score of HAZ of the children at 4.5 years showed significant positive association with kidney volume (β=1.61, P=0.002). The poor and middle socio-economic index children had a smaller kidney volume than did the rich socio-economic index children (Table 4). Of the LBW children (n=243), no significant association was observed between kidney volume/BSA and IUGR (β=−0.22, P=0.913), as well as association between eGFR, and IUGR (β=2.84, P=0.281). Moreover, there was no significant association observed between eGFR, and WAZ (β=−0.35, P=0.608), HAZ (β=−0.92, P=0.219) and BAZ (β=0.23, P=0.717) of the children at 9 years, respectively.
Univariable model of kidney volume by maternal and child characteristics

CI, confidence interval; BMI, body mass index; BSA, body surface area; HAZ, height-for-age z-score; WAZ, weight-for-age z-score; WHZ, weight-for-height z-score; BAZ, BMI-for-age z-score; NBW, normal birth weight; LBW, low birth weight.
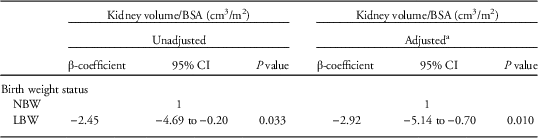
Two different multivariable models including all the biological variables were initially prepared. Additional models including the socio-economic index variable were subsequently also prepared. Model 1 indicates that the LBW children had a smaller kidney volume than did the NBW children (β=−5.01 [95% confidence interval (CI); −6.05 to −3.51], P<0.001) after adjusting for the sex and age of the children at the 4.5-year follow-up. After controlling for the mother’s age and BMI status during early pregnancy, food groups and micronutrient supplementation groups, model 2 also indicated that the LBW children had a smaller kidney volume than did the NBW children (β=−4.64 [−6.14 to −3.14], P<0.001). Model 3 showed similar findings to those of model 2 (β=−4.52 [−6.01 to −3.03], P<0.001) after adjusting for the additional variable of socio-economic index. The model of kidney volume/BSA showed a similar outcome in that the LBW children had a smaller kidney volume than did the NBW children after controlling for the sex and age of the children at the 4.5-year follow-up, mother’s age and early pregnancy BMI, food groups, micronutrient supplement groups and socio-economic index (Table 5).
Kidney volume at 4.5 years by birth weight status, n=1067

BSA, body surface area; CI, confidence interval; NBW, normal body weight; LBW, low birth weight.
a Adjusted variables: child’s sex and age at kidney volume measurement, mother’s age at conception, mother’s early pregnancy body mass index, food groups, micronutrient groups and socio-economic index variables.
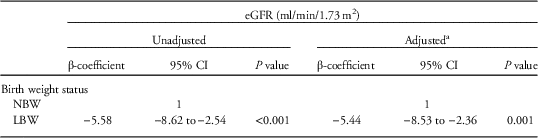
The eGFR showed a positive association with kidney volume/BSA (β=0.18 [95% CI; 0.08–0.27], P<0.001), after controlling for the sex of the child, birth weight status, mother’s age and mother’s early pregnancy BMI, food groups, micronutrient supplement groups and socio-economic index. Table 6 shows that the LBW children had a poorer eGFR than did the NBW children after controlling for the sex of the child, mother’s age and mother’s early pregnancy BMI, food groups, micronutrient supplement groups and socio-economic index.
Kidney function (eGFR) at 9 years by birth weight status, n=457

eGFR, estimated glomerular filtration rate; CI, confidence interval; NBW, normal birth weight; LBW, low birth weight.
a Adjusted variables: sex of the child, mother’s age at enrollment, mother’s early pregnancy body mass index, food groups, micronutrient groups and socio-economic index variables.
Discussion
The present cohort study conducted in rural Bangladesh has provided findings on the kidney size and eGFR from a large, homogeneously aged group of children. It has established an objective relationship between kidney size and its function in NBW and LBW children and demonstrated the association between kidney volume and its function with prenatal conditions. To our knowledge, this is the first study to reveal that kidney size in children is associated with prenatal conditions such as maternal age and nutritional status during pregnancy, birth weight and socio-economic index and that it is associated with the eGFR in later life.
One advantage of the study was that it covered the largest series of pediatric kidney volume assessed by sonography and eGFR based on cystatin C in a community of children in Bangladesh so far studied. Most previous studies reported the kidney size among different age groups of children, and none of them showed any associations between kidney size and function among a healthy, homogeneously aged group of children at the community level.Reference Iyengar, Nesargi and George 17 , Reference Keijzer-Veen, Kleinveld and Lequin 18 Other than this study, only a limited number of studies have considered the effect of maternal pregnancy characteristics and socio-economic status on child organ development, whereas these characteristics are vital for understanding organ development and function.Reference Geelhoed, Verburg and Nauta 3 , Reference Eze, Agwu and Ezeasor 19
In the present study, the LBW children had a smaller kidney volume and their eGFR was also poorer than that of the NBW children. Its findings are compatible with the finding and assumption of Spencer et al. that LBW children have smaller BSA-adjusted kidney volume than do NBW children. It has been proposed that this lower BSA-adjusted kidney volume in LBW children is a consequence of reduced nephron endowment associated with IUGR.Reference Spencer, Wang and Hoy 20 This statement might also be correct for the present study findings because present study considered babies born full-term only and nearly half of them (42%) were IUGR. However, present study did not find significant association with BSA-adjusted kidney volume and growth retarded LBW children, and association with eGFR and growth retarded LBW children, that might be because of the low statistical power for this particular group of children (n=243). These variations have clinical importance as many diseases such as hypertension and chronic kidney diseases are associated with changes in kidney size and function.Reference Emamian, Nielsen, Pedersen and Ytte 21 , Reference White, Perkovic and Cass 22 LBW is a known risk factor for progression of kidney diseases, hypertension and diabetes mellitus in adult life.Reference Keijzer-Veen, Kleinveld and Lequin 18 , Reference White, Perkovic and Cass 22 , Reference Brenner, Garcia and Anderson 23 LBW children are also known to have a lower nephron mass, where kidney volume is proportional to kidney mass.Reference Hoy, Hughson, Bertram, Douglas-Denton and Amann 24 , Reference Luyckx and Brenner 25 In healthy adults and infants, kidney mass and glomerular number are significantly associated with each other, and the clinical correlation of lower nephron mass with increased risk of hypertension and kidney disease is already known.Reference Nyengaard and Bendtsen 26 Accurate kidney function is extremely important for protection of the kidneys from toxic damage and for prescription of adequate fluid, medication and diets in clinical practice. An inadequate number of nephrons leads to a compensatory greater glomerular pressure and progressive glomerular sclerosis and subsequently predisposes the individual to impaired kidney function.Reference Geelhoed, Kleyburg-Linkers and Snijders 11 To increase the eGFR of children, kidney volume adequate to body size would have to be increased. The findings of the current study are also supported by earlier studies stating that kidneys with a reduced number of nephrons would lead to a diminished GFR.Reference Luyckx, Bertram and Brenner 2 Thus, the present study findings indicate that kidney size determines the eGFR in later life. Moreover, present study observed that the gestational age at birth was slightly but significantly lower in LBW than in NBW children. The variation of gestational age at birth between LBW and NBW children was predominantly from non-growth retarded LBW children, which might be associated with pregnancy-related disorders such as placental insufficiency.Reference Costello, Polito and Brown 27 A former study reported that those children born before 39 weeks of gestational age had an increased risk of congenital heart disease than those born after 39 weeks.Reference Costello, Polito and Brown 27
Geelhoed et al.Reference Geelhoed, Verburg and Nauta 3 reported that a smaller physiological growth rate in early life is associated with kidney volume, which is also true for the present findings. The anthropometric measurements (height, weight and BSA) differed significantly with respect to the birth status of the children, indicating that those with LBW could not catch up with the growth of NBW children up to 9 years of age, and therefore, their disease susceptibility might be different in adulthood, as is theorized for different kidney sizes.Reference Luyckx, Bertram and Brenner 2 The present study found that male children have a larger kidney volume than do female children; however, no statistically significant difference was observed between the male and female children for kidney volume/BSA. Furthermore, male children having LBW had a smaller average kidney volume/BSA than did male children having NBW. However, no significant difference was observed for kidney volume/BSA between female children having the LBW and those having the NBW. This might be due to the diverse role of the hormonal milieu on gender in the course of kidney disease. It has been suggested that sex hormones might play an important determinant role, with greater susceptibility in male individuals to progressive kidney injury. Estrogen has profound effects on transforming growth factor-β transduction and on the renin–angiotensin system, which would lead to alterations in kidney hemodynamics and affect kidney disease progression. It has been also suggested that male gender poses more risk for non-diabetic kidney disease and is arguably also a risk factor for progression of diabetic nephropathy.Reference Neugarten and Golestaneh 28 Thus, the present study suggests the importance of prior observation for male children with LBW to prevent their disease susceptibility in the future.
In the present study, the BSA showed the strongest correlation with kidney volume. It has been reported that organ growth shows a high correlation with advances in the BSA, height and weight during the developing process from infancy through adolescence.Reference Konus, Ozdemir and Akkaya 16 In addition, present study also observed a positive correlation with kidney volume and HAZ of children at 4.5 years. The kidney filters blood from the whole body, and thus, mean differences and multivariable models of kidney volume and eGFR were also established with respect to the BSA. The present study shows the importance of birth weight improvement for this community in which a cohort of LBW children survived but with a possible high risk for kidney and other chronic diseases in adult life. It is known that risk of LBW is affected by maternal nutrition and by health before and during pregnancy as well as by socio-economic conditions,Reference Luyckx, Bertram and Brenner 2 which was also true for the present study. The relationships between birth status and kidney size as well as with kidney function were not changed even after adjusting for the prenatal and postnatal characteristics of the children. Maternal undernutrition is a common phenomenon in Bangladesh and a former study reported higher rates of zinc, vitamin B12, and folate deficiencies and Ascaris infection among MINIMat study participants in their early pregnancy.Reference Lindstrom, Hossain and Lonnerdal 29 It has been known that maternal micronutrient deficiency has long-term consequences for fetal development and predisposes the infant to metabolic dysfunction in adult life through epigenetic modifications,Reference Christian and Stewart 30 which would be true for the present study children. Therefore, the current study suggests that prenatal programming has an effect on kidney size and its function in children.
The implications of the present study for Bangladeshi clinicians are obvious given the possible variations in the anthropometric parameters of normally growing children where the increasing prevalence of chronic disease is an upcoming threat for the country. According to a recent study, 26.4% of Bangladeshi adults were hypertensive in 2016,Reference Chowdhury, Uddin, Haque and Ibrahimou 31 whereas the percentage was only 1.10% in 1976Reference Malik 32 indicating that this trend is expected to grow in the near future. Anand et al.Reference Anand, Khanam and Saquib 33 reported that the prevalence of chronic kidney disease was 26% in 2014 in Bangladeshi adults and another study reported a higher salt intake custom in Bangladesh.Reference Hawkes and Webster 34 Excessive dietary salt intake bestows a major challenge to the kidneys to excrete large amounts of salt. The kidneys control blood pressure by ultimately determining sodium excretion; thus, the kidneys’ ability to excrete sodium is a key factor. If the kidneys cannot deal with this excessive sodium overload, blood pressure will increase. Moreover, an excessive amount of sodium in the bloodstream crushes the delicate balance and reduces the renal functional ability to remove water and to excrete salt.Reference Meneton, Jeunemaitre, de Wardener and MacGregor 35 Thus, the present study suggests the need for preventive measures for LBW children that must be given high priority in future health care. Thus, it is important for countries to have their own population-specific data on kidney size and eGFR because the population data of developed countries cannot be used as a universal pattern. The present study results could be generalized to the wider international community where the prevalence of restricted fetal growth and LBW children is high. The present study findings may also be utilized as background information to understand disease development in the same population in adulthood.
A limitation of the present study was that kidney function was not measured by inulin clearance, which is known to be a direct measure of kidney function. Another limitation was the unavailability of data about maternal and child dietary habits as well as measurements of eGFR at 4.5-year follow-up and kidney volume at 9-year follow-up. A further limitation was that the association between kidney size and blood pressure of the children was not observed in the present study. Its major strength is its prospective design from fetal life onward within a large, population-based cohort. Furthermore, the study provides information that can be useful for both clinicians and public health professionals.
Conclusions
LBW can potentially lead to adverse effects on the kidney size and function in children. The size of the kidney necessitates knowing the normal ranges of its volume and function with respect to the BSA in LBW and NBW children. This study can be used as reference data for health professionals to understand the relationship between kidney size and function in children.
Acknowledgments
The authors thank all study participants who expended enormous effort to provide information in the several follow-ups for this study. Our appreciation extends to the field team members and data management staff for their massive support in data collection. The authors also thank F. Miyamasu (Medical English Communications Center, University of Tsukuba) for English editorial service.
Financial Support
This present study was supported by the International Centre for Diarrhoeal Disease Research, Bangladesh; the UK Medical Research Council; the Swedish Research Council; UNICEF; the UK Department for International Development; a Grant-in-Aid for Scientific Research from the Japan Society for the Promotion of Science (#18256005); the Child Health and Nutrition Research Initiative; Uppsala University; the US Agency for International Development under cooperative agreement #388-G-00-02-00125-00; the Australian International Development Agency; the Government of Bangladesh; the Government of the Netherlands; the Swedish International Development Cooperative Agency; and the Swiss Agency for Development and Cooperation.
Conflicts of Interest
None.
Ethical Standards
The study was conducted according to the guidelines laid down in the Declaration of Helsinki. All procedures involving human research participants were approved by the ethics review committees of the icddr,b and Uppsala University. Written informed consent was obtained from the parents.
Supplementary material
To view supplementary material for this article, please visit https://doi.org/10.1017/S2040174417000976