Implications
Performance of 1922 first generation crosses of Norwegian Red cattle and Holsteins were compared to 7487 purebred Holsteins for production and secondary traits under intensive management in commercial herds. Milk, fat and protein production of purebred Holstein cows were higher than the crossbreds. Differences for somatic cell score, and abortion rate, dystocia, ketosis and milk fever were not significant. Female fertility and body condition scores were higher for the crossbred cows. Herd-life was shorter by 79 days for crossbred cows. Based on the current Israeli breeding index, the purebred Holsteins have an economic advantage of $104/insemination.
Introduction
Crossbreeding is a common strategy for most agricultural animal species, including poultry, swine, sheep and beef cattle. Generally ‘economic heterosis’ is obtained, that is the progeny of the cross is more profitable than either parental breed (Weller, Reference Weller1994). For dairy cattle crossbreeding has generally not been considered an economically viable option. Unlike poultry crossbred females must also be used as dams for the following generation. If the first generation crossbred (F-1) animals are bred back to either parental breed, then the heterosis effect is reduced in the backcross (BC) generation. Swan and Kinghorn (Reference Swan and Kinghorn1992) attributed the dearth of crossbreeding in dairy cattle to the higher milk production of purebred Holsteins compared to other strains, although Buckley et al. (Reference Buckley, Lopez-Villalobos and Heins2014) presented examples of high economic heterosis.
The Holstein breed dominates dairy cattle production world-wide, and especially in the developed countries. Holsteins have the highest mean milk production of all commercial dairy breeds (e.g. VanRaden and Sanders, 2003). Studies show that breeding for production has led to a reduction in secondary traits, especially those related to female fertility (e.g. Lucy, Reference Lucy2001; Heins et al., 2006a, 2006b). Thus, interest in crossbreeding Holstein cows to other breeds has increased; mainly to improve secondary traits, especially those related to female fertility (Weigel and Barlass, Reference Weigel and Barlass2003; Funk, Reference Funk2006; Buckley et al., Reference Buckley, Lopez-Villalobos and Heins2014). Results of several studies have been reported including progeny of crosses between Holsteins and Normande, Montbéliarde, Scandinavian Red, Jersey and Brown Swiss (Dechow et al., Reference Dechow, Rogers, Cooper, Phelps and Mosholder2007; Heins and Hansen, Reference Heins, Hansen and Seykora2012; Heins et al., Reference Heins, Hansen and De Vries2006a, Reference Heins, Hansen and Seykora2006b, Reference Heins, Hansen and Seykora2006c and Reference Heins and Hansen2012; Malchiodi et al., Reference Malchiodi, Cecchinato and Bittante2014; Olson et al., Reference Olson, Cassell, Hanigan and Pearson2011). Generally these studies have demonstrated that purebred Holsteins are superior for milk production, but somewhat inferior for fertility and cow survival. However, only a few hundred cows of each cross were generally included in the analyses (Dechow et al., Reference Dechow, Rogers, Cooper, Phelps and Mosholder2007; Heins and Hansen, Reference Heins, Hansen and Seykora2012; Heins et al., Reference Heins, Hansen and De Vries2006a, Reference Heins, Hansen and Seykora2006b, Reference Heins, Hansen and Seykora2006c and Reference Heins and Hansen2012; Malchiodi et al., Reference Malchiodi, Penasa, Tiezzi and Bittante2011 and Reference Malchiodi, Cecchinato and Bittante2014; Olson et al., Reference Olson, Cassell, Hanigan and Pearson2011).
The Israeli Holstein breed is unique in that it has the highest average milk production, as compared to other countries, and has also been bred for increased fertility under the difficult conditions of high production, and a hot climate (Weller and Ezra, Reference Weller and Ezra2004). Over the last decade thousands of Israeli Holsteins have been inseminated with Norwegian Red (NRF) semen. The objectives of this study were to compare performance of the F-1 and BC cows for production and secondary traits to purebred Israeli Holsteins, including milk production persistency, body condition score, and several health traits that were not analyzed in previous studies.
Material and methods
Records on production and secondary traits were collected for 1922 F-1 crossbred cows in 50 commercial herds, and 829 of these cows have records for three parities. The overwhelming majority of the crossbred cows were bred back to Holstein bulls, and data has been recorded on 765 BC cows in 45 herds. In all of the herds with crossbred progeny, the majority of the cows were still purebred Holsteins. Only cows with all ancestors listed in the Israeli Herdbook as Holsteins for at least three generations were considered ‘Purebred’ Holstein cows. F-1 crossbred cows were daughters of purebred Holstein cows inseminated with imported Norwegian Red cattle (NRF) semen. All NRF bulls were progeny tested in Norway by Geno SA, and appeared in the Geno bull catalog. Most Holstein purebred cows included in the analysis were progeny of progeny-tested Israeli Holstein bulls, including progeny of all virgin calves and nearly all later parity cows. Generally first parity cows are inseminated with semen of young, unproven Israeli Holstein sires. The BC cows were daughters of F-1 cows inseminated with semen of either local purebred Israeli Holstein bulls, or foreign Holstein bulls, chiefly from the United States and Canada. The same feed ration, optimized for Israeli Holsteins, was provided to all cows of the same age.
Within each herd-year two seasons were defined, beginning in 1 April and 1 October. Each analysis of the F-1 cows included only herd-year-seasons (HYS) with at least four F-1 and four purebred Holstein cows in first parity. Traits scored up to first calving included cows born between 2005 and 2011. Traits scored on parities 2 and 3 included cows born between 2005 and 2009. Each analysis of the BC cows included only HYS with a least three BC and three purebred Holsteins in first parity, born between 2007 and 2011. The numbers of herds, HYS, and sires of cows included in the analyses of the milk production traits in the F-1 and BC generations are given in Supplemental Table S1. Most herds were large communal herds, with an average of 300 cows per herd. Milk production was automatically recorded, and milk samples were collected monthly by technicians and analyzed for fat and protein concentration and somatic cell score (SCS) at the laboratory of the Israel Cattle Breeders’ Association by Fossometric analysis.
Data from the F-1 and BC generations were analyzed separately, because BC cows were produced later and their contemporaries were therefore at a higher genetic level. Milk, fat and protein production and SCS were corrected for the effects of calving age and month, and days open, as described previously (Ezra et al., Reference Ezra, Weller and Bar-Anan1986, Reference Ezra, Weller and Drori1987). Incomplete lactations were extended to 305 days, as described by Weller (Reference Weller1988). Extension factors were recomputed in 2013. The new factors have not been published, but have been validated by Interbull. In addition to the simple means by paternal strain for parities 1 to 3, a ‘breed’ effect was computed by Proc Mixed of SAS (SAS, 2008) separately for each parity. Estimated breeding values (EBV) of cows were analyzed by a model that included the fixed effect of paternal breed and the random effect of sire EBV nested within sire breed. EBV for 305 day milk, fat, and protein production, SCS, milk production persistency and conception status were computed by a multi-trait animal model including all valid records of parities 1 to 5 of recorded cows in the Israeli dairy population since 1985. Parities 1 to 5 were analyzed as separate correlated traits, as described by Weller and Ezra (Reference Weller and Ezra2004) and Weller et al. (Reference Weller, Ezra and Leitner2006). The analysis model for all six traits was:
 $$Y_{{ijklm}} \,{\equals}\,H_{{ij}} {\plus}G_{{ik}} {\plus}A_{{ilm}} {\plus}P_{{iln}} {\plus}e_{{ijklm}} ,$$
where Y ijklm is the record for parity m of cow l from HYS j for trait i; H ij the effect of HYS j on trait i; G ik the effects of genetic groups k on trait i; A ilm the additive genetic effect of cow l on parity m for trait i; P in the parity-by-herd-type effect n of cow l for trait i; and e ijklm the random residual. The H, G and P effects were considered fixed, and the A and residuals were assumed to be random. A separate parity-by-herd-type effect was determined for each 10-year period, based on the cows’ first calving dates. Two herd-types were determined: large, communally managed farms and family farms. All known ancestors of cows with records were included in the analyses. Eighty genetic groups were defined for animals with unknown parents; based on sex of animal with unknown parents, which parents were unknown, age and strain. Thus NRF bulls or their parents with unknown parents were assigned to separate genetic groups. Both parents were known for all of the cows included in the analysis and their dams. Thus group effects on these animals should be minimal. Based on the genetic correlations among parities and relationships, EBV were computed for all five parities for each cow with a valid first parity record. Any heterosis effect in the F-1 and BC progeny would be included in the F-1 and BC bulls’ EBV.
EBV for fat and protein percentage were derived from the EBV for the production traits, as described by Weller and Ezra (Reference Weller and Ezra2004). Persistency was defined as predicted milk production 180 days after peak divided by peak production (in %), as described by Weller et al. (Reference Weller, Ezra and Leitner2006). Conception status was scored as the inverse of the number of inseminations to conception per parity (in %), as described by Weller and Ezra (Reference Weller and Ezra1997). For cows that were not re-inseminated during the lactation, pregnancy was determined either by subsequent calving or by palpation ~42 to 60 days after the last insemination, as described previously (Weller and Ezra, Reference Weller and Ezra1997). For cows that were culled before palpation, pregnancy status was considered undetermined. (This could have introduced a slight bias, as F-1 cows had a higher culling rate.)
EBV for herd-life were computed by a single trait animal model for the entire recorded population (Settar and Weller, Reference Settar and Weller1999). The trait scored was the number of days from first calving to culling. For cows that were not culled, expected herd-life was computed by the method of Settar and Weller (Reference Settar and Weller1999), as updated by Weller and Ezra (Reference Weller and Ezra2015). In addition to the simple means by paternal breed, a breed effect was computed by analysis of the cows’ EBV by Proc Mixed using the same model as the milk production traits.
Body condition score was recorded at three time points: at the beginning of the lactation, from parturition up to 2 weeks postpartum; at lactation peak, between 40 and 90 days postpartum; and within 30 days of drying-off of the cow. Body condition score was analyzed by Proc Mixed by a model that included the fixed effects of paternal breed, days in milk at scoring and freshening year, and the random effects of the sire and HYS.
The discrete traits; including culling rate, conception rate of nulliparous calves; first parity dystocia and stillbirth and rates of abortion, metritis, ketosis, milk fever and displaced abomasum were analyzed by Proc Glimmix of SAS (SAS, 2008). Differences between the purebred and F-1 cows, computed on the logit scale were transformed back to the trait scale as proposed by Lavon et al. (Reference Lavon, Ezra, Leitner and Wolfenson2011). (The same procedure could not be used to transform standard errors of the difference (SED), and therefore the SED are not presented for the Proc Glimmix analyses.) Culling rates of calves before first calving were analyzed for calves born between 2005 and 2011. Culling rates from first calving up to the end of second parity were analyzed for cows born between 2005 and 2008. Cows that were reported as stolen or sold to other farms or agents were deleted from the analyses. With respect to dystocia, farmers scored calvings according to 4 categories: unassisted, assisted but ‘easy,’ assisted and ‘difficult,’ or ‘surgical.’ A calving was considered ‘difficult’ if either of the last two categories were recorded. Calf mortality was defined as birth of a dead calf, or death within 48 h of calving. Abortion rates were computed as a fraction of all cows that conceived. An abortion was defined as a loss of a confirmed pregnancy, between pregnancy diagnosis and day 260 of gestation, determined either by means of palpation or if a cow listed as pregnant was reinseminated.
The analysis models for conception rate included the effect of paternal breed, insemination number (1 through 5), and year of insemination as fixed effects; and sire of cow, service sire and HYS as random effects. Rates of dystocia and calf mortality were analyzed for first parity calvings, while abortion rates were analyzed for parities 1 to 3. The analysis model for dystocia and calf mortality included the fixed effects of breed of sire of cow and breed of sire of calf, age of cow at calving in months, sex of calf and calving year, and the random effects of sire of cow, sire of calf and HYS (Weller et al., Reference Weller, Misztal and Gianola1988). It should be noted that sire of cow affects both the ability of the cow to calve, and the size of the calf. The model for abortion rate included the random effects of sire of cow, sire of calf and HYS in addition to the fixed effects of breed of sire and year of effective insemination. Each parity was analyzed separately. For dystocia, stillbirth and abortion rate, in addition to the comparison between the progeny of F-1 and purebred Holstein, mean rates of abortion for purebred Holstein cows inseminated by Holstein and NRF bulls were also analyzed. For culling rate, metritis, ketosis, milk fever and displaced abomasum the model included the fixed effects of breed of sire and calving year, and the random effects of sire of cow, sire of calf and HYS. Culling was scored by the farmer; metritis, ketosis, milk fever and displaced abomasum were diagnosed by the attending veterinarian.
The BC cows born between 2007 and 2011 were analyzed for 305-day milk, fat, and protein production, fat and protein concentration, somatic cell score (SCS), conception status, incidence of metritis and body condition score, as described for the F-1 cows. Due to the relatively low number of BC cows with valid records, body condition score was analyzed only for parities 1 and 2.
Results
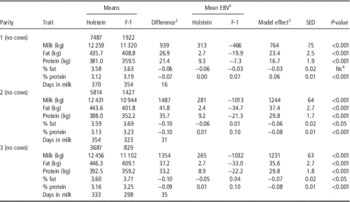
Mean EBV and mean production of milk, fat, and protein production, and fat and protein percentage for the first three parities of the F-1 and Holstein cows are given in Table 1. The numbers of cows in each group, mean days in milk, the mean differences between the records of the two groups and the differences in the cow group model effects are also given. For parities 2 and 3, the record means included only cows with records in those parities, while the EBV means and the model effect included all cows with first parity records. The differences between the model effects, which were computed by Proc Mixed from the cows’ EBV were generally smaller than the mean differences in the actual records. This is as expected, as EBV are regressed. Differences between the purebred and F-1 cows were significant (P<0.001) for all milk production traits, except for fat concentration, which was significant at P<0.05 for second and third parities. The Holsteins were higher for milk, fat and protein production and days in milk, while the F-1 cows were slightly higher for fat and protein concentration. Differences in the model effects were 764, 1 244, 1 231 for kg milk, 23.4, 37.4, 35.6 for kg fat and 16.7, 29.8, 29.8 for kg protein; for parities 1 through 3. Difference in production increased with increase in parity, and for protein the difference between the two groups in third parity were nearly double the first parity values. (The difference in days in milk between the Holstein and F-1 cows did not affect production records, as all records were standardized to 305-day production.) Heins and Hansen (Reference Heins, Hansen and Seykora2012), who compared Holsteins to F-1 crosses with Scandinavian Reds, found a difference of 6% for first parity, as compared to 7% in the current study. In the current study differences were greater for second and third parity.
Mean 305 day milk, fat, protein production, fat and protein concentration, days in milk and mean estimated breeding values (EBV) for the purebred Holstein and F-1 cows in parities 1–3

1 All cows with valid first parity records were included for computation of mean estimated breeding values.
2 ‘Difference’ is the simple difference in the means of the two groups.
3 ‘Model effect’ is the difference between the Holstein and F-1 effects in the Proc Mixed analysis model.
4 Ns= not significant, P<0.05.
Mean SCS and mean EBV for purebred Holstein and F-1 cows in parities 1 to 3 are given in Table 2. Differences were very small, and significant only for parity 2 (P<0.05), with F-1 cows higher by 0.08 units. Heins and Hansen (Reference Heins, Hansen and Seykora2012) found that the F-1 cows were slightly lower for SCS in parities 1 and 5.
Mean somatic cell score and mean estimated breeding values (EBV) for purebred Holstein and F-1 cows in parities 1 to 3

1 All cows with valid first parity records were included for computation of mean estimated breeding values.
2 ‘Difference’ is the simple difference in the means of the two groups.
3 ‘Model effect’ is the difference between the Holstein and F-1 effects in the Proc Mixed analysis model.
4 Ns= not significant, P<0.05.
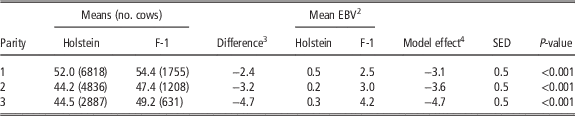
The simple means and the model effects for conception rates for nulliparous cows were higher for the F-1 cows, but the differences were not statistically significant. Mean conception rates for nulliparous purebred Holstein and F-1 cows are given in Supplemental Table S2. Mean conception status for purebred Holstein and F-1 calves and cows in parities 1 to 3 are given in Table 3. F-1 cows had higher fertility in all three parities (P<0.001). Differences in conception status increased from 3.1% in first parity to 4.7% in parity 3. Despite the low heritability for this trait, differences in the model effects, computed from the EBV were generally greater than the differences in the simple means.
Mean conception statusFootnote 1 and mean estimated breeding values (EBV) for purebred Holstein and F-1 cows in parities 1 to 3

1 See text for definition of ‘conception status.’
2 All cows with valid first parity records were included for computation of mean estimated breeding values.
3 ‘Difference’ is the simple difference in the means of the two groups.
4 ‘Model effect’ is the difference between the Holstein and F-1 effects in the Proc Mixed analysis model.
Malchiodi et al. (Reference Malchiodi, Cecchinato and Bittante2014) found differences of 6% and 9% between F-1 crosses between Holsteins and Swedish Red and purebred Holsteins for 56-day non-return rate and first service conception rate for virgin calves. These values are clearly greater than in the current study. For first parity cows the differences were 11% for both traits. Buckley et al. (Reference Buckley, Lopez-Villalobos and Heins2014) found a mean difference of 8% for pregnancy rate to first service in parities 1 to 3 between the F-1 cross of Holsteins and NRF and purebred Holsteins, while Heins and Hansen (2012) found a mean difference of 6.2% over the first five parities between F-1 crosses of Scandinavian Reds and Holsteins, as compared to purebred Holsteins.
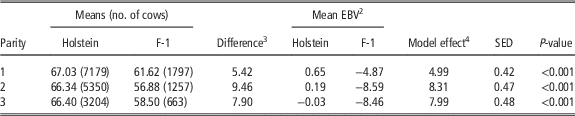
Mean milk production persistency and mean EBV for purebred Holsteins and F-1 cows in parities 1 to 3 are given in Table 4. Holsteins had significantly higher persistency in all three parities (P<0.001). Differences were highest in second parity. For all three parities, the model effects were slightly less than the differences in the simple means. This trait was not considered in previous studies of crossbred cows.
Mean milk production persistencyFootnote 1 and mean estimated breeding values (EBV) for purebred Holsteins and F-1 cows in parities 1 to 3

1 See text for definition of ‘persistency.’
2 All cows with valid first parity records were included for computation of mean estimated breeding values.
3 ‘Difference’ is the simple difference in the means of the two groups.
4 ‘Model effect’ is the difference between the Holstein and F-1 effects in the Proc Mixed analysis model.
For first and second parity cows, abortion rates were lower for both Holstein cows inseminated with NRF semen, and the F-1 cows. For third parity cows abortion rates were lower for both progeny of Holstein bulls, and for purebred Holsteins compared with F-1 cows. However, only the first parity effect of sire of calf breed was significant (P<0.05). Mean rates of abortion for purebred Holstein cows inseminated by Holstein and NRF bulls are given in Supplemental Table S3, and mean rates of abortion for purebred Holsteins and F-1 cows are given in Supplemental Table S4.
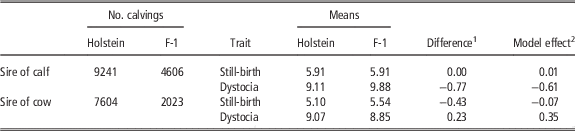
Frequencies of first parity still-born calves and dystocia for Holstein cows inseminated with Holstein and NRF semen, and Holstein and F-1 cows are given in Table 5. Differences between the F-1 and Holstein cows for the calving traits, and the direct effects of breed of sire on the calf were not significant. Heins et al. (2006c) found that cows mated by Scandinavian bulls (5.5%) had significantly less calving difficulty than calves sired by Holstein bulls (16.4%) for first parity Holstein heifers. Also, fewer stillbirths resulted from use of Scandinavian bulls (7.7%) compared with Holstein bulls (15.1%). First parity F-1 cows had significantly less calving difficulty than pure Holsteins (11.6% v. 17.7%), and F-1 had significantly lower stillbirth rates at first calving than pure Holsteins (5.1% v. 14.0%).
Frequencies (in %) of first parity still-births and dystocia for Holstein cows inseminated with Holstein and NRF semen, and Holstein and F-1 cows

NRF=Norwegian Red cattle.
1 ‘Difference’ is the simple difference in the means of the two groups.
2 ‘Model effect’ is the difference between the Holstein and F-1 effects in the Proc Glimmix analysis model. None of the differences were significant at P<0.05.
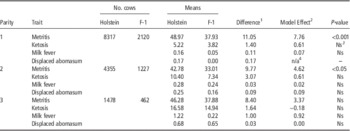
Mean incidence of calving disease within 21 days after calving, including metritis, ketosis, milk fever, and displaced abomasum for purebred Holsteins and F-1 cows by parity are given in Table 6. Holstein cows had higher frequencies of all four conditions, but differences between the F-1 and purebred cows were significant only for metritis in first and second parities. Differences in metritis decreased with increase in parity.
Incidence (in %) of metritis, ketosis, milk fever, and displaced abomasum for purebred Holsteins and F-1 cows by parity

1 ‘Difference’ is the simple difference in the means of the two groups.
2 ‘Model effect’ is the difference between the Holstein and F-1 effects in the Proc Glimmix analysis model.
3 Ns= not significant, P<0.05.
4 The model effect could not be computed, because there were no F-1 cows with displaced abomasum.
Body condition score was higher for the F-1 cows after freshening, at peak production and before drying-off in all three parities (P<0.01), and the difference between body condition score after freshening and at peak was also significant for first parity (P<0.001). Differences between the F-1 and Holstein cows ranged from 0.2 to 0.4 units. This is as expected considering that the F-1 cows had lower production, and NRF cows have lower growth rates than Holsteins. Thus, Holsteins are apparently contributing more body energy to milk production. Mean body condition score values for purebred Holstein and F-1 cows recorded for parities 1 to 3 are given in Supplemental Table S5. The differences between body condition score after freshening and at peak production are also given.
Overall culling rate was 6% higher for the F-1 cows. The main causes for culling of first and second parity cows are given in Supplemental Table S6. Of the cows culled, the fraction of F-1 cows culled due to ‘selection’; that is, voluntary culling, was greater, while the fraction of cows culled for all other causes, except non-conception was lower. For both groups, 24.1% of cows were culled due to infertility. As a fraction of all first parity cows, F-1 cows had higher rates of culling for selection and non-conception, but lower rates for death, dystocia and disease. Thus the slightly higher fertility rate of the F-1 cows did not result in lower culling for non-conception.
Means and mean EBV of herd-life from first calving to culling for purebred Holstein and F-1 cows are given in Table 7. The purebred Holsteins had longer herd-life (P<0.001). The difference was 207 days for the simple means, but the model effect was only 79 days. This difference may be due to the fact that for cows still alive at the time of the analysis expected herd-life was estimated, and these records received less weight in the animal model analysis, as described by Settar and Weller (Reference Settar and Weller1999). Contrary to the current results, Heins et al. (Reference Heins and Hansen2012) found that the rate of survival to second calving was 10% higher for F-1 crosses of Holsteins to Scandinavian Reds as compared to purebred Holsteins.
Means and estimated breeding values (EBV) of herd-life from first calving to culling for purebred Holstein and F-1 cows

1 For means, ‘difference’ is the simple difference in the means of the two groups, for estimated breeding values, this is the difference between the Holstein and F-1 effects in the Proc Mixed analysis model.
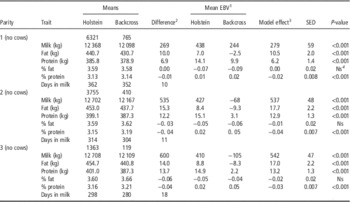
Mean milk, fat, protein production, fat and protein concentration, and mean days in milk for the purebred Holstein and BC cows in parities 1 to 3 are given in Table 8. Compared to Table 1, the means of the purebred Holsteins in first parity were higher for milk, fat and protein by 110, 5.0 and 4.8 kg. In second parity the differences increased to 270, 10.6 and 11.1 kg for milk, fat and protein. Differences between the means of EBV of the purebred Holsteins in Tables 1 and 8 were similar to the differences in the simple means. The increase in milk, fat and protein production for both groups of cows in Table 8, compared to Table 1 is due to the fact that the cows in Table 8 are of a later time period. As in Table 1, days in milk were greater for Holsteins as compared to BC cows, and the difference was greatest for third parity. Differences were significant for the three milk production traits for all three parities (P<0.001), and for protein percentage, but not for fat percentage. Holsteins were higher for production, but lower for protein percentage. As found in analysis of the F-1 generation, differences between the Holsteins and BC cows increased from first to second parities, while the results for second and third parities were very similar. Generally the model effects were very similar to the differences in the simple means.
Mean 305 day milk, fat, protein production, fat and protein concentration, and mean days in milk for the purebred Holstein and backcross (BC) cows to Holsteins in parities 1–3

1 All cows with valid first parity records were included for computation of mean estimated breeding values.
2 ‘Difference’ is the simple difference in the means of the two groups.
3 ‘Model effect’ is the difference between the Holstein and F-1 effects in the Proc Mixed analysis model.
4 Ns=not significant, P<0.05.
Similar to the results for the F-1 generation, differences in mean conception rates for nulliparous purebred Holstein and BC calves were not significant. Means are given in Supplemental Table S7. Mean conception status and mean EBV for purebred Holstein and BC calves and cows in parities 1 to 3 are given in Supplemental Table S8. As in Table 5 for the F-1 generation, purebred Holsteins were lower than the BC cows (P<0.001), but the differences were only about half those observed for the F-1 cows, as expected by additivity. The model effects were greater than the difference of the simple means for parities 1 and 2, but smaller for parity 3. However, there were only 83 BC cows with third parity records for conception status.
Culling rates of purebred Holstein and BC cows from birth through first parity are given in Supplemental Table S9. Unlike the F-1 cows, mean culling rates were lower for the BC cows than for purebred Holsteins, but differences were not statistically significant. Despite the slightly greater culling rates for Holsteins, mean number of days to culling and mean number of lactations were both greater for the purebred Holsteins, although the differences were also not significant. Mean body score values for purebred Holstein and BC cows recorded after freshening, at peak production and before drying-off for parities 1 to 2 are given in Supplemental Table S10. As in the analysis of the F-1 cows, body condition score values were consistently lower for the purebred Holsteins. Differences were significant for all time periods for first parity, but only after freshening for second parity, but there were <100 BC cows in second parity. Differences between BC and purebred Holsteins were not significant for any other of the traits analyzed, and are therefore not presented.
Discussion
Although the fertility trait analyzed in the current study for first parity cows was conception status, as opposed to non-return rates or conception rates, differences were less than those found by the other studies. This may be due to a genotype by environment interaction. NRF were not bred for the hot Israeli climate. In addition female fertility has been included in the Israeli breeding index since 2000, and Israeli bulls are among the highest ranked for conception rate in the Interbull analysis of Holsteins.
Generally rates for dystocia and stillbirth in the current study were considerably less than the values found by Heins et al. (2006c) for purebred Holsteins. This may be due to the practice in Israel of mating nearly all virgin heifers only to bulls with favorable evaluations for calving traits (Weller et al., Reference Weller, Misztal and Gianola1988). The fact that the crossbred cows were inferior in production and not much better for fertility and calving traits may also explain the advantage of the Holsteins for herd-life and culling rate; which, as noted previously, is at variance with previous studies. The current Israeli breeding index, PD11, includes the traits: fat, protein, SCS, fertility, herd-life, persistency, dystocia and still-birth with economic values of 7.9, 23.7, −300, 26, 0.6, 10, −3 and −6, respectively (Weller et al., Reference Weller, Stoop, Eding, Schrooten and Ezra2015). Note that milk is not included, and the calving traits refer to the effect of the cow calving. Units of PD11 are approximately equal to kilograms of milk production per cow. The current Israeli milk price at the farm is ~$.50/kg. According to McGilliard (Reference McGilliard1978) the net present value for an individual insemination with a profit horizon of 10 years is approximately equal to 0.25 of the farmer’s milk price, or ~$0.12. In computation of PD11 the EBV for traits recorded on all parities are first combined into an index based on the first five parities (Weller and Ezra, Reference Weller and Ezra2004). Since only parities up to three were included in this analysis we assumed equal weights for the three parities. Applying these coefficients to the model effects for these traits give an advantage of 868 units PD11 ($104/insemination) for the Holsteins as compared to the F-1 progeny of an NRF insemination. Although the F-1 cows do have an economic advantage for SCS, fertility and dystocia, this advantage is small relative to the advantage of the Holsteins for production, herd-life and persistency.
The mean values of the BC cows were closer to the purebred Holstein than expected assuming complete additivity for the F-1 cows. Heterosis is generally defined as the difference between mean of the F-1 individuals and the midpoint of the parental strains. Since no purebred NRF cows were produced in Israel, it was not possible to directly estimate the heterosis effect. A negative aspect of crossbreeding in dairy cattle is that heterosis gains obtained in the F-1 generation are usually degraded in following generations. Under the assumption of positive heterosis for milk production traits, the F-1 mean production should have been higher than the midpoint between the two breeds. If heterosis is degraded in the BC generation, then the mean BC production should be closer to the F-1 than the purebred Holsteins. This effect was not found in the current study, although the BC cows were still lower than the purebred Holsteins for all three milk production traits.
Acknowledgments
This research was supported by a grant from the Israel Milk Marketing Board.
Supplementary Material
For supplementary material/s referred to in this article, please visit http://dx.doi.org/10.1017/S1751731116000239