INTRODUCTION
In the UK, sugar beet is sown in spring and harvested in autumn. Sugar-beet plants exposed to prolonged cold (<12 °C) become vernalized, a process that promotes bolting and, in long days (LDs), also flowering (Smit Reference Smit1983; Milford et al. Reference Milford, Jarvis and Walters2010). To combat bolting, sugar-beet breeders have been selecting against bolting and all varieties are developed to be biennials which bolt only after sufficient vernalization. Understanding and controlling bolting in sugar beet is an agricultural imperative: while synchronized bolting and flowering is necessary for quality seed production, bolters are undesirable in a sugar crop, and bolting-resistant varieties could be sown earlier in spring or even as autumn-sown beet for higher yields (Durrant et al. Reference Durrant, Mash and Jaggard1993; Jaggard & Werker Reference Jaggard and Werker1999; Jaggard et al. Reference Jaggard, Qi and Semenov2007, Reference Jaggard, Qi and Ober2009b; Milford Reference Milford and Draycott2007; Hoffmann & Kluge-Severin Reference Hoffmann and Kluge-Severin2010). Bolters are undesirable because they cause difficulties at harvest, decrease root yield and quality, and, if allowed to seed, create weed beet problems in subsequent crops (Jaggard et al. Reference Jaggard, Wickens, Webb and Scott1983).
The cool-day model (Jaggard et al. Reference Jaggard, Wickens, Webb and Scott1983) was the first predictive model for quantifying bolting risk in sugar-beet crops. It was based on the number of days when maximum daily temperature did not exceed 12 °C; it did not account for the variability in the vernalizing effect of different temperatures. Recently, a vernalization-intensity model was developed (Milford et al. Reference Milford, Jarvis and Walters2010), which addresses this limitation by assigning a weighting for vernalization effectiveness/intensity to each temperature below 12 °C. The model also describes vernalization in physiologically relevant ‘weighted hourly units of vernalization’ (vernalization hours) to account for the duration of vernalization treatment. Thus, using parameters for the duration and intensity of vernalization, the model estimates, for a particular variety, the threshold number of vernalization hours needed to induce bolting, i.e. the vernalization requirement (VR), and the subsequent rate of increase in bolting for each extra vernalizing hour experienced by the crop after the VR has been reached, i.e. bolting sensitivity (BS) (Milford et al. Reference Milford, Jarvis and Walters2010). Estimation of the VR and BS relies on availability of accurate local temperature records to enable calculation of a wide range of vernalization hours against which the bolting response of a given variety can be observed (Milford et al. Reference Milford, Jarvis and Walters2010). Given the rapid turnover of sugar-beet varieties, it may be uneconomic and impractical to parameterize the model for each one of them (Milford et al. Reference Milford, Jarvis and Walters2010). There remains, therefore, a need to establish quick and reliable methods of predicting bolting responses in various weather conditions, as tools for breeders and growers.
There is a complex interaction between photoperiod and vernalization under inductive LD photoperiod in sugar beet (Stout & Owen Reference Stout and Owen1958; Van Dijk Reference Van Dijk2009). Therefore, before the vernalization-intensity model can be used as a research tool, the VR and BS parameters should be reassessed in non-inductive short-day (SD) conditions. The present study set out to conduct precise measurements of vernalization intensity in SD and the effect of various vernalization treatments under controlled environment (CE) conditions to allow the establishment of the VR and BS for seven sugar-beet varieties: Roberta, Trinita, Saracen, Fiorenza, Sentinel, Annouschka and the breeding line C600 (USDA PI 520748; Lewellen Reference Lewellen1989).
Analysis of the molecular and genetic control of bolting in sugar beet has identified potential molecular targets for breeding bolting-resistant sugar beet (Jung & Mueller Reference Jung and Mueller2009; Mutasa-Göttgens et al. Reference Mutasa-Göttgens, Qi, Mathews, Thomas, Phillips and Hedden2009, Reference Mutasa-Göttgens, Qi, Zhang, Schulze-Buxloh, Jennings, Hohmann, Muller and Hedden2010; Pin et al. Reference Pin, Benlloch, Bonnet, Wremerth-Weich, Kraft, Gielen and Nilsson2010). It has been shown that in biennial beet, vernalization promotes the up-regulation of gibberellin (GA) biosynthesis in the shoot apex prior to bolting and flowering, whereas exogenous GA application induces bolting, but not flowering, in vernalized biennial plants in non-inductive SD (8 h light) (Mutasa-Göttgens et al. Reference Mutasa-Göttgens, Qi, Mathews, Thomas, Phillips and Hedden2009, Reference Mutasa-Göttgens, Qi, Zhang, Schulze-Buxloh, Jennings, Hohmann, Muller and Hedden2010). Genes in the GA-signalling pathway are therefore good candidate markers for vernalization response in sugar beet. Alternative targets include sugar beet FLOWERING LOCUS C-like1 (BvFL1) (Reeves et al. Reference Reeves, He, Schmitz, Amasino, Panella and Richards2007) and the antagonistic sugar-beet homologues of FLOWERING LOCUS T (FT): BvFT1 and BvFT2 (Pin et al. Reference Pin, Benlloch, Bonnet, Wremerth-Weich, Kraft, Gielen and Nilsson2010). To date, only BvFT1 has been more directly implicated in vernalization-dependent bolting and the molecular genetic control of bolting remains largely unresolved in sugar beet. This limits the applicability and benefit of the molecular advancements to sugar-beet breeding and cultivation. In the present paper, Roberta, the variety shown to have the highest VR, was used in experiments to assess the utility of candidate GA and flowering genes as molecular markers for the attainment of VR. Experiments were also set up to assess morphological changes in the shoot apical meristem (SAM) during vernalization.
Finally, temperature data recorded over the last 47 years at the Broom's Barn weather station were used to develop a predictive tool for vernalization hours based on sowing date. The application of this tool is discussed in the context of VR and associated implications for both sugar-beet growers and breeders. It is shown that VR variability provides superior genetic potential for breeding for bolting resistance, and that the addition of molecular genetic parameters can improve the utility of the vernalization-intensity model for sugar-beet breeders.
MATERIALS AND METHODS
Plants
C600 MB1 sibA plants were raised from seeds generated in-house from a sibling cross whose original biennial parent was propagated by single seed descent from a line that was segregating for VR. Genotype at the bolting locus (B gene) was confirmed using a polymerase chain reaction (PCR) marker as previously described by Mutasa-Göttgens et al. (Reference Mutasa-Göttgens, Qi, Zhang, Schulze-Buxloh, Jennings, Hohmann, Muller and Hedden2010). The original C600 lines were a kind gift from Bob Lewellen, (USDA ARS, Salinas, CA), and are closely related to the previously described C600 line, PI 520748 (Lewellen Reference Lewellen1989).
Roberta is our laboratory standard commercial variety, which in common with most commercial genotypes is a three-way hybrid and has an obligate requirement for vernalization. Although this is a legacy cultivar, it is representative of current European varieties; it is maintained and provided to us by Gunter Diener at KWS SAAT AG, Einbeck, Germany.
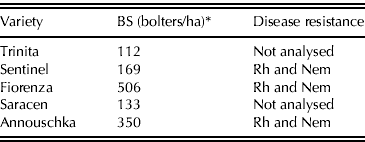
Seed lots of commercial varieties were supplied as a kind gift from Germains Seed Technology (King's Lynn, UK). They were selected for the present study based on their early spring sowing bolting scores as measured in the BBRO/NIAB (British Beet Research Organisation/National Institute of Agricultural Botany) recommended list variety trial for the 2009/10 UK season. Varieties with rhizomania (Rh) and nematode (Nem) disease resistance traits were also included to reflect the key breeding targets for UK growers. The selected varieties are listed in Table 1.
Varieties of sugar beet used in the present study with bolting score and disease resistance
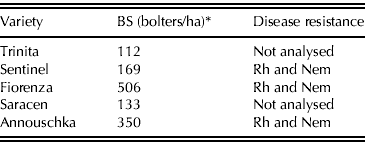
* Assumes 100000 plants/ha.
Plant culture
Plants were grown in a CE room under LD (16 h light) with lights from a mixture of incandescent bulbs and fluorescent tubes. Photosynthetically active radiation (PAR) was maintained at 300 μmol/m2/s at the canopy level and the temperature was 22±1 °C. Plants with 6–8 leaves were then transferred to an SD (8 h light) vernalization chamber set at 6 °C with 15–20 μmol/m2/s of PAR. Batches of 25 plants were randomly removed after 10, 12, 14, 16 and 18 weeks of vernalization and transferred to an SD, 15 °C CE room for 1 week. Following this thermal buffer period, which prevents devernalization (Mutasa-Göttgens et al. Reference Mutasa-Göttgens, Qi, Zhang, Schulze-Buxloh, Jennings, Hohmann, Muller and Hedden2010), plants were transferred to inductive LD in a 22 °C glasshouse situated at 52°16′ N 00°34′ E from December 2010 to April 2011. Supplementary artificial lighting was provided when light levels fell below 300 μmol/m2/s of PAR, as previously described in (Mutasa-Göttgens et al. Reference Mutasa-Göttgens, Qi, Mathews, Thomas, Phillips and Hedden2009). After 5 weeks in the glasshouse (in total 6 weeks post-vernalization treatment) the plants were scored for bolting by counting the total number of bolted plants. These data were used to determine VR. As required, leaf tissue samples were also taken for transcript analysis at this time.
Plant growth media, pest management and watering regimes were as previously described by Chia et al. (Reference Chia, Mueller, Jung and Mutasa-Göttgens2008) and Mutasa-Göttgens et al. (Reference Mutasa-Göttgens, Qi, Zhang, Schulze-Buxloh, Jennings, Hohmann, Muller and Hedden2010). In the glasshouse and CE chambers, temperature was monitored using U-type thermistors (Grant Instruments Ltd., Cambridge, UK) and light quality using the StellarNet EPP2000C-100 μm Spectrometer (Apogee Instruments, Logan, USA) with data logged at 10-min intervals.
Vernalization conditions
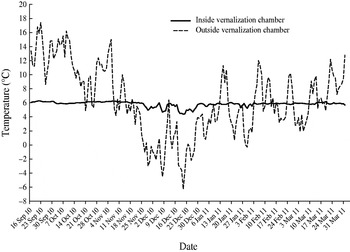
Temperatures in the vernalization chamber were averaged to hourly mean values for calculating the vernalization intensity index and into daily mean air temperatures for illustrating the conditions during the whole of the vernalization treatment (Fig. 1).
Comparison of daily mean temperatures inside the vernalization chamber and mean air temperature at Broom's Barn Research Centre Weather Station. The daily temperatures were calculated from measurements from four positions and logged at 10 min intervals in the vernalization chamber. The daily mean air temperature was taken from the weather station at Broom's Barn Research Centre less than 200 m from the vernalization chamber.

The daily mean temperature inside the vernalization chamber was close to 6 °C throughout the experimental period, only occasionally falling to between 4 and 5 °C when outside mean air temperature dropped well below zero (Fig. 1). In this CE, the accumulated vernalization intensity index varied by less than one weighted vernalization hour for the various durations of vernalization. The average weighted vernalization hours were calculated to be 198, 237, 276, 315 and 354 for the 10, 12, 14, 16 and 18 weeks of vernalization treatment, respectively.
Roberta vernalization time-course experiment
Roberta plants were grown and vernalized under the conditions as described above. Plants were sampled at regular periods across the complete time-course from pre-vernalization (week 0), during vernalization (weeks 1–18), while they were in the thermal buffer chamber (week 19) and through to bolting, 6 weeks post-vernalization (weeks 20–24).
Shoot apex and leaf tissue sampling
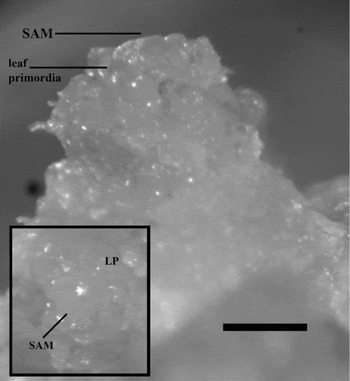
Tissues were sampled from ten randomly selected individual plants for each time point at 4 h after the lights were turned on following the dark ‘night’ period. This is zeitgeber time 4 (ZT4), where light is the environmental cue setting the circadian clock, with lights having been switched on at ZT0. Sampled tissues were infused immediately with RNALater buffer (Ambion, Paisley, UK). Leaf tissue was sampled from the fourth whorl of fully expanded leaves, with whorls being counted from the central unfurled leaves in the rosette of unbolted plants. On bolted plants, leaves were sampled from the fourth extended node from the rosette. Plant shoot tips were harvested and apices dissected under a stereomicroscope to enrich samples for the SAM tissues. Care was taken to remove as much leaf and vascular tissue as possible (see Fig. 2).
Representation of a typical shoot apex sample (week 24) as dissected for RNA extraction. The insert shows the dissected apex as viewed from above. SAM, shoot apical meristem; LP, leaf primordia; scale bar, 100 μm (colour online).

RNA extraction and quantitative real time (qRT)–PCR
After removal of RNALater buffer, total RNA was extracted using the Qiagen Plant RNAeasy Kit with the RLT buffer, DNAse treated and quality controlled for genomic DNA contamination as previously described by Chia et al. (Reference Chia, Mueller, Jung and Mutasa-Göttgens2008). First strand cDNA synthesis was as previously described by Chia et al. (Reference Chia, Mueller, Jung and Mutasa-Göttgens2008), except that the final cDNA was diluted 1/20 with sterile nuclease-free water. For qRT–PCR, 10 μl reactions were set up using the Brilliant II qRT–PCR SYBR® Green Low ROX Master Mix (Agilent Technologies UK Ltd., Cheshire, UK), with optimized gene-specific primers. All reactions were performed in triplicate (repeated once) in the Stratagene MX3000P RT–PCR machine (Agilent Technologies UK Ltd., Cheshire, UK) and the data were analysed with the accompanying Mx3000P v4.10 software (Agilent Technologies UK Ltd., Cheshire, UK) using the delta-CT method.
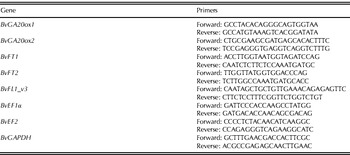
Target genes for expression analysis were the GA biosynthetic markers BvGIBBERELLIN 20-OXIDASE 1 (BvGA20ox1) (GenBank® DQ864510.1); BvGA20ox2 (unpublished but identical (1214/1219 (0·99), Gaps=3/1219; E-value=0) to GenBank® AJ422049.1); BvFT1 (GenBank® HM448910.1); BvFT2 (GenBank® HM448912.1) and BvFL1_v3 (GenBank® DQ189212.1); primer sequences were as shown in Table 2.
Primers used for quantitative RT–PCR analyses

Expression levels as determined by the Mx3000P software were normalized against three housekeeping genes, BvELONGATION FACTOR 1 α (BvEF1α), BvEF2 (GenBank® Z97178.1) and BvGLYCERALDEHYDE 3-PHOSPHATE DEHYDROGENASE (BvGAPDH), according to the geNORM method (Vandesompele et al. Reference Vandesompele, De Preter, Pattyn, Poppe, Van Roy, De Paepe and Speleman2002). Primers are shown in Table 2. A two-way analysis of variance (ANOVA) was carried out to test for significant differences between mean expression levels for different vernalization treatments. Pairwise multiple comparison of significantly different means was carried out using the Holm–Sidak method with overall significance set to P<0·05.
Tissue preparation for morphological studies
Dissected shoot apices were submerged immediately in HistoChoice Tissue Fixative (Sigma-Aldrich Company Ltd., Dorset, UK) in sterile Eppendorf tubes and kept on ice. Samples were then vacuum infiltrated for at least 2 h, or until tissues had sunk to the bottom of the tube, and kept on ice or at 4 °C overnight. The samples were then dehydrated in an ethanol series at 4 °C and wax-embedded under vacuum in a Leica TP1020 Semi-enclosed benchtop tissue processor (Leica, Peterborough, UK). Histoclear clearing agent and Paraplast-XTRA wax (both Sigma-Aldrich Company Ltd., Dorset, UK) were used in embedding. Embedded samples were then processed on a Shandon Histocentre wax station (Thermo-Fisher Scientific, Loughborough, UK) and set in 22×30×20 mm Peel-A-Way Embedding Moulds (Agar Scientific Ltd., Stansted, UK) and stored at 4 °C until required. Tissue sections (7 μm thick) were cut using a Leica RM 2135 microtome (Leica, Peterborough, UK) and mounted in sterile distilled water onto Superfrost Extra microscope slides (Thermo-Fisher Scientific). The sections were cleared in Histochoice Clearing agent (Sigma-Aldrich Company Ltd., Dorset, UK), washed with absolute ethanol, dried at 40 °C and stained in 0·01 toluidine blue for 2 min at 40 °C. Excess stain was then washed off with absolute ethanol before the sections were dried and visualized under Leica M165FC dissection microscope (Leica, Peterborough, UK). Photographs were taken with Leica DFC310FX camera and images processed with Leica Application Suite V3 software.
Calculating the vernalization intensity index
The vernalization intensity index was calculated as the accumulated number of hours weighted by vernalizing temperatures between 0 and 12 °C from sowing as previously described by Milford et al. (Reference Milford, Jarvis and Walters2010). The vernalizing temperature weighting is a critical exponential equation as follows:
 $${\rm VW} = -{\rm 1} {\cdot} {\rm 256} + \left( {{\rm 1} {\cdot} {\rm 26}0 + 0 {\cdot} {\rm 131} T} \right) \times 0 {\cdot} {\rm 9357}^{\rm T} $$
where VW is the vernalization weighting index and T is the temperature at a particular hour.
Estimation of the accumulated vernalization intensity, in the UK, on various dates in the spring and autumn/winter
To estimate the total number of vernalization hours that spring-sown sugar-beet plants are likely to have experienced if sown at different dates between 1 February and 16 April, the vernalization weighting equation described by Milford et al. (Reference Milford, Jarvis and Walters2010) was used. Hourly temperatures for each day between 1 January 1965 and 31 December 2011, 47 years inclusive, were estimated using temperature data from the weather station at Broom's Barn Research Centre (part of the official UK Meteorological Office network, situated in the main UK sugar-beet growing area) based on the sinusoidal equation:
 $$T = f\left( h \right) = T_{\rm m} + T_\alpha \;{\rm Sin}\left( {\pi \left( {h - h_x + {\rm 6}} \right)/{\rm 12}} \right)$$
where T is the hourly temperature, h the hour of the day, T m the mean daily temperature, T α the amplitude of the daily temperature (calculated as the difference between the maximum and minimum temperature) and h x is the hour at which T max (daily maximum temperature) occurs.
For winter crops, the same principle was applied except that the sowing date was assumed to be 31 August, with the accumulated vernalization hours calculated to the end of June in the following year. In this case, harvesting would normally be expected to start at least one year after the sowing date, in late summer/early autumn.
RESULTS
Vernalization intensity-based predictive tool for growers and breeders
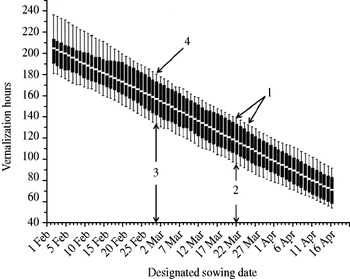
Based on temperature records from 1965 to 2011, the vernalization hours sugar-beet plants would reasonably be expected to experience, if sown on different dates between 1 February (a hypothetical early sowing date) and 16 April (the latest current spring sowing date), were estimated (Fig. 3). The assumption was made that a variety would be safe to use when there is a 0·05 chance (1 in 20 years) or less that weather conditions will satisfy its VR after sowing. Thus, a VR of 135–140 vernalization hours (Fig. 3 arrow 1), as in most current varieties, means that for the dates in March, sowing crops earlier than 22 March (Fig. 3, arrow 2) would result in 0·05 or greater chance of bolting, increasing to 0·5 around 12 March and rising to 0·95 or greater chance of bolting for a sowing date of 1 March (Fig. 3; arrow 3). This tool also enables the identification of target VRs necessary for safe sowing on any given date. Thus for the desired early March sowing dates, breeders would be required to provide varieties with a VR of at least 180 vernalization hours (Fig. 3; arrow 4) to ensure a low risk (⩽0·05 chance) of bolting.
Box-plots of the sum of weighted vernalization hours that sugar-beet crops would experience if sown between 1 February and 16 April. Daily temperature records from 1965 to 2011 obtained from the weather station at Broom's Barn Research Centre were used. Estimates of vernalization hours were based on application of the vernalization weighting formula derived by Milford et al. (Reference Milford, Jarvis and Walters2010). The bottom and top boundaries of the boxes indicate the 25th and 75th percentiles, a dot within the box marks the median, and bars above and below the boxes indicate the 95th and 5th percentiles. The arrows indicate the threshold VR range for current varieties (135–140 vernalization hours – arrow 1); the safest sowing date of 22 March (arrow 2) for current varieties; the March sowing date (arrow 3), with the highest (⩾0·95) risk of bolting for current varieties; together with an indication of the minimum VR target of 180 vernalization hours (arrow 4) required for a reduced bolting risk (⩽0·05) for 1 March sowing date.

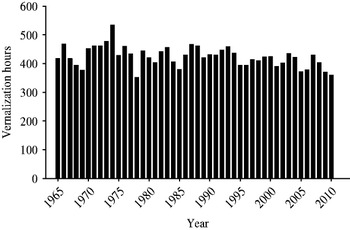
Alternatively, these weather data may also be used to calculate the total vernalization hours likely to have been experienced by autumn sown crops in any one of the years since 1965. As indicated in Fig. 4, such winter beet would have required a VR of at least 480 vernalization hours to escape the risk of bolting (⩽0·05) in all but one of the 47 years examined. Thus, it can be reasonably predicted that should such a winter variety ever become available, growers could expect that in c. 0·98 of the years, their crops should not bolt.
Accumulated vernalization hours that would have been experienced by autumn sown crops in the years from 1965 to 2011. Daily temperature records from 1965 to 2011 obtained from the weather station at Broom's Barn Research Centre were used in this analysis. Estimates of vernalization hours were based on application of the vernalization weighting formula derived by Milford et al. (Reference Milford, Jarvis and Walters2010) except that the sowing date was assumed to be 31 August, with the accumulated vernalization hours calculated to the end of June in the following year.

Genotypic variations in VR and BS
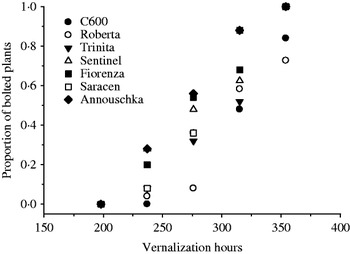
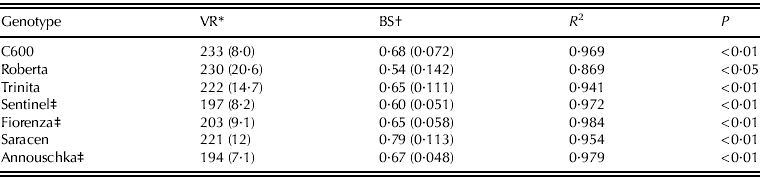
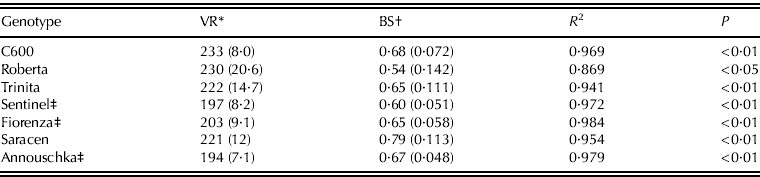
The observed proportions of plants that had bolted after the various vernalization hours for the seven varieties included in the present study are shown in Fig. 5. In all varieties, bolting started after the plants had received 198–237 vernalization hours, equivalent to 10–12 weeks of vernalization in the CE chamber. Only C600 and Roberta did not achieve complete bolting following the maximum treatment of 354 vernalization hours (18 weeks vernalization). The vernalization-intensity model was fitted to the bolting scores for each variety and the respective parameters of threshold VR and BS estimated (Table 3). The model was appropriate for modelling vernalization-induced bolting in all the varieties studied here: the model significantly (P<0·01) accounted for >0·9 of the variations in the bolting observations of each variety except Roberta, where it accounted for c. 0·87 of the variation (P<0·05).
Variation in proportions of bolted plants in relation to the weighted vernalization hours for seven sugar-beet varieties. Plants of each variety (in batches of 25) were subjected to the vernalization treatment for an average of 198, 237, 276, 315 and 354 vernalization hours and scored for bolting rate six weeks after the vernalization treatment. Accumulated vernalization hours were calculated using average hourly temperature values inside the vernalization chamber according to the method previously described by Milford et al. (Reference Milford, Jarvis and Walters2010).

Estimated threshold VR, BS and the proportion of variance accounted for (R2) by the estimated parameters in seven sugar-beet varieties
Values in brackets are standard errors of the mean.
* Vernalization hours required to induce bolting.
† Increase in bolting incidence for each extra vernalization hour once the VR has been satisfied.
‡ Genotypes including Rh and Nem resistance traits.
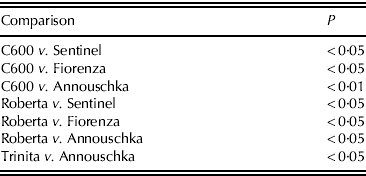
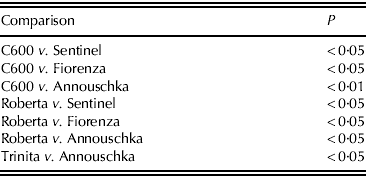
When genotypic differences in VR and BS were tested, the varieties differed significantly in VR but not in BS (Table 4). For example, Roberta and C600 had significantly (P<0·05) higher VRs than Annouschka, Fiorenza and Sentinel.
Results of pairwise comparison of the threshold VR in seven sugar-beet varieties, only varieties with significantly different VRs are shown
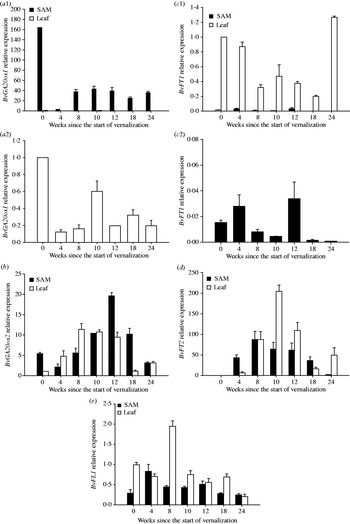
Effect of vernalization treatment on BvGA20ox1, BvGA20ox2, BvFT1 and BvFT2 gene expression
The relationship between changes in GA biosynthesis (as measured by BvGA20ox1 and BvGA20ox2 expression) in leaves and the shoot apex and accumulated vernalization was investigated in Roberta. The results showed that BvGA20ox1 expression in leaf and shoot apical tissues was generally reduced (P<0·05) by vernalization treatment (Figs 6a1, a2) and was lower than pre-vernalization levels when measured at week 24 (in bolted plants), 6 weeks after the end of the vernalization treatment. BvGA20ox1 expression in the shoot apex dropped after 4 weeks (79 vernalization hours) of vernalization treatment (Fig. 6a1) then rose to a constant level below that measured in unvernalized apices (week 0 time point; Fig. 6a1) for the rest of the time points, including bolted plants at week 24. In leaves, BvGA20ox1 expression was much lower than in the shoot apex (Fig. 6a2 – magnified scale relative to Fig. 6a1); and was lowest for weeks 4, 8 and 12 of vernalization treatment (79, 157 and 237 vernalization hours, respectively) and highest in week 10 (198 vernalization hours), although still lower than the pre-vernalization level. In contrast, BvGA20ox2 expression was significantly up-regulated (P<0·05) by vernalization in both leaf and shoot apical tissues, peaking in samples taken around the time when the plants were expected to have attained VR (Fig. 6b). At the shoot apex, after an initial dip at week 4, BvGA20ox2 expression increased gradually and reached a maximum of four-fold week 0 levels at week 12, only dropping to pre-vernalization levels at week 24 in bolted plants, which had been at high non-vernalizing temperatures in LDs (16 h light) (Fig. 6b). In leaves, BvGA20ox2 expression increased at week 4 and peaked at the same level in week 8, 10 and 12 samples, at ten-fold pre-vernalization (week 0) levels. Expression levels were reduced to pre-vernalization levels by the end of the vernalization treatment at week 18 and rose again by about two-fold at week 24 (Fig. 6b).
Gene expression profiles for BvGA20ox1, BvGA20ox2, BvFT1, BvFT2 and BvFL1 in Roberta leaf and shoot apical tissues before, during and after vernalization. (a1) BvGA20ox1 expression in leaf and shoot apical tissues; (a2) Scale magnification of BvGA20ox1 expression in leaf tissues; (b) BvGA20ox2 expression in leaf and shoot apical tissues; (c1) BvFT1 expression in leaf and shoot apical tissues; (c2) Scale magnification of BvFT1 expression in shoot apical tissues; (d) BvFT2 expression in leaf and shoot apical tissues; (e) BvFL1_v3 expression in leaf and shoot apical tissues. Expression is presented relative to the non-vernalized (week 0) samples and significant differences in expression level were by pairwise comparison at P<0·05.

Expression of the bolting repressor BvFT1 is known to be reduced in vernalized sugar beet (Pin et al. Reference Pin, Benlloch, Bonnet, Wremerth-Weich, Kraft, Gielen and Nilsson2010). The present study showed that BvFT1 is significantly reduced in leaves as vernalization progresses, from week 8 to the end of vernalization (week 18), but returns to pre-vernalization levels six weeks after vernalization (week 24) (Fig. 6c1). At the shoot apex, BvFT1 expression was much lower and only just detectable compared with the levels in the leaves (Fig. 6c1). Although expression of BvFT1 in shoot apices was very low, it was nevertheless significantly reduced in plants vernalized for 18 weeks, compared with untreated plants and, in contrast with leaf tissues, it remained low post-vernalization treatment in plants at week 24 (magnified scale Fig. 6c2).
Interestingly, a reduction in BvFT1 expression in apices was first observed in plants after 8 and 10 weeks of vernalization (Fig. 6c2), the period when plants would be expected to attain VR. The floral promoter BvFT2, as identified by Pin et al. (Reference Pin, Benlloch, Bonnet, Wremerth-Weich, Kraft, Gielen and Nilsson2010), was up-regulated by vernalization in both leaf and shoot apical tissues. In the apex, expression was higher than in non-vernalized samples (week 0) throughout vernalization and although the expression level at week 8 was significantly higher than at weeks 4 and 18, there was no difference in expression levels at weeks 8–12 (Fig. 6d). The expression level of BvFT2 in shoot apices at 6 weeks post-vernalization (week 24) was again very low and at pre-vernalization levels (Fig. 6d). In leaves, BvFT2 expression levels in all vernalized samples were higher than in untreated samples (week 0), with the highest expression at week 10 (Fig. 6d). Expression at week 24 remained higher than in the unvernalized plants (week 0; Fig. 6d).
In the current analysis, BvFL1 did not show a vernalization-responsive expression pattern (Fig. 6e). Except for a brief significant rise (P<0·05) at week 4 in shoot apices and week 8 in leaves, expression was similar to week 0 levels in both tissues. These results are at odds with the interpretation of Reeves et al. (Reference Reeves, He, Schmitz, Amasino, Panella and Richards2007), although the data are in agreement by showing the down-regulation of BvFL1 in leaves 6 weeks after the end of vernalization.
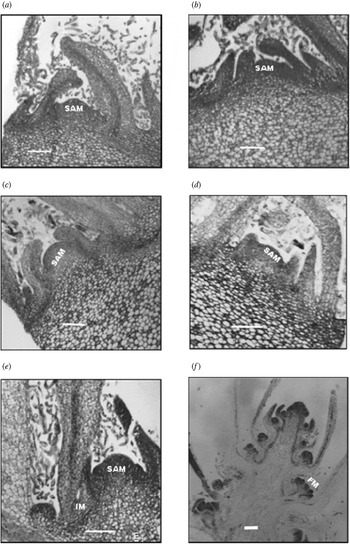
Morphological analysis
To ascertain whether morphological changes associated with the developmental transition to reproductive growth at the SAM occurred during vernalization treatment, longitudinal sections of the shoot apex were assembled from samples taken during the vernalization time course (Fig. 7). No significant morphological changes were observed during vernalization: while the apical meristem diameter ranged from 120 to 180 μm, this did not appear to be associated with the amount of vernalization, and the shape was invariable (Fig. 7a–d). At week 24, axillary inflorescence meristem initials appeared in the axils of the older leaves (Fig. 7e). Two weeks later, the SAM appeared dome-shaped and its base was higher than the leaf attachment points, suggestive of the beginning of bolting, and all leaves had prominent axillary inflorescence meristems in their axils (Fig. 7f).
Longitudinal sections through sugar-beet SAMs before, during and after vernalization in the Roberta variety. (a) Before vernalization (week 0). (b) After 6 weeks of exposure to vernalizing temperatures. (c) After 12 weeks of exposure to vernalizing temperatures; (d) After 18 weeks of exposure to vernalizing temperatures. (e) Week 24, 6 weeks after the end of 18 weeks of exposure to vernalizing temperatures. (f) Week 26, 8 weeks after the end of 18 weeks of exposure to vernalizing temperatures. SAM, shoot apical meristem; IM, inflorescence meristem; FM, floral meristem; scale bar, 100 μm.

DISCUSSION
Informing breeding selection and agronomic practice
The current trend in the UK is for sowing sugar-beet crops earlier in the spring, with target dates in March being the most favoured. The present study is aimed to use vernalization intensity and VR data to develop tools that can assist growers to evaluate the potential risk of bolting and to advise breeders on appropriate VR targets for given sowing dates. Similar approaches, involving the mathematical modelling of sugar-beet yield and physiological response to fertilizer application, have been used to propose and evaluate agronomic advice (Milford et al. Reference Milford, Jarvis, Jones and Barraclough2008; Jaggard et al. Reference Jaggard, Qi and Armstrong2009a). It was possible to use the vernalization-intensity model of Milford et al. (Reference Milford, Jarvis and Walters2010) to describe the vernalization-induced bolting response of the seven varieties studied in this paper. On average, the model's predictions explained >0·95 of the variation in bolting data (P<0·05) for all the varieties. This was an improvement of 0·15 from the average of comparable statistics reported by Milford et al. (Reference Milford, Jarvis and Walters2010). The improvement is probably linked to more accurate temperature measurements in the present study, as opposed to Milford et al. (Reference Milford, Jarvis and Walters2010) who used diurnal hourly temperature estimated from daily maximum and minimum temperature records from the weather stations closest to the trials. Furthermore, in this study, plants were vernalized under lower light intensity and shorter photoperiod (8 h light), compared with field trials, which minimized bolting promotion by photoperiod and high light intensity. Reducing such confounding effects from light should allow for more accurate modelling of the relationship between vernalization intensity and bolting.
The seven varieties studied in this paper had threshold VRs ranging from 194·4 (Annouschka) to 233·2 (C600) vernalization hours; Roberta and C600 had significantly higher requirements than Annouschka, Fiorenza and Sentinel. The bolting sensitivities were estimated to be between 0·543 (Roberta) and 0·792 (Saracen) for the seven varieties, but the differences between them were not significant. This suggests that VR can be a breeding target in developing bolting resistant beet varieties. For sugar production, all bolters are undesirable so the use of varieties with a VR greater than that which can be experienced in the field is a prerequisite. The difficulty for conventional breeding strategies is that bolting resistance in elite varieties is compromised when new traits are incorporated, as observed in the present study for varieties such as Fiorenza, Sentinel and Annouschka with Rh and Nem disease resistance.
The mean threshold VR for nine of the most recent varieties tested by Milford et al. (Reference Milford, Jarvis and Walters2010) is c. 135 vernalization hours, whereas the average VR for the seven varieties in this study is 214. Thus, the estimated VR under the conditions described in this paper was c. 0·58 higher than that estimated under field conditions. This difference in VR probably reflects the separation of vernalization and photoperiod effects on bolting induction achieved in the present study where plants were vernalized in SD. Since Milford et al. (Reference Milford, Jarvis and Walters2010) used bolting observations from field-grown beet the effect of vernalization was probably enhanced by the bright LD conditions.
In the present experiments, two varieties (Roberta and C600) did not reach complete bolting even after exposure to 354 vernalization hours. This variability in bolting susceptibility within sugar-beet siblings reflects the fact that plants are naturally out-breeding and varieties are generally derived from three-way hybrids. Clearly, in the current germplasm, there exists the genetic capacity to develop bolting-resistant varieties that could be sown earlier than the current (late March) sowing dates (Jaggard et al. Reference Jaggard, Qi and Semenov2007). This genetic potential presents an avenue for advancement in VR through conventional breeding which, unlike genetic modification (GM) approaches suggested by, for example, Pin et al. (Reference Pin, Benlloch, Bonnet, Wremerth-Weich, Kraft, Gielen and Nilsson2010), are likely to target the multiple genes involved in controlling this quantitative trait (Sadeghian et al. Reference Sadeghian, Johansson and Lexander1993).
Molecular parameters for the beet vernalization-intensity model
It was found that the expression of BvFL1 in shoot apices was barely responsive to vernalization and its expression levels remained virtually the same before and at the end of vernalization treatment. There are three splice variants of BvFL1 in sugar beet and the variant assessed in this paper is the same (BvFL1_v3) as that reported on by Reeves et al. (Reference Reeves, He, Schmitz, Amasino, Panella and Richards2007). A possible explanation for the discrepancy in results may be the differences in the exact tissue types and/or sampling times; for example, it is not clear which leaves Reeves et al. (Reference Reeves, He, Schmitz, Amasino, Panella and Richards2007) used in their analyses or at what ZT they took their samples.
While in this study BvFT1 expression was suppressed in leaves during vernalization, as previously reported by Pin et al. (Reference Pin, Benlloch, Bonnet, Wremerth-Weich, Kraft, Gielen and Nilsson2010), this suppression was reversed, and expression returned to pre-vernalization levels when, after the end of vernalization treatment, the plants were transferred to higher temperatures and LD conditions. This could be because not all Roberta plants went on to bolt after 18 weeks vernalization (only 0·7 bolted; Fig. 5) and it was not possible to devise a sampling protocol which could readily account for this. However, it was found that vernalized bolting plants had barely detectable levels of BvFT1 (data not shown). In general, BvFT1 expression in the apices was extremely low compared with leaves. Nevertheless, despite some fluctuation during vernalization treatment, in apical tissues expression was down-regulated in vernalized plants and was stably suppressed 6 weeks after the end of vernalization in plants in LD conditions. Conversely, BvFT2 expression in leaves peaked during the 10th week of vernalization, when plants were expected to have attained VR. Although expression levels reduced towards the end of the vernalization treatment at 18 weeks, they were above pre-vernalization levels. This high level was maintained long after the end of vernalization at week 24. Curiously, in the apices, BvFT2 was barely detectable in pre- and post-vernalization samples and only up-regulated to a consistent level during the vernalization treatment. These findings are, to the best of our knowledge, the first on the expression of BvFT2 in leaves and shoot apices during vernalization, and its association with VR.
The expression patterns of BvGA20ox1 and BvGA20ox2 revealed that while BvGA20ox2 expression peaked in both leaf and shoot apical tissues around the time when plants would have reached VR, BvGA20ox1 expression did not appear to change in response to vernalization. This observation is in agreement with what has been reported from Northern analysis for BvGA20ox1, where expression was found to increase substantially only after vernalized plants were transferred to inductive LD (Debenham Reference Debenham1999; Mutasa-Göttgens et al. Reference Mutasa-Göttgens, Qi, Mathews, Thomas, Phillips and Hedden2009). Thus, although the present results for BvGA20ox2 revealed a gene expression pattern during vernalization that would suggest promotion of bolting, morphological changes indicative of bolting initiation were not evident at the SAM until 8 weeks after the end of vernalization. The possibility that transcriptional up-regulation of BvGA20ox2 may not lead to increased bioactive GA content is supported by the findings of Debenham (Reference Debenham1999), which showed that a significant increase in GA content at the shoot apex in sugar beet was only recorded after vernalized plants were transferred to LD. This could explain why no changes in meristem morphology were observed in this study during the course of vernalization treatment. Therefore, it may not be possible to assess the attainment of VR through morphological analysis of the SAM. That BvGA20ox paralogues other than the two examined in this paper may be responsible for the GA upsurge that is associated with bolting and flowering in LD cannot be ruled out. Notwithstanding its developmental effect, the expression levels of BvGA20ox2 appear to peak upon attainment of the VR in sugar beet and may therefore provide a suitable molecular marker.
Modelling the way to bolting resistant beet varieties
Current sugar-beet germplasm varies in bolting susceptibility, which can be detected through careful application of the vernalization-intensity model: varieties differ significantly in VR. This variability can be used together with weather data for a specific location to predict varietal bolting response given different sowing dates. The genetic capacity for sugar beet to withstand the vernalization intensity conferred by sowing dates in February in England has long been recognized (Jaggard et al. Reference Jaggard, Wickens, Webb and Scott1983). This has, however, remained largely intractable due to the lack of appropriate selection tools and protocols for breeders. VR now provides a suitable breeding target and it is expected that increasing VR to at least 180 vernalization hours would allow safe early spring sowing from 1 March, as currently desired by the UK beet industry. To achieve this, molecular markers are beginning to be identified that could be developed to substitute for the costly and time-consuming experiments required to characterize varietal VR and bolting response. In at least one variety, Roberta, the expression patterns of BvGA20ox2 and BvFT2 in leaf and SAM tissues during vernalization peak at a time when plants have reached the threshold VR. If confirmed in other varieties, this association between vernalization-intensity accumulation and transcriptional regulation of genes with key roles in vernalization could be adapted as a selection tool to develop bolting-resistant varieties for early spring and/or autumn sown sugar-beet crops. The molecular analysis in leaf samples taken from growing plants as they are being vernalized would allow the discard of genotypes, which show an earlier than desired vernalization induced up-regulation of BvGA20ox2 or BvFT2 without growing them longer than necessary.
In conclusion, the present work illustrates the successful application of the vernalization-intensity model (Milford et al. Reference Milford, Jarvis and Walters2010) to describe and discriminate the vernalization response of seven sugar-beet varieties based on CE experiments. The findings indicate that these beet varieties can be distinguished by their VR but not BS. The developmental analyses demonstrated that while the expression levels of BvFT2 and BvGA20ox2 peak at a time when Roberta plants would have reached VR, no morphological changes at the SAM correlate with these molecular changes. The present study considerably improves the understanding of vernalization perception and response in sugar beet by illustrating genotypic variation in VR, which can be differentiated molecularly to facilitate the development of bolting resistant varieties. It has also demonstrated and quantified the genetic capacity for improving bolting resistance in the cultivar Roberta and the breeding line C600. The target VR for varieties suitable for early sowing dates in February and March in the UK was benchmarked and likely exists in some of the varieties tested. An indication of realistic VR targets for autumn crops was also presented. Importantly, the present study provides, for the first time, markers to integrate molecular genetic parameters with the vernalization-intensity model and adds significantly to the knowledge of vernalization processes that lead to bolting and flowering in sugar beet. Tools to improve the precision of modelling to facilitate beet breeding and cultivation are proposed.
Broom's Barn receives financial support from the UK beet industry, administered through the British Beet Research Organisation (http://www.bbro.co.uk/). Rothamsted Research receives grant-aided support from the Biotechnology and Biological Sciences Research Council of the United Kingdom (http://www.bbsrc.ac.uk/). Helen Holmes is jointly funded by NFU Sugar, The Chadacre Agricultural Trust and The Felix Thornley Cobbold Agricultural Trust. We thank Dr Antonis Giakountis at Cambridge University, Department of Plant Sciences for invaluable technical advice and help with tissue fixing and sectioning; Kevin Sawford at Broom's Barn for assistance with culture and maintenance of plants in the glasshouse and controlled environment rooms and Professor Keith Jaggard, independent agronomy consultant, formally at Broom's Barn for critical review of the manuscript.