

The governing capacity of a government depends largely upon how effectively the government can have its policies enacted in the parliament (Field Reference Field2016). In this line of inquiry pundits have highlighted the role of legislative organization. Legislative organization defines the way in which a legislative branch is organized and the legislative business is arranged. It consists of the system of authority, legislative procedures and other structural features that determine the allocation of legislative authority and policymaking rights within a parliament (Cox Reference Cox, Weingast and Wittman2006; Hedlund Reference Hedlund, Loewenberg, Patterson and Jewell1984; Hedlund and Freeman Reference Hedlund and Freeman1981; Hicken and Stoll Reference Hicken and Stoll2017; Krehbiel Reference Krehbiel1991). With centralized legislative organization the privileged legislative actors (hereafter, PLAs), which often include the government and/or the majority party, may prioritize selected bills that are in their favour, saving the cost incurred in maintaining a high level of internal voting cohesion and thereby hold sway in the legislative arena (Cox and McCubbins Reference Cox and McCubbins2005).Footnote 1 By contrast, decentralized legislative organization levels all legislative actors’ capacity to enact legislation, reducing the legislative advantage that the PLAs may otherwise enjoy (Mattson Reference Mattson and Döring1995; Rasch Reference Rasch, Rasch and Tsebelis2011).
Given the merits of centralized legislative organization, a growing body of theories and empirics suggest that democratic legislatures tend to evolve from a decentralized plenary to a centralized legislative body in order to enhance overall policymaking performance and the legislative capacity of the PLAs (Cox Reference Cox, Weingast and Wittman2006; Figueiredo and Limongi Reference Figueiredo and Limongi2000; Nalepa Reference Nalepa2016; Zucchini Reference Zucchini, Rasch and Tsebelis2011). While cases of legislative centralization have received substantial scholarly attention, relatively few efforts have zeroed in on why the decentralization of legislative organization would take place if it only impairs overall and PLAs’ policymaking performance.Footnote 2 Since the level of legislative (de)centralization varies across democracies (Hicken and Stoll Reference Hicken and Stoll2017), such lack of studies is an important piece of the puzzle which we need to complete our understanding of policymaking performance around the world.
In this study we investigate the evolution of legislative organization and policymaking performance in Taiwan. Taiwan deserves special attention for two reasons. First, Taiwan was an authoritarian regime with a nominally democratic parliament. When Taiwan's parliament, also known as the Legislative Yuan (LY), started to function, it was not in the chaotic ‘state of nature’ that Gary Cox (Reference Cox, Weingast and Wittman2006) has hypothesized. Rather, the legislative authority was centralized under authoritarianism. Since the first full Legislative Yuan election in 1992, however, overall policymaking performance has revealed several textbook syndromes of decentralized legislative organization. In particular, without any privilege to prioritize its agenda, the government has to compete for scarce parliamentary time with parties and individual legislators, and its bills are not institutionally shielded from amendments or motions that defer legislative progress. Overall, Taiwan's government has only enacted 43% of its bills from 1993 to 2012.Footnote 3 The majority party had once been less successful than the minority party in enacting its bills. Such performance may baffle pundits who have learned from comparative studies that many democratic governments are able to enact at least 70% of its legislative bills (Brunner Reference Brunner2013; Tsebelis Reference Tsebelis1995). The uniquely low chance of enactment might look even more puzzling to comparativists who are familiar with Arend Lijphart's (Reference Lijphart1999) majoritarian-consensus framework and George Tsebelis's (Reference Tsebelis1995) theory of veto players. Taiwan is arguably a majoritarian democracy with at most two veto players given its one-party government, non-federal system and averaging fewer than three effective parties in a unicameral parliament. Its policymaking performance, however, has looked like one in a consensus democracy with numerous veto players. An investigation into the legislative decentralization in Taiwan may offer valuable empirical implications that advance our understanding of the policymaking difficulties facing governments in young democracies beyond the existing theories of comparative political institutions.
Second, from 1993 to 1998 Taiwan's LY was nearly paralysed and the government struggled legislatively. Oddly enough, the PLAs took the lead in carrying out parliamentary reform that further decentralized legislative organization in 1999. This unconventional evolutionary path for legislative organization begs the question of why politicians would opt for legislative decentralization amid legislative stalemate. Given that similar legislative decentralization also occurred in South Korea in 2012 (Frank et al. Reference Frank, Hoare, Köllner and Pares2013: 29; Kim and Kim Reference Kim and Kim2016), research on Taiwan's experience may offer a novel theoretical lens and empirical implications that help us approach legislative decentralization in other democracies.Footnote 4
We argue that the evolution of legislative organization is not context-free and that conventional views have overlooked the utility of legislative decentralization. During the transition to democracy the government may experience mounting challenges in the parliament in the wake of vast political changes and power struggles, where it would be contextually unfeasible to centralize legislative organization. In these circumstances, legislative decentralization can be a strategy of inclusion that helps lessen legislative obstruction by granting the PLAs’ opponents with more policymaking rights. Of course, decentralizing the legislative organization keeps the PLAs from having the legislative pre-eminence that comes along with centralized legislative organization. However, that legislative pre-eminence is a luxury from the standpoint of the PLAs in times of severe legislative stalemate. In the same way as a very thirsty person might drink poison, decentralizing the legislative organization is a contextually optimal option that politicians would rather take to overcome immediate legislative hurdles at the expense of long-term policymaking performance.
We collect and analyse the information of over 13,000 legislative bills proposed in the LY from 1993 to 2012. We first show that the transition of legislative organization has resulted in highly decentralized legislative organization, ultimately leading to a heavy legislative workload, piecemeal legislation and a low chance of legislative success. We specifically test the effects of the 1999 legislative decentralization. Evidence indicates that this very legislative decentralization slightly revived the legislative performance for the government and the majority party. However, the resulting highly decentralized legislative organization has levelled the legislative advantage the PLAs had over their opponents in Taiwan.
This research offers a theoretical framework that takes into account the political context and the reference point upon which politicians base their decisions to change the legislative rules. It also empirically demonstrates the utility of legislative decentralization. Our findings provide one explanation as to why legislative decentralization might take place. Moreover, Taiwan's experience implies that the existing theories of comparative political institutions may not fully account for policymaking performance in a democracy if the within-parliament legislative rules are left out of consideration.
Conventional views
Legislative outcomes are not simply shaped by the preferences of parties and legislators; they are also induced by the structures embedded in the legislatures (Shepsle and Weingast Reference Shepsle and Weingast1981). Decentralized legislative organization features fragmented decision-making responsibilities, multiple access points for influence on policymaking and increasing democratization within the legislature (Hedlund Reference Hedlund, Loewenberg, Patterson and Jewell1984), rendering legislative authority and parliamentary rights widely scattered. In particular, when individual legislators possess plenty of rights to influence policymaking, there can be ‘an underproduction of highly aggregated collective-benefit bills and an overproduction of many petty bills of a regional or narrow sectional special-benefits character’ (Döring Reference Döring1993: 7). As such, piecemeal and narrow-range proposals may constitute the majority of all bills (Cox Reference Cox, Weingast and Wittman2006; Hedlund Reference Hedlund, Loewenberg, Patterson and Jewell1984). Since ‘plenary time is the sine qua non of legislation’ (Cox and McCubbins Reference Cox and McCubbins2005: 10), processing numerous trivial revisions consumes parliamentary time and law-making efforts that could be otherwise devoted to urgent and critical national problems. The overloaded legislative agenda, scattered legislative rights and power-sharing arrangements may jointly increase the chances of legislative bills being deferred or blocked. By extension, decentralized legislative organization is often associated with a small chance of legislative success (Hedlund Reference Hedlund, Loewenberg, Patterson and Jewell1984; Hedlund and Freeman Reference Hedlund and Freeman1981).
By contrast, centralized legislative organization exclusively grants the legislative rights to one or a few privileged individuals or groups (Strøm Reference Strøm1998). In general, centralized legislative organization prevents a heavy legislative workload and the bottleneck problem. In particular, it benefits the PLAs in enhancing the likelihood that they can enact their policies. Even in parliamentary democracies that are characterized by the fusion of executive and legislative powers, central to the legislative capacity of a government is the extent to which the government or governing party can exclusively possess access to parliamentary time and suppress the rights of other parties and individual legislators (Cox Reference Cox1987; Cox and McCubbins Reference Cox and McCubbins2005; Mattson Reference Mattson and Döring1995). This is partly because constraining individual legislators’ rights to introduce bills and keeping private bills off the legislative agenda are equivalent to prioritizing government-sponsored legislation. Furthermore, the centralized formal legislative power helps the privileged governing or majority party to set the agenda in its favour, saving the transaction and mobilization costs incurred in maintaining its intra-party voting cohesion (Cox and McCubbins Reference Cox and McCubbins2005). When the government is instead not privileged in setting the parliamentary agenda, it can be institutionally weak in the legislative arena, even in a parliamentary democracy (Rasch Reference Rasch, Rasch and Tsebelis2011).
Given the downsides of decentralized legislative organization and the merits of centralized legislative organization, democratic parliaments, especially those experiencing legislative inaction, tend to improve their policymaking performance by centralizing legislative organization. Cox (Reference Cox, Weingast and Wittman2006) proposes a hypothetical model explaining why a legislature may evolve from a plenary meeting to a centralized legislative body. In his model the initial status of a legislature resembles the state of nature in which each legislator has an equal right to influence policymaking, leading to a bottleneck problem that prevents decisive legislative actions. Aiming to improve legislative performance, the parliament may create some inequality between legislators and curb individual legislators’ rights, making legislative authority centralized. Empirically, legislative centralization is not simply driven by the concerns with institutional performance, but also by the PLAs’ motives to carry out their policymaking goals. Sarah Binder (Reference Binder1996) finds that the legislative rules in the US Congress have been changed to suppress minority rights when the majority party encountered legislative obstruction. Eric Schickler (Reference Schickler2001) thoroughly examines the multiple interests involved with each institutional innovation within the US Congress. While the institutional developments have been disjointed and path-dependent, the majority party has benefited legislatively from the centralization of legislative organization. It has also been documented that the parliamentary governments in Britain (Cox Reference Cox1987), Italy (Zucchini Reference Zucchini, Rasch and Tsebelis2011) and Spain (Field Reference Field2016) have increased their legislative capacity by centralizing legislative authority in the hands of the PLAs. Similarly, examples beyond advanced democracies lend support to the merit of legislative centralization. The Brazilian government enjoyed a comfortable legislative success after 1988 when the rules were designed in favour of the government and the leadership of large parties (Figueiredo and Limongi Reference Figueiredo and Limongi2000). In Poland, although legislative organization had been established to break up the parties’ control over individual MPs during the democratic transition, the PLAs managed to reform the legislative rules so that an organized majority party and the government could utilize the speaker's power to ensure their legislative success (Nalepa Reference Nalepa2016).
To sum up, the centralization of legislative organization helps improve policymaking performance and enables the PLAs to hold sway in the legislative process, while legislative decentralization allegedly leads to unfavourable policymaking consequences and a lower legislative capacity of the otherwise privileged actors. Empirically, legislative centralization has been adopted to improve the legislative capacity of the PLAs in many democracies. Yet, little work has focused on reasons for the creation of decentralized legislative organization. Although the parliamentary minority would acquire more rights and powers (Binder Reference Binder1996; Schickler Reference Schickler2001), it remains unclear why the PLAs as vested interest holders would reduce their institutional advantage if doing so only leads to worsened consequences for themselves.
Rethinking legislative decentralization and its policymaking consequences
‘Legislatures institutionalise conflicts’ (Olson Reference Olson1994: 7) and legislative inaction may result from a failure to devise adequate legislative rules and procedures through which legislative actors may effectively resolve the conflicts among them. Legislative centralization and decentralization can be conceptualized as two conflict resolution strategies often seen in studies of politics. To centralize the legislative organization, as a strategy of exclusion, is to establish one central authority and exclude other voices from the decision-making process. In contrast, legislative decentralization can be viewed as a strategy of inclusion that aims to resolve conflicts by co-opting a broad range of actors into the decision-making process. With certain power-sharing arrangements, the actors would like to cease fighting each other and make decisions collectively.
To be sure, while we are in line with the conventional wisdom regarding the downsides of legislative decentralization, we emphasize a utility of legislative decentralization that has received much less scholarly attention. Comparativists have studied various institutional arrangements that purposely include various groups of elites in the political system. Well-known examples are consociational or consensus democracies (Lijphart Reference Lijphart1969, Reference Lijphart1999), nominally democratic institutions in authoritarian regimes (Malesky and Schuler Reference Malesky and Schuler2010; Wright Reference Wright2008), proportional ethnic group participation and minority vetoes (Horowitz Reference Horowitz2014; McCulloch Reference McCulloch2018). Intuitively, by sharing powers with the opponents, these institutional arrangements may reduce conflicts, stabilize society and avoid the cost of repression. Likewise, legislative decentralization, as a strategy of inclusion, may abate antagonism and increase harmony within a parliament. With more policymaking rights and powers, the PLAs’ antagonists might be willing to give up obstructive actions.Footnote 5 Of course, the PLAs may also lose the power to ride roughshod over their opponents. However, better than a paralysed parliament where little can be done, legislative decentralization allows the PLAs to make progress on legislation as the stuck legislative wheel starts moving.
Since no political decision can be made in a vacuum, rational actors take actions that are optimal in a given political context rather than ones that return the most desired payoffs. Legislative decentralization is not the first-best solution for the PLAs to improve their policymaking performance. It may, however, quench the PLAs’ thirst for legislative progress when centralization is not feasible. In newborn democracies transitioned from authoritarianism with a nominally democratic parliament, the governing party might struggle legislatively given the rising opposition force from both inside and outside the party at the onset of democratization (Casar Reference Casar, Morgenstern and Nacif2002; Figueiredo and Limongi Reference Figueiredo and Limongi2000; Nalepa Reference Nalepa2016). For the governing party to centralize the legislative authority, it requires a certain level of party capacity, in terms of seat share, internal cohesion or both (Binder Reference Binder1996; Nalepa Reference Nalepa2016), which often diminishes as democratization develops. When the governing party lacks such a capacity, and when the government's legislative performance is miserable due to severe antagonistic legislative obstruction, having legislative dominance through centralizing the legislative organization is nothing but a vain hope. Giving out legislative powers in exchange for less obstruction is rather optimal, as the smoothed legislative process allows all legislative actors, including the PLAs, to enact more pieces of legislation. From the standpoint of the opposition parties, a paralysed parliament with poor legislative productivity is not desirable. Like all parties, the opposition parties need to carry out policy platforms in order to maintain or enhance their parties’ reputation (Cox and McCubbins Reference Cox and McCubbins1993; Lebo et al. Reference Lebo, McGlynn and Koger2007). Contributions to making policies which are desired by the voters then allow the legislative actors to claim credit in the next election. Causing legislative obstruction is the means through which the opposing parties and legislators may force the PLAs to the negotiating table so that their policy preferences will be in part included in the enacted laws. However, when the parliament is paralysed, numerous items of the floor agenda waiting in the queue, including undisputed ones, can be buried together. Being a troublemaker may thus incur reputational cost as the public will loathe a chaotic, ineffective and inefficient parliament (Hibbing and Theiss-Morse Reference Hibbing and Theiss-Morse1995; Mishler and Rose Reference Mishler and Rose1994; Sheng and Huang Reference Sheng and Huang2006), so is not an optimal course for the PLA's opponents as compared with using institutional rights to influence the legislative outcomes legitimately. Accordingly, when the opposing forces are co-opted into the decision-making process, the conflicts can be limited, institutionalized and less harmful (Tsai Reference Tsai2009). By all accounts, while legislative decentralization might lead to unfavourable consequences from a long-term perspective, it may serve as a band-aid solution for the PLAs to grease the otherwise stuck wheels of policymaking.
Research methods
This research empirically examines policymaking implications derived from the legislative decentralization in Taiwan. We collected the official records of all 13,017 legislative bills between 1993 and 2012 from the Parliamentary Library of the Legislative Yuan (2015).Footnote 6 Our first step is to describe the historical pattern of policymaking performance in Taiwan. In order to reveal the characteristics of decentralized legislative organization, we collected indicators that are frequently emphasized in studies of legislative organization, such as the numbers of bills proposed by different legislative actors, the scope of bills and the success rate of bills.
Our major analysis tests the effect of the 1999 legislative decentralization on legislative success. Legislative success sums up the policymaking performance of a parliament and indicates a legislative actor's capacity to enact legislation with a given legislative organization. We perform a regression analysis of legislative success with confounding factors controlled. In particular, this analysis will show how the success rate for each legislative actor's bills changed with the 1999 legislative decentralization. Accordingly, the unit of analysis is each bill, and the dependent variable is Success, which equals 1 when a bill was enacted and 0 otherwise. Given the binary dependent variable, we estimate the coefficients using pooled logistic regression.Footnote 7
The key independent variables are dummy variables indicating the type of the initiators for each bill. We include the Government, the Majority Party, Small Parties and Cross-Party Efforts with the bills proposed by the (largest) Minority Party being the base category.Footnote 8
Decentralization is a dummy variable with 1 indicating that a bill was proposed after the 1999 legislative decentralization and 0 otherwise. This variable is expected to offer evidentiary information demonstrating that the overall success rate increased after legislative decentralization. We further interact this variable with those representing the initiator(s) in order to gauge how the 1999 decentralization changed the legislative capacity of each legislative actor.
We control for several relevant variables. First, with decentralized legislative organization, a joint effort by multiple branches is more likely to succeed since the legislative authority is scattered widely. We then include two dummy variables, Government Only and Both Branches, in order to control for the participation of the executive and legislative branch in respective legislation. Moreover, we control for the scope of the bills by including Minor Revision in the model and combining the bills of a new law and grand revisions (bills revising at least five articles) together as the base category. Given the decentralized legislative organization, minor revisions can be more likely to succeed than their counterparts. Next, since law-making takes time, bills proposed earlier would be more likely to pass through all stages. Bills proposed in the final session are treated as the reference category, while two dummy variables, First Session and Mid Session, are included. Media can be another parameter influencing policymaking (Kingdon Reference Kingdon1995; Walgrave et al. Reference Walgrave, Soroka and Nuytemans2008). We then include Media Coverage with respect to each given legislation. Finally, we control for the Governing Party's Seat Share, Governing Party Unity Score and Effective Number of Parties in the LY during each parliamentary term in order to be sure that the observed legislative capacity of the government does not simply result from these term-specific parameters.
From authoritarianism to democracy: Taiwan's legislative organization in transition
Prior to the mid-1980s Taiwan's parliament played a limited role in the policymaking process. The hegemonic party, the Kuomintang (KMT), had not only taken a firm grip on the executive power, but had also exclusively controlled the legislative authority since the great retreat from mainland China. More than 80% of the legislators at that time were KMT members, and most of them were elected in the 1940s (Sheng Reference Sheng2008: 9). Although a limited number of seats were open for supplementary elections, 95% of the KMT nominees were elected (Chen Reference Chen and Tien1996). Given that the electoral fortunes of the KMT legislators hinged solely on their loyalty to the party (Ho Reference Ho1986), individual legislators simply complied with the party instead of actively engaging in the policymaking process. Meanwhile, individual legislators’ bills had to be censored and approved by the party leadership before they could be submitted to the floor (Sheng Reference Sheng2003). In consequence, the executive branch initiated more than 90% of all legislative bills. The LY was jokingly called ‘the Legislative Bureau of the Executive Yuan’, meaning that the LY was not parallel, but subordinate to the executive branch.
However, the good times for the KMT government did not last forever. Starting from 1986, the major opposition party, the Democratic Progressive Party (DPP), received approximately 30% of the votes in consecutive supplementary elections. Losing electoral dominance the newly elected KMT legislators had to draw voters’ attention by being active in the legislative arena. To accommodate these demands the KMT began to relax the limit on legislators’ proposal rights after 1988. With lessened constraints the legislators not only delayed the government's legislation; they also proposed bills that deviated from the will of the KMT leadership.
After the first election of the entire LY in 1992 a greater variety of political elites were elected into the parliament. Although the KMT was still the majority party, the legislators from the minority challenged the KMT government in order to respond to citizens who desired political reforms. From 1993 to 1998 the opposing legislators initiated numerous motions to bog down the legislative process in a bid to both delay the KMT's legislative agenda and force the KMT to include their policy preferences into the enacted law. Even worse, the KMT could not get consistent support from its members, who prioritized their pursuit of personal votes under the single non-transferable vote with multi-member districts system (SNTV-MMD). The KMT government was thus desperately frustrated. ‘Ten years ago,’ said a former KMT legislator in an interview around 1996, ‘when a bill proposal was submitted from the Executive Yuan to the Legislative Yuan, we could expect that almost nothing was changed, not even a word. However, now when a bill proposal is submitted to the Legislative Yuan, the Executive Yuan cannot expect what it will look like until the final stage’ (Sheng Reference Sheng1996: 156). Statistically, during the two parliamentary terms after 1992, less than 40% of the government's bills and less than 23% of all bills were enacted.
The unsatisfactory legislative performance triggered public demands for parliamentary reforms. Oddly enough, frustrated in the legislative arena between 1993 and 1998, the KMT leadership did not take action to strengthen the legislative authority of the government or the majority party. Instead, cooperating with the DPP and the New Party (NP), the KMT took the lead in proposing bills of parliamentary reform.Footnote 9 Several legislative rules that empower small parties and individual legislators were enacted and implemented in 1999. To clarify, the KMT did not opt to centralize the legislative authority for two reasons. First, it would seem anti-democratic if the KMT tried to grab all the legislative powers and strongly suppress its opponents at the onset of democratization. Second, the KMT's hands were tied by long-lasting internal splits. The power struggles between the leadership and non-mainstream faction, which resulted in the formation of the NP in 1993, continued until the 1996 presidential election (Fell Reference Fell2005: 16–17). Later, the decision to downsize the provincial government of Taiwan in 1997 exacerbated the power struggle between two leading figures in the party, President Lee Teng-Hui and Governor Soong Chu-Yu.Footnote 10 Their rivalry ultimately led to the formation of the People First Party (PFP) in 2000. Given these contextual constraints, centralizing the legislative organization was not feasible. The KMT leadership had to compromise with the opposing legislators from both inside and outside the party in order to lessen legislative obstruction, leading to the 1999 legislative decentralization.
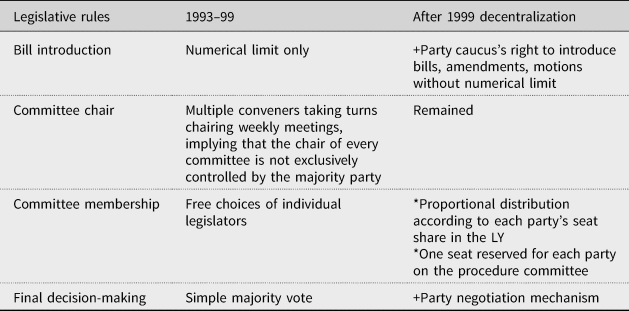
As shown in Table 1, the changes in the legislative rules include the addition of a provision for each party to propose bills without any co-sponsors, the invention of a party negotiation mechanism (PNM) and reserving seats on the procedure committee for each party.Footnote 11 Without taking individual legislators’ rights away, these changes have in fact further granted the minority party, small parties and individual legislators more access points to influence policymaking and to share decision-making powers. The provision of party bill introduction has allowed small parties to bypass the numeric limit of co-sponsors. The legislators from small parties may propose bills, amendments and motions in the name of party caucus without needing to find sufficient co-sponsors. Each party has at least one seat on the procedure committee, and the allocation of any committees’ membership is proportional to each party's seat share in the LY. Meanwhile, the PNM was invented as a formal procedure embedded in the final stage of legislation. With few exceptions, a unanimous agreement between all parties is required to enact bills referred to the PNM. Given the consensus-based mechanism, each party, regardless of its size, may veto or defer legislation in the negotiation process. Studies have shown that in one parliamentary term there can be more than 40% of the bills sent to the PNM being buried in the negotiations (Huang Reference Huang2019). Altogether, the 1999 reform of legislative rules further scattered policymaking rights and powers, making Taiwan's legislative organization highly decentralized.Footnote 12
Key Features of Legislative Organization in Taiwan

Source: Authors, summarized from the five laws regulating the LY.
Notes: +indicates a new add-on after 1999; *indicates a replacement for the original rule.
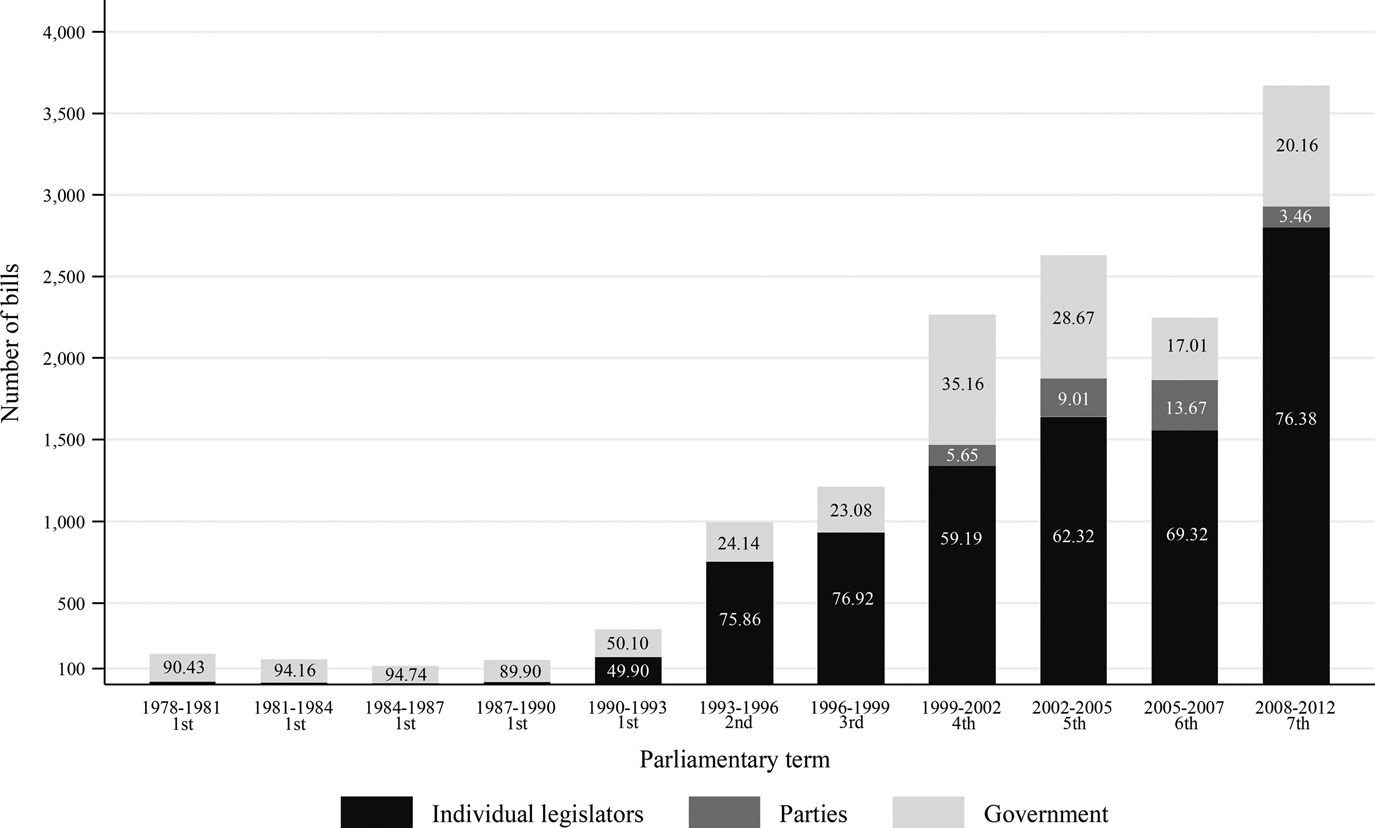
Moving from authoritarianism to democracy, Taiwan's legislative organization has evolved to be highly decentralized, and the policymaking performance has revealed characteristics typical of decentralized legislative organization. There has been a large and increasing number of bills, leading to a heavy workload for the LY. Democratic parliaments may place numerical limits (i.e. the number of co-sponsors required), time limits, technical limits and content restrictions upon individual legislators’ bill-introduction rights (Mattson Reference Mattson and Döring1995). In Taiwan, however, the legislators’ right to propose bills is only constrained by a numeric limit.Footnote 13 In fact, even the numerical requirement is not an effective barrier because individual legislators tend to co-sponsor each other's bills reciprocally. As Taiwan's electoral system has encouraged the legislators to cultivate personal votes (Sheng Reference Sheng2014), the absence of an effective limit allows them to propose numerous bills that serve their electoral needs. Figure 1 shows the numbers of bills from 1978 to the end of the seventh LY (2012).Footnote 14 Under authoritarianism, the government proposed about 90% of bills before 1990.Footnote 15 Individual legislators started to play a significant role in legislative input by proposing roughly 50% of bills between 1990 and 1993. The total number of bills has risen from 994 in the second LY to more than 3,600 in the seventh. In almost every term, more than 60% of bills were proposed by individual legislators. By contrast, the government accounted for only about a quarter of all bills. The growth of legislators’ bills reflects not only that the legislators with personal vote-seeking incentive have actively contributed to the legislative inputs, but also that the proposal rights of individual legislators have been nearly unconstrained.
Overview of Legislative Bills
Source: Parliamentary Library (2015).
Note: The numbers within each bar are the percentages of bills introduced by different initiators.

Another typical feature of decentralized legislative organization is an overproduction of petty bills. Not only have the unconstrained bill-introduction rights allowed resource-deficient legislators to propose piecemeal bills, but the dispersal of parliamentary rights has also incentivized legislative actors to avoid proposing large-scale bills that might easily draw objections. From 1993 to 2012, only 18.8% of all bills were drafting a new law, 14.2% of them were grand revisions, and repeals accounted for another 2%. The remaining two-thirds, 8,461 bills, were minor revisions that revised four or fewer articles. The minor revisions also constituted a major component of legislative output. Of all 3,489 bills that were enacted, 62.54% were minor revisions, while only 34.69% were bills of new laws and grand revisions.
Given the heavy workload and scattered policymaking rights, the chances of legislation being successful are small. Overall, the success rate for all legislative bills between 1993 and 2012 was 26.59%, and it was lower than 30% in almost every parliamentary term.Footnote 16 In particular, the government in Taiwan has struggled to enact its legislation. There has been neither a provision that prioritizes the government's bills, nor one that shields the government's bills from being amended. More importantly, the government's bills are highly likely to be referred to the PNM at the final stage of legislation, increasing the chances of failure (Huang Reference Huang2019). Despite the government's advantage in information, resources and policy professionals over the legislative branch (McCubbins and Noble Reference McCubbins, Noble, Cowhey and McCubbins1995; Sheng Reference Sheng2003), only 42.83% of the government's bills were enacted in the LY during the period under investigation. The best performance of the government in one parliamentary term was about 54%. The legislative weakness of the government cannot be simply explained away by the number of parliamentary seats held by the governing party. The success rate for the majority governments (1993–2000 and 2008–12) was only 4% higher than that for the minority governments (2000–8).Footnote 17
As we trace the roots of Taiwan's long-lasting worrisome performance, developments during the democratic transition played a crucial role in moulding the evolutionary path of legislative organization. Specifically, deviating from the conventional understanding of legislative organization, legislative decentralization took place when the PLAs encountered policymaking difficulties at the onset of Taiwan's democratization, ultimately creating highly decentralized legislative organization.
The effect of the 1999 legislative decentralization
To understand the reasons for the under-theorized evolutionary path of legislative organization, our theory posits that legislative decentralization serves as a strategy of inclusion for the PLAs to co-opt the opposition and revive policymaking performance when there is serious legislative inaction. Descriptive statistics offer preliminary support to such a use of legislative decentralization. During the second and third term the average success rate per parliamentary term was 22.37% for all bills and 36.14% for the government's bills, while these rates rose to 27.84% and 45.23%, respectively, after 1999. Other studies corroborate that the total number of enacted bills increased as harmony was enhanced in the following parliamentary term (Lo Reference Lo2006; Wang Reference Wang2003), and the frequency of parliamentary brawls also dropped in 1999 (Batto et al. Reference Batto, Tsai and Weng2016).
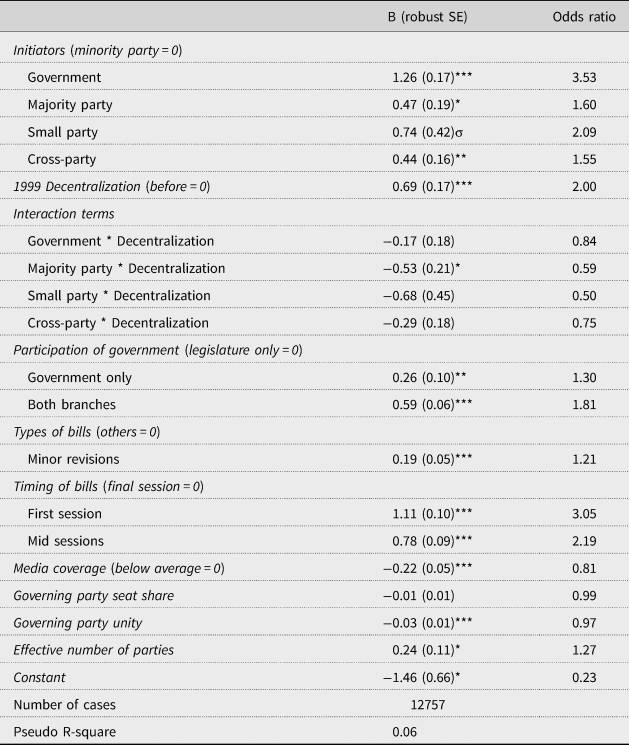
To further demonstrate the changes following the 1999 legislative decentralization, we perform a logistic regression analysis. Two findings from Table 2 are worth discussion. On the one hand, the decentralization has levelled the success rate across the initiators. The coefficient for the dummy variable for each legislative actor indicates the difference in the odds of legislative success between the given actor's bills and the base category (i.e. the minority party's bills). The negative coefficients for the interaction terms mean that, other things being equal, such differences have diminished since the 1999 decentralization. On the other hand, the coefficients for the 1999 decentralization and the interaction terms indicate that, ceteris paribus, the bills proposed by each legislative actor after the legislative decentralization were on average more likely to succeed than those proposed before. This provides key evidence for the utility of legislative decentralization in terms of reviving legislative performance from a nearly paralysed parliament.Footnote 18
Logistic Regression Analysis of Legislative Success

Note: The dependent variable is a binary variable denoting whether a given initiative is successfully enacted.
σp < 0.1; *p < 0.05; **p < 0.01; ***p < 0.001.
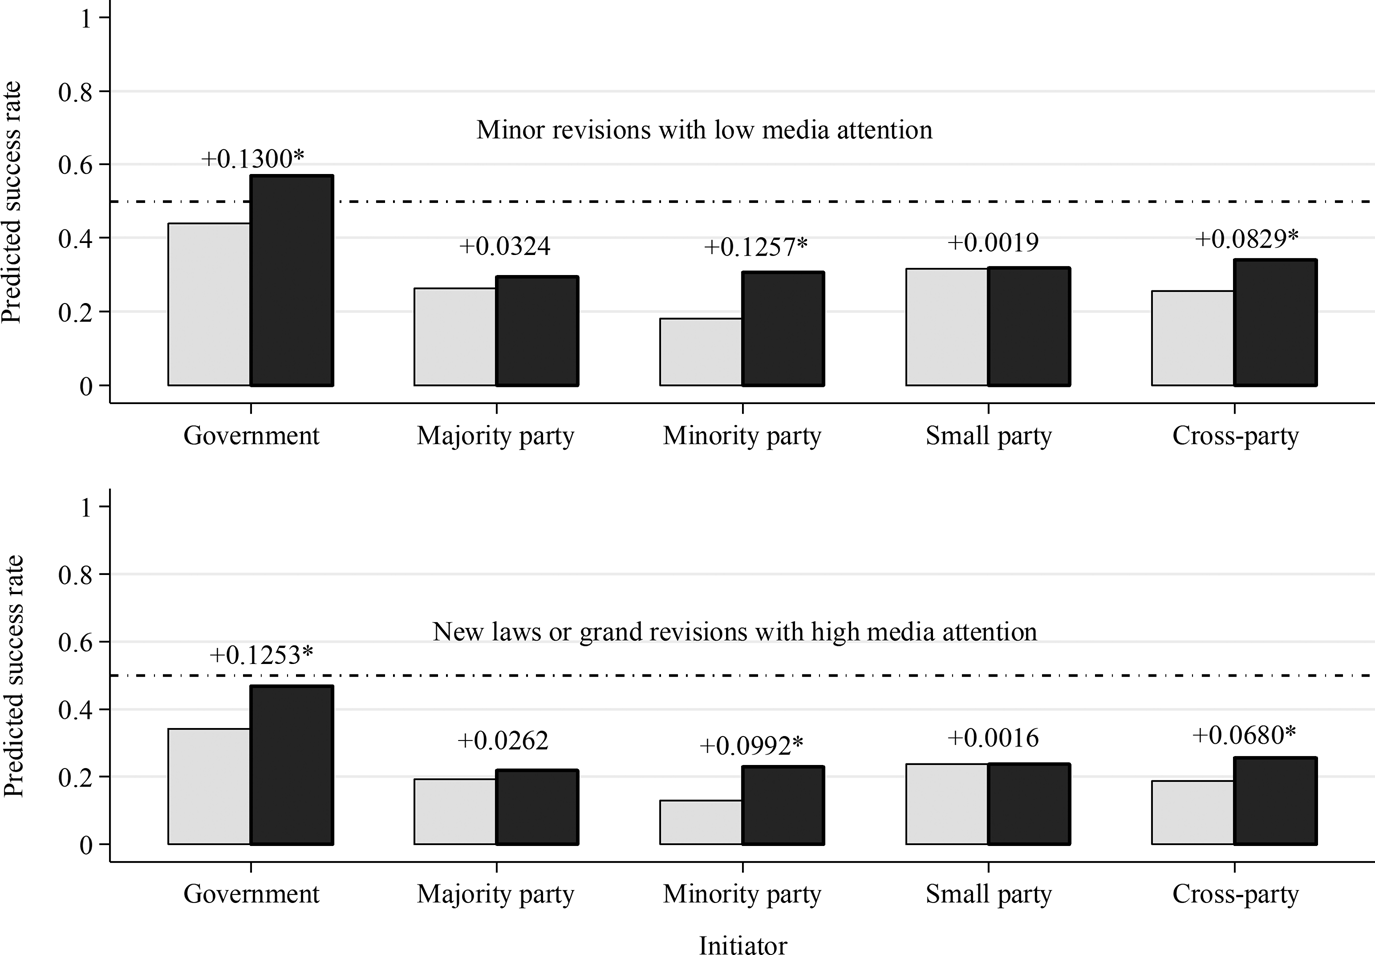
We visualize the changes in the predicted success rates following the 1999 legislative decentralization in Figure 2. In order to assure that the findings are not confined within minor and non-salient legislation, we show the predicted success rates for minor revisions with low media attention in the upper panel and those for proposals of new laws or grand revisions with high media attention in the lower. The former category of bills is supposedly more likely to be enacted than the latter. Moreover, the governing party's seat share and party unity are fixed at the value during the term right before 1999 (third LY), and the effective number of parties at its mean prior to the 1999 decentralization. This allows us to show the changes following the decentralization if these variables remain unchanged. The other variables are fixed at their mode.
Predicted Success Rates Before and After the 1999 Decentralization
Notes: The dark-coloured bars represent the predicted success rates after the 1999 decentralization, and the light-coloured bars represent the counterparts. The number above each bar is the difference in the predicted success rates between initiatives before and after the 1999 decentralization. * indicates that the difference is significant at the 0.05 level. The horizontal dash line indicates a success rate of 0.5.

Not surprisingly, the 1999 legislative decentralization prevented the PLAs from enjoying the desirable policymaking performance that would have come with centralized legislative organization. After the decentralization, the government could only enact 57% of the non-salient minor bills and less than 50% of the large-scale salient ones. For the bills proposed by the party caucuses and individual legislators, the predicted success rate has been made even across the parties. Notably, while the majority party has not fared worse after the decentralization, the edge that it previously had over its major competitor, the minority party, has diminished. However, in both panels, the dark-coloured bars are taller than the light-coloured, meaning that, ceteris paribus, all the legislative actors, including the PLAs, have more or less fared better as the decentralization helped abate the scorched-earth antagonism. In particular, the government's success rate, which was what motivated the KMT to decentralize the legislative organization, has increased noticeably. To sum up, whereas the resulting highly decentralized legislative organization has kept the chance of successful legislation at a low level and equalized each party's legislative capacity, the 1999 legislative decentralization has revived policymaking performance.
The evidence here indicates a utility of legislative decentralization that has been overlooked by the existing literature. Of course, compared with legislative centralization, making legislative organization decentralized may ultimately lead to less favourable policymaking performance and more limited legislative advantages for the PLAs. However, in comparison to struggling in a paralysed parliament where little can be done, legislative decentralization can be a tempting poison that quenches the PLAs’ immediate thirst for legislative progress.
Conclusion
Departing from the existing literature on legislative organization, this article has demonstrated that legislative decentralization can be taken as a strategy of inclusion to slightly revitalize law-making performance, although the resulting decentralized legislative organization has ultimately constrained the legislative capacity of the PLAs. Our findings imply that democracies facing policymaking difficulties may resort to decentralizing their legislative organization. As mentioned, South Korea experienced similar legislative decentralization in 2012. The intent was to ease the tension in the National Assembly by institutionally granting the minority more decision-making rights (Frank et al. Reference Frank, Hoare, Köllner and Pares2013). While the number of bills passed and success rate increased in the following term (Cho Reference Cho2016), the new rules have made it difficult for the ruling party to enact its important legislation (Kim and Kim Reference Kim and Kim2016). South Korea's experience echoes our findings, and our research provides a systematic investigation that complements our understanding of why legislative organization may evolve to be decentralized.
The creation of highly decentralized legislative organization is concerning not only because it eventually weakens the legislative capacity of the PLAs, but because it might lead to an inefficient pattern of policymaking. Plenty of parliamentary time and resources would be devoted to petty private bills. Each piece of legislation may not receive sufficient deliberation, rendering a poor quality of policies. Finally, a low chance of legislative success and piecemeal legislation further indicate that a large portion of legislative resources are spent in vain.
Before concluding, we would like to invite research that utilizes ours as a point of departure to investigate further the conditions under which legislative centralization might take place when there is already highly decentralized legislative organization. In the case of Taiwan, the legislative actors might be reluctant to change the rules because they have tasted the benefits of decentralized legislative organization. Moreover, for fear of losing majority status in the future, the majority party might lack the incentive to suppress minority rights. We share Binder's (Reference Binder1996) views and expect that highly decentralized legislative organization, once formed, will remain unless both the leaders and members of a strong majority party feel the necessity to centralize the legislative authority. Nevertheless, we let this question remain open for future research.
Supplementary material
To view the supplementary material for this article, please go to https://doi.org/10.1017/gov.2020.20
Acknowledgements
We are grateful for the reviewers’ comments, which helped us to improve this article. We also appreciate the questions and suggestions we received from Kharis Templeman, Nick Lin, Wen-chin Wu, Yi-ting Wang and Dafydd Fell. In addition, our gratitude goes to our research assistants who have helped collect the legislative data for this research project. This research project was funded by the Ministry of Science and Technology, R.O.C., under grant MOST 104-2410-H-004-088-MY2.