Introduction
Body image distortion is a key symptom of eating disorders in the commonly used diagnostic systems. In DSM-IV anorexia nervosa is characterized by the ‘intense fear of gaining weight or becoming fat, even though underweight’ and a ‘disturbance in the way in which one's body weight or shape is experienced, undue influence of body weight or shape on self-evaluation, or denial of the seriousness of the current low body weight’ (APA, 2000, p. 316). Furthermore, body image distortion is an important point of application for psychotherapeutic interventions (Gerlinghoff et al. Reference Gerlinghoff, Backmund, Franzen, Gorzewski and Fenzel1999) and the persistence of this distortion following treatment presents a negative prognostic factor (Lay & Schmidt, Reference Lay and Schmidt1999).
In behavioral research on anorexia nervosa two components of body image are widely accepted: (a) the estimation of one's own body size and (b) the attitude towards one's own body in terms of an emotional evaluation (Slade, Reference Slade1994; Skrzypek et al. Reference Skrzypek, Wehmeier and Remschmidt2001). Various techniques for the assessment of body size perception have been used, including video distortions (Probst et al. Reference Probst, Vandereycken, Coppenolle and Pieters1998), paper questionnaire methods (Stunkard et al. Reference Stunkard, Sorensen and Schulsinger1983) and computer-based image distortion methods (Johnstone et al. Reference Johnstone, Stewart, Benson, Kalafati, Rectenwald and Horgan2008). Common methods used to assess the emotional evaluation of one's own body size are self-report questionnaires or perceptual methods examining the perceived difference between current body size and ideal body size (Stunkard et al. Reference Stunkard, Sorensen and Schulsinger1983; Williamson et al. Reference Williamson, Davis, Bennett, Goreczny and Gleaves1989).
The overestimation of one's body size by patients with anorexia nervosa has been found in several studies (Molinari, Reference Molinari1995; Gardner & Bokenkamp, Reference Gardner and Bokenkamp1996; Lautenbacher et al. Reference Lautenbacher, Kraehe and Krieg1997; Gila et al. Reference Gila, Castro, Toro and Salamero1998; Smeets & Kosslyn, Reference Smeets and Kosslyn2001; overestimation for a subpopulation, Probst et al. Reference Probst, Vandereycken, Coppenolle and Pieters1998; review by Skrzypek et al. Reference Skrzypek, Wehmeier and Remschmidt2001). Emotional body evaluation tasks, like satisfaction ratings, often produce larger differences between patients with anorexia nervosa and controls than body size estimation tasks (Skrzypek et al. Reference Skrzypek, Wehmeier and Remschmidt2001).
Neuroimaging studies concerning body image distortions in anorexia nervosa have revealed an inconsistent pattern of results. Seeger et al. (Reference Seeger, Braus, Ruf, Goldberger and Schmidt2002) reported a stronger activation of the amygdala for patients viewing distorted images of their own body in a pilot study. These results support the assumption that alterations in emotional body evaluation for patients with anorexia exist. However, in a later extended replication of the experiment, no amygdala activation was found for the patient group; instead, areas in the middle frontal gyrus and posterior parietal cortex were activated more strongly for patients (Wagner et al. Reference Wagner, Ruf, Braus and Schmidt2003; see also Beato-Fernández et al. Reference Beato-Fernández, Rodríguez-Cano, García-Vilches, García-Vicente, Poblete-García, Castrejon and Toro2009). Different results were reported by Uher et al. (Reference Uher, Murphy, Friederich, Dalgleish, Brammer, Giampietro, Phillips, Andrew, Ng, Williams, Campbell and Treasure2005), who found that activations to drawn body images in the posterior parietal and lateral occipitotemporal cortex were less strong in patients compared to control subjects. The authors concluded that the lower activation of the posterior parietal cortex might be related to deficits in body perception and might facilitate the development of body image disturbances.
In general, the results of experiments on brain areas and body image are inconsistent, which might be related to the differences in tasks and stimuli used. Overall, the results indicate alterations in the activation of posterior parietal regions for patients with anorexia nervosa, possibly related to spatial components of the body image (body schema, Schwoebel & Coslett, Reference Schwoebel and Coslett2005; Reed & Farah, Reference Reed and Farah1995). Systems involved in emotion (the amygdala, insula and medial prefrontal cortex) have been reported to be involved in the processing of body images, without a clear differentiation between patients and healthy controls (Seeger et al. Reference Seeger, Braus, Ruf, Goldberger and Schmidt2002; Wagner et al. Reference Wagner, Ruf, Braus and Schmidt2003; Uher et al. Reference Uher, Murphy, Friederich, Dalgleish, Brammer, Giampietro, Phillips, Andrew, Ng, Williams, Campbell and Treasure2005). All three studies are constrained by the fact that body image was investigated as a unitary concept. No distinction was made between the commonly accepted aspects of body image, the perception of one's own body size and the attitudes towards one's own body (Skrzypek et al. Reference Skrzypek, Wehmeier and Remschmidt2001; Smeets & Kosslyn, Reference Smeets and Kosslyn2001).
The present study therefore set out to investigate the neural correlates of two parts of the body image: satisfaction rating of the body and body size estimation. In the first task, subjects had to make a satisfaction rating about distorted self-images, indicating how much the presented image represented their ideal body image. In the second task, using the same stimulus material, subjects were asked to rate how much the presented images represented their real body size. The tasks were designed as computer-based functional magnetic resonance imaging (fMRI) experiments according to well-established assessments of body size perception and body satisfaction ratings. Using this approach we were able to address two well-investigated aspects of body image in anorexia with neuroimaging methods.
We hypothesized that patients suffering from anorexia nervosa would exhibit higher discrepancies between self-perception and their ideal body image. Furthermore, we expected anorectic subjects to show a bias in overestimating their body size when performing the body size estimation task. We consider that the modulation in task and levels of distortion should contribute towards a clarification of brain response patterns that are differentially modulated for anorectic and control subjects. Specifically, the involvement of areas related to the emotional evaluation and the estimation of one's own body size should lead to distinguishable activations in anorectic and control subjects. To investigate this aspect, we calculated a whole-brain three-way interaction analysis with the factors task (body size estimation versus satisfaction rating)×group (anorectic versus control group)×distortion level of self-images (thinner, about actual size, fatter).
Method
Subjects
Sixteen female patients with anorexia nervosa according to DSM-IV criteria and 16 female healthy controls participated in the experiment. All participants were right-handed and had normal or corrected-to-normal visual acuity. Subjects were excluded from participation if they reported any history of substance abuse, schizophrenia and psychotic symptoms, bipolar disorders, neurological disease or closed head injury. None of the anorectic subjects met criteria for major depressive or severe anxiety disorder within the past month. Six patients fulfilled the criteria for a major depressive episode during their lifetime. Subjects participating in the control group reported no history of psychiatric or neurological illness and no psychotherapeutic interventions. All patients underwent a full physical examination. Five of the patients were on medication: three with tricyclic antidepressants (clomipramine 10, 25 and 75 mg/day) and two with selective serotonin reuptake inhibitors (fluoxetine 20 mg/day and citalopram 20 mg/day). All healthy subjects were free from medication.
For the anorexia nervosa and control groups, the mean age was 24.1 (s.d.=3.4) and 25.6 (s.d.=4.5) years respectively [t(30)=1.05, p=0.3]. Current body mass index (BMI) was lower in anorectic (mean=15.9, s.d.=1.25) than in control subjects [mean=21.7, s.d.=2.5; t(30)=9.6, p<0.01]. Written informed consent was obtained from each subject after the procedure had been fully explained. The experiment was approved by the ethics committee of Goethe University Medical School.
Stimuli
Digital photographs of each subject's whole body were created on a monotonous, blue-colored background in a standardized pose. The computer program Body Image (Sands et al. Reference Sands, Maschette and Armatas2004) was used to manipulate the digital image of the subject. Shoulders, chest, hips, thighs and calves were distorted by ±1% steps to obtain 31 images with different degrees of body size distortion relative to the original. For each subject, we used the following images: 15 fatter than actual body images (distortion at +1% to +15% of the original image) and 15 thinner than actual body images (distortion at −1% to −15% of the original image) in addition to the original photograph.
Paradigm
Images were projected onto a removable screen inside the MR bore (Sony data beamer, VPL-XP20, 1400 ANSI). Subjects were asked to perform one task in which they were asked to rate the presented images with regard to their real body image (body size estimation task) and another task in which they were asked to rate the presented images with regard to their ideal body image (body satisfaction task). Each subject underwent every task modulation twice for a whole set of morphed images. Tasks were presented in balanced order.
Body size estimation
Most body size estimation tasks require subjects to choose the silhouette (from thin to big) that most closely resembles the subject's real figure (Stunkard et al. Reference Stunkard, Sorensen and Schulsinger1983; computer-based estimation with individualized images, Johnstone et al. Reference Johnstone, Stewart, Benson, Kalafati, Rectenwald and Horgan2008). Assessment with fMRI, however, makes several repetitions of each trial necessary, so we adapted this type of task in the following way. Subjects were presented with an image of themselves (randomized in terms of distortion from thin to big) for 4000 ms, and then were given 4000 ms to decide how much the presented image corresponded to their real body image.
Ratings were made by button press: −2=image is extremely distorted, −1=image is moderately distorted, +1=image is nearly realistic, +2=image is realistic and undistorted. During the inter-trial interval (ITI, baseline) of 8 or 12 s, subjects were presented with a white fixation cross on a black background. In this task the misperception of one's own body size (bodymisperc) is calculated as the discrepancy between the perceived real body shape (bodyperc) and the existing real body shape (bodyexist):

where bodyperc is the mean percentage distortion of the images that were rated as being most realistic.
Body satisfaction
In most perceptual body satisfaction tasks, subjects are asked to select an image matching their ideal body size and also one matching their actual body size (Stunkard et al. Reference Stunkard, Sorensen and Schulsinger1983; computer-based estimation, Johnstone et al. Reference Johnstone, Stewart, Benson, Kalafati, Rectenwald and Horgan2008). The extent of discrepancy between self-perception and ideal perception has been interpreted as a measure of body satisfaction (Fallon & Rozin, Reference Fallon and Rozin1985). We adapted this task with regard to the demands during fMRI scanning on the one hand and the comparability to the previously described body size estimation task on the other.
The stimuli and presentation times of the second task were identical to the first. The subject had to evaluate how much the shown image represented their ideal body image: −2=image is not identical at all, −1=image is not identical, +1=image is nearly identical, +2=image is identical to ideal body shape.
Body satisfaction (bodysatisfy) can therefore be calculated as the discrepancy between the ideal body shape (bodyideal) and the perceived real body shape (bodyperc):

where bodyideal is the mean percentage distortion of the images that were rated as being most ideal.
The two tasks were presented blockwise, two blocks for each task. One block consisted of 30 trials, lasting 7 min 20 s. The blocks were presented in pseudo-randomized order.
Control variables
To obtain a more detailed picture of body image and body awareness, all subjects also completed the body image questionnaire FKB-20 (Clement & Lowe, Reference Clement and Lowe1996). This instrument assesses two dimensions of body image: (a) negative attitudes towards one's own body, such as disgust and dissatisfaction, and (b) restricted body dynamics, such as how healthy, fit and powerful a subject experiences their own body.
MRI procedure
Images were acquired on a 3-T Siemens Magnetom Allegra Scanner (Siemens, Medical Systems, Germany) using a standard four-channel head coil. During the experiment, 33 oblique axial slices (in-plane resolution=3.5×3.5 mm2, slice thickness=3 mm, interslice distance=0.6 mm) covering the entire cortical volume were acquired using a T2*-weighted echo planar imaging (EPI) sequence [repetition time (TR)=2000 ms, echo time (TE)=30 ms, flip angle (FA)=90°, matrix size=64×64]. The subjects underwent four functional runs (220 volumes per run, two runs per task condition) resulting in a total number of 880 volumes per subject. The first two volumes of every run were discarded to account for T1 saturation effects. High-resolution anatomical volumes using a T1-weighted three-dimensional (3D) magnetization prepared rapid acquisition gradient echo (MP-RAGE) sequence (TR=2300 ms, TE=3.93 ms, resolution=1 mm3, 144 slices) were acquired after the functional runs for co-registration with the functional data.
Data analysis
The functional and anatomical images were analyzed using the Brainvoyager QX software package (Brain Innovation, The Netherlands). Data pre-processing included a slice scan time correction using sync-interpolation, 3D motion correction using rigid body transformations, spatial smoothing with a 4-mm Gaussian kernel (full-width at half-maximum), temporal high-pass filtering to remove low-frequency non-linear drifts of three or fewer cycles per time course and linear trend removal. The functional data were subsequently co-registered with the anatomical scans and transformed into Talairach space (Talairach & Tournoux, Reference Talairach and Thournoux1988) for each subject.
General linear models (GLMs) were computed from the 128 z-normalized volume time courses (32 subjects×four runs). The blood oxygen level-dependent (BOLD) response was modeled using a two gamma hemodynamic response function. For fMRI analysis we pooled the images of the four scans into three categories of predictors: 10 thinner (−15% to −6%), 11 about actual size (−5% to 5%) and 10 fatter pictures (6% to 15%) per scan, for both of the tasks performed respectively.
Analysis was based on a second-level random-effects GLM with factors task (baseline, body size estimation, satisfaction rating)×group (anorectic, control group)×distortion level of self-images (thinner, about actual size, fatter). For clarification and interpretation of the complex three-way interaction effects we extracted the beta values of significant clusters by averaging over all voxels within a cluster. Post-hoc t tests and repeated-measures ANOVAs were performed on the extracted beta values.
Statistical results were visualized by projecting the data on the inflated surface reconstruction of a template brain (courtesy of Montreal Neurological Institute; MNI).
Results
Behavioral data
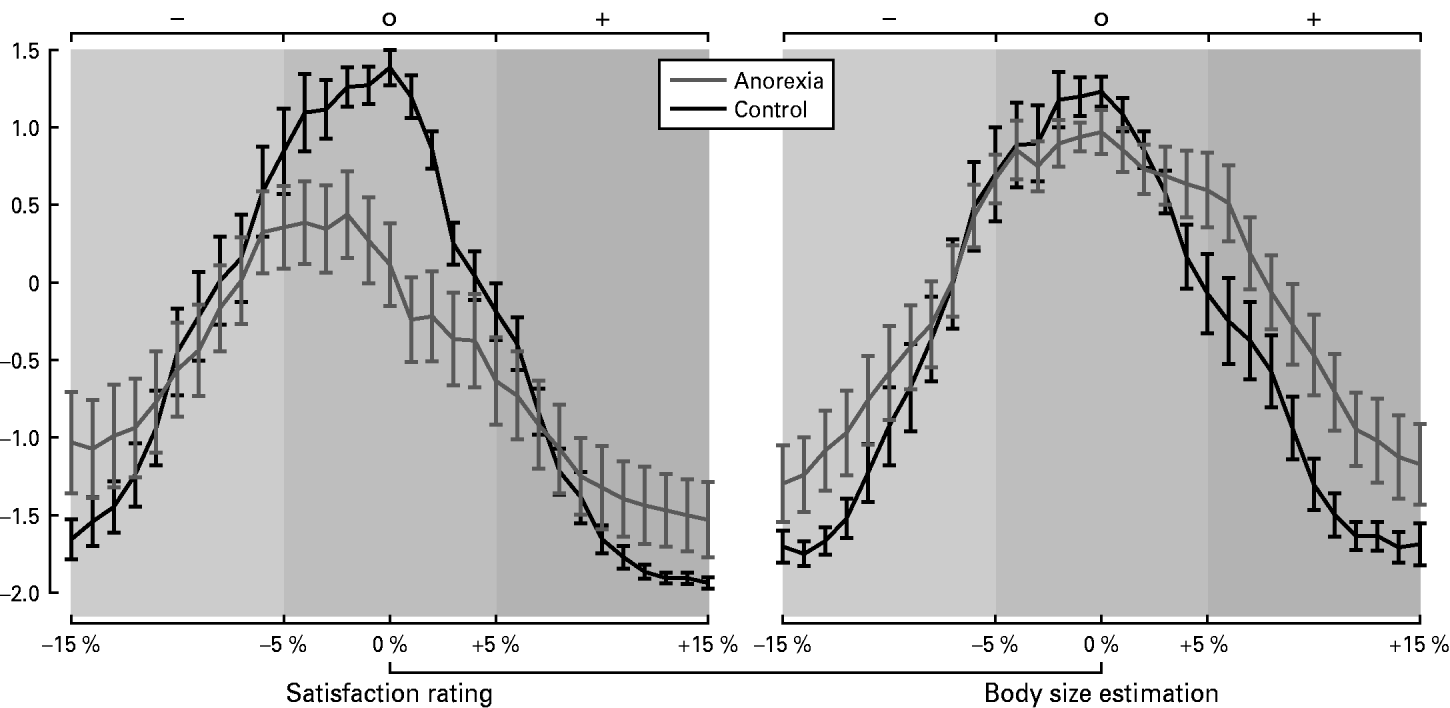
Our analysis of the behavioral data followed two different but complementary approaches. We first computed discrepancy indices for body satisfaction and body misperception as described above. Additionally, because these indices do not allow for differentiation between the behavioral responses to thinner than actual and fatter than actual images, we computed tests on the basis of the original rating data (Fig. 1 and Table 1).
Response polygons for the anorectic ( ) and control groups (–––) in the body satisfaction rating and body size estimation tasks. The polygons describe the relationship between objective variations in body size (distortion maximal at±15% of the original self-image 0%) and the responses of the subjects (satisfaction rating: −2=image is not identical at all, −1=image is not identical, +1=image is nearly identical, +2=image is identical to ideal body shape; body size estimation: −2=image is extremely distorted, −1=image is moderately distorted, +1=image is nearly realistic, +2=image is realistic and undistorted).

Comparison between anorexia and control groups in body satisfaction (bodysatisfy) and misperception of one's own body size (bodymisperc)

s.e., Standard error.
Bodysatisfy was calculated as the discrepancy between the ideal body shape and the perceived real body shape. Bodymisperc was calculated as the discrepancy between the perceived real body shape and the existing real body shape.
Group comparison was calculated by the unpaired t test, n=32.
Body satisfaction task
We compared the index of body satisfaction (bodysatisfy) between the patient and control groups. A t test revealed a trend [unpaired t test: t(30)=1.35, p=0.08] towards a lower body satisfaction mean in the anorectic group (anorexia mean bodysatisfy=−4.3, s.e.=1.6; control group mean bodymisperc=−1.8, s.e.=0.57), indicating that anorectic patients tended to have a thinner ideal body size in relation to their perceived body size compared to the control group. Testing the direct behavioral responses with a 2×3 ANOVA (group, anorexia versus control×task levels, thinner versus about actual size versus fatter) revealed a significant interaction between group and task level [F(2, 60)=4, p<0.05]. A post-hoc t test demonstrated that patients with anorexia nervosa also had a more negative rating of their actual sized image (±5% distortion) when comparing these to their ideal body image, in contrast to controls [t(30)=3.4, p<0.05]. This effect was not found for the thinner (−6% to −15%) or the fatter (+6% to +15%) than actual images between the two groups [t(30)=0.23, p=0.81; t(30)=0.55, p=0.58].
Body size estimation task
The patient group demonstrated a significant overestimation of their body size in comparison to the control group as indicated by the difference in the body misperception index, bodymisperc [t(30)=2.1, p<0.05]: anorexia mean bodymisperc=1.38, s.e.=0.78; control group mean bodymisperc=−0.67, s.e.=0.65. Tests on the basis of the original rating data with a 2×3 ANOVA (group×task levels) showed a significant interaction between group and task levels [F(2, 60)=2.9, p<0.05]. Anorectic subjects estimated their presented fatter self-images to be more realistic than the controls [t(30)=2.2, p<0.05]; however, this was not the case for the thinner than actual images [t(30)=0.47, p=0.64]. Of note, the control group showed a weak trend in estimating their about actual sized images as being more realistic in contrast to the anorectic group [t(30)=1.8, p=0.08].
FKB-20 questionnaire
Significant differences between the two groups were also found for the two dimensions of the FKB-20 questionnaire. Patients had on average more negative attitudes and feelings towards their own body [t(29)=3.1, p<0.05] and they experienced their body as being less healthy and strong (body dynamics) compared to controls [t(29)=4.2, p<0.05].
Neuroimaging data
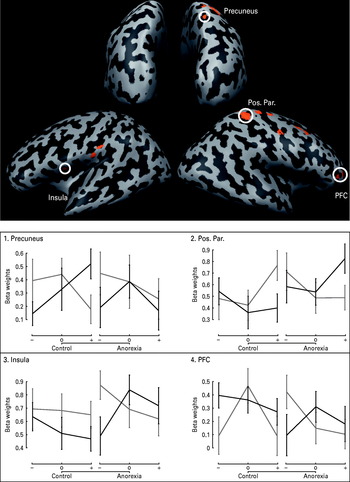
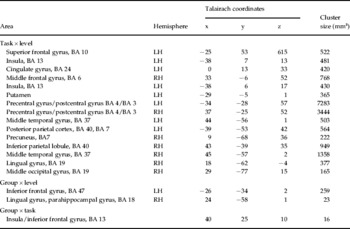
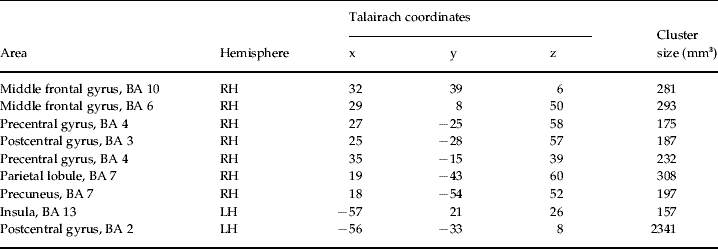
The aim of the current study was to investigate the impact of body size modulation from two perspectives in anorectic and control subjects. Our analysis was thus primarily focused on significant interactions that show a modulation in brain activity with respect to all of the three factors included in this experiment. Thus, significant interactions that did not include all three factors or that were not group related are presented in Table 2 but are not discussed further here. We calculated a three-way interaction analysis for the factors task×group×distortion level of self-images (p<0.001), uncorrected. The results are presented in Table 3 and Fig. 2. Significantly activated clusters were located in the left insula [Brodmann area (BA) 13], the right posterior parietal cortex (BA 7) and the precuneus (BA 7), the bilateral somatosensory cortices (BA 2), the right premotor cortex (BA 6) and the right middle frontal gyrus (BA 10). To clarify the direction of the interactions, we carried out post-hoc t tests for the activated clusters in the insula, the prefrontal and posterior parietal cortex/precuneus. Further investigation of clusters located in primary or secondary somatosensory or motor cortices was omitted. A summary of the brain activations is presented in Tables 2 and 3 and Fig. 2.
Random-effects general linear model (GLM) three-way interaction analysis for task (satisfaction rating versus body size estimation)×level (thinner versus about actual size versus fatter self-images)×group (anorexia versus control). Activated clusters are shown at p<0.001. The beta values were extracted from these clusters and error bars±s.e. are presented for task ( , satisfaction rating; ––– body size estimation), level (–, thinner; 0, about actual size; +, fatter) and group (anorexia, control).

Brain regions exhibiting significant activity of two-way interactions from ANOVA

BA, Brodmann area; Group, group with the stronger blood oxygen level-dependent (BOLD) response; LH, left hemisphere; RH, right hemisphere.
Random effect, p<0.001, uncorrected, n=32.
Brain regions exhibiting significant activity of three-way interaction analysis for task (satisfactions rating versus body size estimation)×level (thinner versus about actual size versus fatter self-images)×group (anorexia versus control)

BA, Brodmann area; RH, right hemisphere; LH, left hemisphere.
Insula
The three-way interaction in the insula was mainly caused by a significantly higher activation of this cluster for the thin self-images in the satisfaction rating task, in contrast to the thin self-images in the body size estimation task for the anorectic group [post-hoc t test: t(15)=2.9, p<0.01].
Anterior middle frontal gyrus
As in the insula, the three-way interaction in the middle frontal gyrus was mainly caused by a significantly higher activation of this cluster for the thin condition in the satisfaction rating task, in contrast to the thin condition in the body size estimation task for the anorectic group [post-hoc t test: t(15)=1.95, p<0.05]. In control subjects the opposite effect was observed. The cluster was significantly less active for the thin self-images in the satisfaction rating task, in contrast to the thin self-images in the body size estimation task [t(15)=2.3, p<0.05].
Precuneus
The significant three-way interaction in the precuneus is mainly due to the following findings. A post-hoc trend test demonstrated a linear modulation of the precuneus activity for the three levels of the body size estimation task in the control group [F(1, 15)=22, p<0.001]. Furthermore, a significantly higher activation for the body size estimation task, ‘fatter images’ condition, in contrast to the satisfaction rating, ‘fatter images’ condition, occurred in the control group [t(15)=3, p<0.01].
Discussion
In the present study we aimed to compare various aspects of body image between subjects with anorexia nervosa and healthy controls. The study set out to investigate the neural correlates of two aspects of body image that are often behaviorally investigated in the field of eating disorders: satisfaction rating and body size experience.
During the satisfaction rating task, participants were required to compare the presented image of themselves with their own ideal body image. Thus, during this task, subjects had to retrieve their representation of what they subjectively believed to be an ideal body size and compare whether the distorted image they were presented with corresponded accordingly. The second task using the same stimuli required subjects to take another perspective. In the body size estimation task, subjects were asked to compare the presented self-images with their real body image. This task thus requires subjects to retrieve their representation of their current body image when comparing it with the presented stimuli.
We were able to demonstrate that anorectic subjects judged their ‘about actual size’ body images to correspond less to their ideal body image in comparison to controls and thus were less satisfied with their current body shape. Overall, anorectic subjects exhibited a thinner ideal body size in relation to their perceived body size while overestimating their current real body size. Brain activity in the left insula, the right frontal cortex, the right posterior parietal cortex and precuneus was modulated by the two different tasks (satisfaction rating versus body size estimation) and by the distortion level of the self-images (thinner, about actual size, fatter) and, importantly, by group (anorexia versus control). Subjects with anorexia nervosa demonstrated stronger activation of the insula and the lateral anterior prefrontal cortex in the satisfaction rating for the thinner self-images, whereas the control group showed a stronger recruitment of precuneus during body size estimation for the fatter images. Thus, we were able to separate the two different dimensions of body image behaviorally and find neural correlates with different task-specific involvements for anorectic patients and healthy controls.
We hypothesized that patients with anorexia would have a higher discrepancy between perceived and ideal perception (Fallon & Rozin, Reference Fallon and Rozin1985). In the present study, anorectic patients tended to show higher discrepancies between their ideal and perceived body shape in comparison to controls (trend). Furthermore, patients rated their ‘about actual size’ body images with lower satisfaction scores than controls. More negative attitudes towards their actual body shape could also be confirmed by the FKB-20 questionnaire for the anorectic subjects. Even though patients in our current sample had a low mean BMI of 15.9, their about actual sized body shapes did not fit their ideal. Interestingly, anorectic subjects and controls both demonstrated a strong negative evaluation of fatter self-images without showing a difference between these groups. This is surprising, because anorexia is defined by ‘intense fear of gaining weight or becoming fat’ (APA, 2000, p. 316), but it seems that the healthy controls also suffered from this fear.
Two brain regions, the left insula and the right anterior middle frontal gyrus (BA 10), were differentially modulated in anorectic and control subjects for the satisfaction rating task. Anorectic patients demonstrated a higher activation of the left insula for the thin condition in the satisfaction rating, in contrast to the thin condition in the body size estimation task. Insula activation has often been identified with emotional and interoceptive awareness (for a review see Craig, Reference Craig2009) and for a wide range of emotions including disgust (Zald & Pardo, Reference Zald and Pardo2000; Fitzgerald et al. Reference Fitzgerald, Posse, Moore, Tancer, Nathan and Phan2004) and aversion (Nitschke et al. Reference Nitschke, Dixon, Sarinopoulos, Short, Cohen, Smith, Kosslyn, Rose and Davidson2006), but also happiness (Johnstone et al. Reference Johnstone, van Reekum, Oakes and Davidson2006, for a review see Phan et al. Reference Phan, Wager, Taylor and Liberzon2004). This could imply that the insula activity in our study was associated with a stronger experience of emotions by the patient group while viewing the thinner self-images. The behavioral data indicated that the anorectic subjects had higher discrepancies between perceived and ideal body size (they would like to be thinner) compared to controls. It could be speculated that the higher activity of the insula for thin self-images in the anorectic group is a consequence of higher emotional valence of the thinner self-images.
It is also established that anorectic patients suffer from a deficit in interoception of internal body states and emotions (Fassino et al. Reference Fassino, Pierò, Gramaglia and Abbate-Daga2004; Pollatos et al. Reference Pollatos, Kurz, Albrecht, Schreder, Kleemann, Schöpf, Kopietz, Wiesmann and Schandry2008). Thus, the higher activation of the left insula during the satisfaction rating for the thin self-images could also be related to a deficit in interoception of emotional processing and visceral conditions. Possibly, anorectic subjects had to compensate for this deficit by a higher recruitment of the insula during the comparison of the ideal self-body shape with the ‘close to ideal’ thin body images.
A comparable activation pattern could also be observed for the right middle frontal gyrus. Anorectic patients demonstrated a higher activation of this cluster for the thin condition in the satisfaction rating, in contrast to the thin condition in the body size estimation task. Insula and also anterior lateral prefrontal cortex activation has been identified with interoceptive awareness (for a review see Craig, Reference Craig2009). Moreover, anterior lateral and medial frontal regions have been related to the reward or affective value of stimuli (Tremblay & Schultz, Reference Tremblay and Schultz1999; for a review see Rolls & Grabenhorst, Reference Rolls and Grabenhorst2008). The existing high activation in the lateral anterior prefrontal cortex for anorectic patients could thus be a result of a higher affective value towards the thinner self-images.
Furthermore, apart from an emotional deficit, patients with anorexia nervosa were found to overestimate their own body size, in contrast to controls. These results support our hypothesis and the findings of other studies (Molinari, Reference Molinari1995; Gardner & Bokenkamp, Reference Gardner and Bokenkamp1996; Lautenbacher et al. Reference Lautenbacher, Kraehe and Krieg1997; Gila et al. Reference Gila, Castro, Toro and Salamero1998; Smeets & Kosslyn, Reference Smeets and Kosslyn2001).
Our results show an interaction between group, distortion level and body size estimation in the right precuneus. In the patient group, no activation differences for image distortion levels and tasks were found, whereas the control group demonstrated a linear modulation of the BOLD signal by the distortion levels of the self-images during the body size estimation task. Control subjects further exhibited a stronger recruitment of this area for the fatter images during body size estimation, in contrast to the satisfaction rating. These complex results could correspond to the conflicting findings of increased or decreased activation in posterior parietal regions for patients with anorexia nervosa (Wagner et al. Reference Wagner, Ruf, Braus and Schmidt2003; Uher et al. Reference Uher, Murphy, Friederich, Dalgleish, Brammer, Giampietro, Phillips, Andrew, Ng, Williams, Campbell and Treasure2005). However, such comparisons are restricted by the fact that the paradigms used differ from each other. The posterior parietal cortex and precuneus are related to the multimodal coding of body schema (Schwoebel & Coslett, Reference Schwoebel and Coslett2005). Alterations in these areas have been found to be associated with distortions in spatial body relationships and motor behavior (Sirigu et al. Reference Sirigu, Grafman, Bressler and Sunderland1991). The observed activation pattern in the precuneus could be related to the body size estimation bias in patients with anorexia and this region might be an area coding the spatial extensions of the self-image. These results show that the precuneus activity in the control group is modulated by the levels of distortion in the body size estimation task and thus might play a direct role in differentiating between the thinner, about actual and fatter self-images. Conversely, this modulation is absent in the anorectic subjects, which hints at a neuronal correlate of the body size overestimation bias that those subjects present. Another impressive interaction between task, group and level of distortion occurred in a second cluster in the posterior parietal cortex [left hemisphere (LH) BA 5/BA 7]. This result could provide additional evidence for a deficit in retrieval of multimodal coded spatial body schema in the posterior parietal cortex in the anorectic group. However, the reported cluster is located at the border between the primary/secondary somatosensory and multimodal association cortex. Therefore, we did not perform further investigation of this area and excluded it from subsequent interpretation.
One possible limitation in the interpretation of the current results is the heterogeneous antidepressant medication of some anorectic subjects. Uncontrolled effects of medication can be problematic in pathological group samples and we were unable to rule them out in the present experiment.
Conclusion
Our results provide behavioral evidence for a processing bias of anorectic subjects in both body satisfaction rating and body size estimation task. Furthermore, the subjects with anorexia nervosa demonstrated stronger activation of the insula and the lateral anterior prefrontal cortex in the satisfaction rating for the thinner self-images. This indicates a stronger emotional involvement by the task. The modulation in the precuneus of the healthy controls differentiating between the sizes of body images during the body size estimation task and the absence of exactly this modulation in anorectic subjects corroborates the hypothesis that anorectic patients suffer from a deficit in retrieval of multimodal coded spatial body schema. It could be this deficit that is mainly responsible for the body size overestimation that is found behaviorally. Further investigation using parametric modulation of subjects' individual responses is needed to clarify the role of the precuneus in spatial body image.
Some studies have suggested that the deficit in body size estimation is pronounced in subgroups of patients with anorexia nervosa (Probst et al. Reference Probst, Vandereycken, Coppenolle and Pieters1998). This population also shows broader and more intensive symptoms. Thus, a further important step in research would be the comparison of patients with anorexia nervosa characterized by negative evaluation of the own body with subgroups marked by a pronounced body size estimation bias with fMRI. The present results show that anorectic subjects exhibit two distinct deficits in body image representations and that specific associated neuronal correlates can be identified. As a result, the two aspects of body image should be carefully addressed in developing differentiated treatments.
Acknowledgments
We thank D. Hummel and K.-H. Untch for helpful discussions that led to the design of the experiments. The study was conducted without external funding.
Declaration of Interest
None.