


1. INTRODUCTION
Propagation of intense laser pulses at relativistic intensities through plasmas is of much interest in basic studies of laser–plasma interaction (LPI) and in its many potential applications (Yu et al., Reference Yu, Shukla and Spatschek1978; Reference Yu, Bychenkov, Sentoku, Yu, Sheng and Mima2000; Chen et al., Reference Chen, Sarkisov, Maksimchuk, Wagner and Umstadter1998; Fuchs et al., Reference Fuchs, Malka, Adam, Amiranoff, Baton, Blanchot, Héron, Laval, Miquel, Mora, Pépin and Rousseaux1998; Reference Fuchs, Sentoku, Karsch, Cobble, Audebert, Kemp, Nikroo, Antici, Brambrink, Blazevic, Campbell, Fern¨¢ndez, Gauthier, Geissel, Hegelich, Pépin, Popescu, Renard-LeGalloudec, Roth, Schreiber, Stephens and Cowan2005; Mourou et al., Reference Mourou, Tajima and Bulanov2006; Zhou & He, Reference Zhou and He2007; Hoffmann, Reference Hoffmann2008; Norreys, Reference Norreys2009; Norreys et al., Reference Norreys, Scott, Lancaster, Green, Robinson, Sherlock, Evans, Haines, Kar, Zepf, Key, King, Ma, Yabuuchi, Wei, Beg, Nilson, Theobald, Stephens, Valente, Davies, Takeda, Azechi, Nakatsutsumi, Tanimoto, Kodama and Tanaka2009; Qiao et al., Reference Qiao, Kar, Geissler, Gibbon, Zepf and Borghesi2012), ranging from compact particle sources to new light sources, as well as for fast ignition in inertial confinement fusion. High-intensity laser beams propagating in underdense plasma can undergo self-focusing, self-channeling, as well as filamentation if its power exceeds the critical power P cr~17(ωL/ωp)2 GW, where ωL and ωp are the laser and plasma frequencies, respectively.
Self-focusing and self-channeling of relativistic laser pulse in plasmas have been extensively investigated both experimentally and numerically (Pukhov & Meyer-ter-Vehn, Reference Pukhov and Meyer-ter-Vehn1996; Borghesi et al., Reference Borghesi, MacKinnon, Barringer, Gaillard, Gizzi, Meyer, Willi, Pukhov and Meyer-ter-Vehn1997; Naseri et al., Reference Naseri, Bychenkov and Rozmus2010; Reference Naseri, Pesme, Rozmus and Popov2012; Nilson et al., Reference Nilson, Mangles, Willingale, Kaluza, Thomas, Tatarakis, Clarke, Lancaster, Karsch, Schreiber, Najmudin, Dangor and Krushelnick2010; Sylla et al., Reference Sylla, Flacco, Kahaly, Veltcheva, Lifschitz, Malka, dHumières, Andriyash and Tikhonchuk2013; Wang et al., Reference Wang, Lin, Sheng, Liu, Zhao, Guo, Lu, He, Chen and Yan2013). In the LPI, the laser ponderomotive force expels the electrons from the affected plasma region. The relativistic nonlinear Schrödinger equation (RNSE) that takes into account the relativistic ponderomotive effects has often been used for theoretical and numerical investigations of intense LPI in underdense plasmas (Sun et al., Reference Sun, Ott, Lee and Guzdar1987; Kurki-Suonio et al., Reference Kurki-Suonio, Morrison and Tajima1989; Borisov et al., Reference Borisov, Borovskiy, Shiryaev, Korobkin, Prokhorov, Solem, Luk, Boyer and Rhodes1992; Reference Borisov, Borovskiy, Mcpherson, Boyer and Rhodes1995; Chen & Sudan, Reference Chen and Sudan1993; Feit et al., Reference Feit, Komashko, Musher, Rubenchik and Turitsyn1998; Hafizi et al., Reference Hafizi, Ting, Sprangle and Hubbard2000; Cattani et al., Reference Cattani, Kim, Anderson and Lisak2001; Kim et al., Reference Kim, Tushentsov, Cattani, Anderson and Lisak2002; Qiao et al., Reference Qiao, Lai, Zhou, He and Wang2007a; Reference Qiao, Lai, Zhou, He, Wang and Yu2007b). In the existing works, one usually considers lasers of circular cross-section with Gaussian radial intensity profile. However, in the experiments the laser cross-section is often non-circular, and their propagation characteristics can be quite different from that of the circular ones (Chen & Sudan, Reference Chen and Sudan1993). It is therefore of interest to investigate the effect of the radial laser profile on the propagation of intense lasers. In this paper, we consider the propagation of a relativistic laser beam of elliptic cross-section in underdense plasma. It is found that for certain parameter ranges the radial laser profile can become circularly symmetric and self-similar, regardless of its initial radial profile.
2. RNSE AND ITS BASIC PROPERTIES
If the duration τ of the laser pulse satisfies τi≫τ≫τe, where τi and τe are the characteristic times of the ion and electron motion, the ion dynamics can be neglected. The electric field E of a circularly polarized laser propagating in a cold homogeneous plasma is given by RNSE (Sun et al., Reference Sun, Ott, Lee and Guzdar1987; Kurki-Suonio et al., Reference Kurki-Suonio, Morrison and Tajima1989; Borisov et al., Reference Borisov, Borovskiy, Shiryaev, Korobkin, Prokhorov, Solem, Luk, Boyer and Rhodes1992; Reference Borisov, Borovskiy, Mcpherson, Boyer and Rhodes1995; Chen & Sudan, Reference Chen and Sudan1993; Feit et al., Reference Feit, Komashko, Musher, Rubenchik and Turitsyn1998; Hafizi et al., Reference Hafizi, Ting, Sprangle and Hubbard2000; Cattani et al., Reference Cattani, Kim, Anderson and Lisak2001; Kim et al., Reference Kim, Tushentsov, Cattani, Anderson and Lisak2002; Qiao et al., Reference Qiao, Lai, Zhou, He and Wang2007a; Reference Qiao, Lai, Zhou, He, Wang and Yu2007b)
 $$2i{k_{\rm L}}\displaystyle{{\partial} \over {{\partial} z}}E + {\rm \nabla} _ \bot ^2 E + k_{\rm p}^2 \left( {1 - \displaystyle{n \over {\rm \gamma}}} \right)E = 0, $$
in the frame moving at the laser group velocity, where z is the laser propagation direction and ⊥ denotes the transverse direction, k L is the laser wave vector, k p=ωp/c, c is the vacuum light speed, n = n e/n 0 is the normalized electron density, n 0 is the background plasma density, 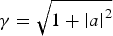 ${\rm \gamma} = \sqrt {1 + \left\vert a \right\vert^2} $ is the relativistic parameter of an electron in a circularly polarized laser field, a = eE/m eωLc is the normalized electric field, and m e is the electron rest mass. The electron density is given by
 $$n = 1 + k_{\rm p}^{ - 2} {\rm \nabla} _ \bot ^2 {\rm \gamma}, $$
which is valid for  $1 + k_{\rm p}^{ - 2} {\rm \nabla} _ \bot ^2 {\rm \gamma} \gt 0$. For
 $1 + k_{\rm p}^{ - 2} {\rm \nabla} _ \bot ^2 {\rm \gamma} \lt 0$, we usually replace n by 0 to ensure a positive density (Sun et al., Reference Sun, Ott, Lee and Guzdar1987). However in this case, the charge is not fully conserved in the presence of electron cavitation, which may make the quantitative results unreliable (Feit et al., Reference Feit, Komashko, Musher, Rubenchik and Turitsyn1998; Hafizi et al., Reference Hafizi, Ting, Sprangle and Hubbard2000; Cattani et al., Reference Cattani, Kim, Anderson and Lisak2001; Kim et al., Reference Kim, Tushentsov, Cattani, Anderson and Lisak2002). To ensure the charge conservation (CC), that is, ∫(n−1)dxdy = 0, one more condition should be satisfied
 $$ - k_{\rm p}^{- 2} {{\rm \nabla}_\bot}{\rm \gamma} = R/2, $$
where R refers to the radius of the cavitation channel. However, Eqs. (1–3) cannot be used for simulation by itself. To make Eq. (1) consistent with the additional condition (3), a finite electron temperature T e can be taken into account and then the electron density can be rewritten as (Feit et al., Reference Feit, Komashko, Musher, Rubenchik and Turitsyn1998)
 $$n = 1 + k_{\rm p}^{ - 2} {\rm \nabla} _ \bot ^2 ({\rm \gamma} + {\rm \alpha} {\rm lo}{{\rm g}_{\rm e}}n), $$
where α = T e/m ec 2 is the normalized electron temperature. In this case, a positive electron density is naturally ensured, as well as the CC condition. It is noted that the above equation is only valid for α≪1, which means that the thermal motion of electrons is non-relativistic.
For Eq. (1), there are infinite number of conserved quantities. The first invariant is the laser power P = ∫|a|2dxdy. If we assume that there is no electron cavitation initially, that is,  $1 + k_{\rm p}^{ - 2} {\rm \nabla} _ \bot ^2 {\rm \gamma} \gt 0$, the Hamiltonian can be expressed as
 $H =$
 $\int [\left\vert {\rm \nabla} _ \bot a \right\vert ^{2} - k_{\rm p}^2 \left( {{\rm \gamma} - 1} \right) ^{2} - \left\vert {\rm \nabla} _ \bot {\rm \gamma} \right\vert ^{2}]{\kern 1pt} \,dx\,dy$. Then the evolution of the laser spot r 2≡∫(x 2+y 2)|a|2dxdy/P is given by
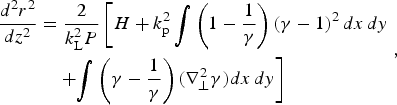 $$\eqalign{\displaystyle{{{d^2}{r^2}} \over {dz^2}} & = \displaystyle{2 \over {k_{\rm L}^2 P}} \left[ {H + k_{\rm p}^2 \int \left( {1 - \displaystyle{1 \over {\rm \gamma}}} \right)({\rm \gamma} - 1)^2 \,dx\,dy}\right. \cr & \quad \left.+{ \int \left( {{\rm \gamma} - \displaystyle{1 \over {\rm \gamma}}} \right)({\rm \nabla} _ \bot ^2 {\rm \gamma} )dx\,dy} \right]}, $$
where the last term on the right-hand side is due to the charge displacement driven by the ponderomotive force. When the right-hand side of Eq. (5) is less than zero, self-focusing can take place. For the non-relativistic case, that is, a≪1, Eq. (5) reduces to
 $$\displaystyle{d{^2}r{^2} \over dz{^2}} = \displaystyle{2H \over k_{\rm L}^2 P}$$
with
 $$H = \int \bigg[ {\bigg\vert {{\rm \nabla} _ \bot} a{\bigg\vert ^2} - \displaystyle{{k_{\rm p}^2} \over 4}\bigg\vert a{\bigg\vert ^4}} \bigg]dx\,dy.$$
3. SELF-SHAPING OF A RELATIVISTIC ELLIPTICALLY GAUSSIAN LASER BEAM
For an initially elliptic Gaussian beam  $a(x,y,0) = {a_0}\exp [ - {x^2}/$
 $r_1^2 - {y^2}/r_2^2 ]$, we can obtain the mean-square radius of the laser beam as
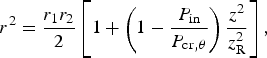 $${r^2} = \displaystyle{{{r_1}{r_2}} \over 2}\left[ {1 + \left( {1 - \displaystyle{{{P_{{\rm in}}}} \over {{P_{{\rm cr},{\rm \theta}}}}}} \right)\displaystyle{{{z^2}} \over {z_{\rm R}^2}}} \right],$$
where z R = k Lr 1r 2/2 is the Rayleigh length, P cr,θ = P cr·((θ+1/θ)/2) is the critical power for self-focusing, and θ = r 2/r 1(≥1) is the ellipticity of the laser spot. Self-focusing occurs when P in > P cr,θ. The corresponding self-focusing distance ( ${z_{\rm f}} \approx {z_{\rm R}}$
 $\sqrt {({P_{{\rm in}}}/{P_{{\rm cr},{\rm \theta}}} ) - 1} $) is thus enhanced with increasing initial ellipticity. For the relativistic case, Eq. (5) does not lead to an analytical expression for r. However, one can easily solve Eq. (5) numerically.
We now solve the laser envelop Eq. (1) and the plasma density Eq. (4) numerically (He & Zhou, Reference He and Zhou1993; Zhou & He, Reference Zhou and He1994; Zhou et al., Reference Zhou, He and Cai1994; Huang et al., Reference Huang, Zhou and He2013). For the non-relativistic case, Eq. (1) reduces to the standard cubic nonlinear schrödinger equation (NSE), for which the Townes profile has been obtained numerically and experimentally (Gross & Manassah, Reference Gross and Manassah1992; Fibich & Ilan, Reference Fibich and Ilan1999; Moll et al., Reference Moll, Gaeta and Fibich2003; Dudley et al., Reference Dudley, Finot, Richardson and Millot2007). The input laser beam is modeled by an elliptic Gaussian profile
 $$a(x,y,z = 0) = {a_0}(1 + {\rm \varepsilon} ){e^{ - \left( {\displaystyle{{{x^2}} \over {r_0^2 {\rm \theta}}} + \displaystyle{{y^2} \over {r_0^2 /{\rm \theta}}}} \right)}}, $$
where  ${a_0} = 8.85 \times {10^{ - 10}}\sqrt {{I_0}{{\rm \lambda} ^2}({\rm Wc}{{\rm m}^{ - 2}}{\rm \mu} {{\rm m}^2})/2} $, I 0 is the peak laser intensity, r 0 is the initial beam waist, θ is the initial beam ellipticity, and ε denotes the random noise added to the profile, given by random numbers from the computer. In our simulation, the central laser wavelength is assumed to be 1 μm and initial beam waist is 6 μm. In addition, we consider the laser power (
 ${P_{{\rm in}}} = {I_0}{\rm \pi} r_0^2 /2$) ranges from 1P cr to 20P cr and the initial plasma density is 0.02n c, where n c is the critical plasma density. The normalized electron temperature is set as α = 0.02. The maximum noise level is max(ε) ⩽ 0.1.
A solution of Eqs. (1) and (4) corresponding to P in/P cr = 1.9 and r 0k p = 5.3 is shown in Figure 1. Figure 1a–1c present the propagation behavior of an initial randomly distorted circular beam. It is shown that the beam profile gradually becomes smooth during the self-focusing process and the peak laser intensity reaches its largest value at z ≈ 120 μm. We also consider the elliptical cases with θ = 1.5 and 3, respectively, as shown in Figure 1d–1i. It can be seen from Figure 1f and 1i that even if the initial beam is highly elliptical and randomly distorted, a smooth and circular beam can still be produced by the self-focusing process in plasmas. Such a behavior would be of great interest for laser shaping applications.
Evolution of different elliptical Gaussian laser beams with an initial 10% random noise in transverse space. (a–c) are the intensity patterns at different propagation distances for θ = 1, (d–f) are for θ = 1.5, and (g–i) are for θ = 3. The unit of laser intensity is W/cm2. The displayed space scale is 30 × 30 μm and the simulation box is 50 × 50 μm. The normalized electron temperature is set as α = 0.02 in the simulations.

The shaping process can be understood from the distribution of the refractive index η = (1−(n e/n cγ))1/2 and its gradient in transverse place represents the direction of laser energy flow. For an initially circular beam (θ = 1), gradient of the refractive index can be expressed as |∇ ⊥η| = (dη/dr), suggesting that the energy flow is isotropic, as shown in Figure 2a, and the radial shape shall keep on circular during the propagation process. However, for the elliptical case with θ > 1,
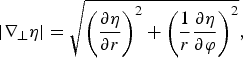 $$\left\vert {{\rm \nabla} _ \bot} {\rm \eta} \right\vert = \sqrt {{{\left( {\displaystyle{{{\partial} {\rm \eta}} \over {{\partial} r}}} \right)}^2} + {{\left( {\displaystyle{1 \over r}\displaystyle{{{\partial} {\rm \eta}} \over {{\partial} \rm \varphi}}} \right)}^2}}, $$
where φ is the angular variable and the anisotropic part (∂η/∂φ) contributes to the change of the radial shape from an elliptical case to a circular case. Specially, it is shown from Figure 2b that due to stronger ponderomotive force, electrons are piled up in the minor axis at first and the steep electron walls can provide strong focusing effect to confine the laser energy in the minor axis. A balance between the diffraction and the focusing effect can be first achieved in the minor axis and the peripheral energy would converge into the major axis, as shown in Figure 2b. Then at the self-focusing distance, the intensity profile gradually evolves into a circular shape, in which the nonlinear focusing effect and diffraction precisely balance each other. On the other hand, we can understand the self-shaping process in microscopic view by considering the motion of electrons in transverse place. Once the initial laser beam profile is deviated from the circular case, the resulting anisotropic distributed electrons will induce an additional circumferential electric field, and it is noted that such an electric field tends to make the electrons be isotropic distributed, which in turn would self-consistently modulate the radial profile of the laser beam to a circular shape. Our simulations further demonstrate that the self-shaping process is periodic and the circular profile is produced at each self-focusing point. In addition, it is seen from Figure 1 that the self-focusing distance increases with the ellipticity of the input laser beam, that is, the farther the initial beam deviates from the circular case, the longer the beam has to propagate in order to have the circular profile. This result is in good agreement with our theory given earlier.

To further describe the physical processes of our three cases as shown in Figure 1, we in Figure 3 give a detailed comparison of different radial profiles of the intensity patterns. It is seen from Figure 3a that the central portions of the laser beams are of a circular shape at the self-focusing distance and they almost overlap together for different elliptical cases, suggesting that the self-focusing process in plasmas is self-similar, that is, the output beam profile after the self-shaping process is not relevant to the initial laser beam profile. However, it is noted that the periphery of the beam in the transverse directions cannot completely overlap (see Fig. 3b) for the θ > 1 case due to the anisotropic diffraction (Gross & Manassah, Reference Gross and Manassah1992; Fibich & Ilan, Reference Fibich and Ilan1999; Moll et al., Reference Moll, Gaeta and Fibich2003; Dudley et al., Reference Dudley, Finot, Richardson and Millot2007).
(a) is the profile of the normalized electric field and plasma density along X-axis for different elliptical cases, which are corresponding to the intensity patterns shown in Figure 1c, 1f, and 1i. (b) gives a comparison of intensity profiles shown in Figure 1i along two different directions with the soliton solution of Eq. (7) for θ = 3. Panels (c) and (d) are, respectively, the scalings of the amplitude and the normalized radius of the self-similar profile with different input powers, where the circles in the figures are numerical results from Eqs. (1) and (4) for θ = 3 case and the solid line is theoretical results computed from Eq. (7), where the blue one corresponds to case without CC and the red one corresponds to case with CC [Eq. (8)]. a e,0 and ρe,0 in the figures denote the amplitude and normalized radius of the lowest eigenmode respectively.

The self-similar profile as shown in Figure 3a and 3b is associated with their corresponding stationary solutions. For Eq. (1), an axisymmetric stationary solution can be expressed as  $a(r,z) = {a_{\rm s}}(r)exp[i(k_{\rm p}^2 /2{k_{\rm L}})(1 - S)z]$, where a(r,z) is the normalized electric field as defined above and S is a real constant parameter. Substituting it into Eq. (1) we can obtain the eigen equation for a s
 $$\left( {\displaystyle{d^2 \over dr^2} + \displaystyle{1 \over r}\displaystyle{d \over {dr}}} \right){a_{\rm s}} + k_{\rm p}^2 {\left( {S - \displaystyle{n \over \sqrt {1 + \left\vert a_{\rm s} \right\vert ^2}}} \right)} {a_{\rm s}} = 0. $$
In addition, a s is subject to the boundary conditions
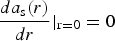 $$\displaystyle{{da_{\rm s}(r)} \over {dr}} \vert_{{\rm r} = 0} = 0$$
and limr→∞a s(r) = 0. The condition 0 < S < 1 should also be satisfied to obtain a non-zero solution. Considering the cavitation case (P in/P cr > 1.1), we can then separate Eq. (7) into two parts. In the region without electron cavitation, Eq. (7) can be expressed as
 $$\left( {\displaystyle{d^2 \over dr^2} + \displaystyle{1 \over r}\displaystyle{d \over {dr}}} \right){a_{\rm s}} + k_{\rm p}^2 {\left( {S - \displaystyle{1 \over \sqrt {1 + \left\vert a_{\rm s} \right\vert ^2}}} \right)} {a_{\rm s}} = 0.$$
and its asymptotic solution at infinity can be written as  ${a_{\rm s}}(r \to \infty ) = {\rm \beta} \sqrt {1/({\rm \kappa} {k_{\rm p}}r)} {e^{ - {\rm \kappa} {k_{\rm p}}r}}$, where β is a real constant parameter and
 ${\rm \kappa} = \sqrt {1 - S} $. In the region with electron cavitation (r < R), Eq. (7) is replaced by
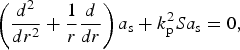 $$\left( {\displaystyle{{{d^2}} \over {d{r^2}}} + \displaystyle{1 \over r}\displaystyle{d \over {dr}}} \right){a_{\rm s}} + k_{\rm p}^2 S{a_{\rm s}} = 0,$$
and its solution is simply the zeroth-order Bessel function a s(r) = a s(0)J 0(S 1/2k pr). To ensure the CC, the condition (3) should also be satisfied at the boundary R. By inserting a s(R) into Eq. (3), we have the amplitude a s(0) as a function of S and R (Cattani et al., Reference Cattani, Kim, Anderson and Lisak2001)
 $${a_{\rm s}}{(0)^2} = \displaystyle{{k_{\rm p}^2 {R^2}} \over {8SJ_1^2 (\sqrt S {k_{\rm p}}R)}}\left( {1 + \sqrt {1 + \displaystyle{{16SJ_1^2 (\sqrt S {k_{\rm p}}R)} \over {{R^2}J_0^2 (\sqrt S {k_{\rm p}}R)}}}} \right), $$
where J 1 refers to the first-order Bessel function. Then the lowest eigenmode solution in Eq. (7) can be obtained numerically using the shooting method. It can be seen from Figure 3c and 3d that if the total CC is satisfied, the lowest eigenmode solution possesses a lower amplitude and a wider channel radius at a fixed laser power. On the other hand, it was showed that the lowest eigenmode can act as a soliton and maintain its shape when the soliton-like beam propagates through the plasmas (Sun et al., Reference Sun, Ott, Lee and Guzdar1987; Kurki-Suonio et al., Reference Kurki-Suonio, Morrison and Tajima1989). For the system with soliton solutions, it is well known that if the initial state is slightly different from the soliton solution, the beam profile would oscillate around the stable state. In our case, it is shown from Figure 3b that the central portion of the self-shaped profile is in a good match with the soliton solution of Eq. (7). Furthermore, in Figure 3c and 3d, we give a comparison of the amplitude [a f(0)] and the radius of the self-similar beam 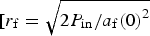 $[{r_{\rm f}} = \sqrt {2{P_{{\rm in}}}/{a_{\rm f}}{{(0)}^2}} $] with the corresponding theoretical values of the lowest eigenmode of Eq. (7) at different input powers. It is shown that our numerical results agree well with our theoretical results. In addition, it is noted that the numerical results computed from the thermal correction model [Eqs. (1) and (4)] match well with the lowest eigenmode solution considering the CC instead of the non-conservation case. Such a conclusion is suitable for α < 0.1. Our scalings of both the amplitude of the self-similar profile a f(0) and the normalized radius r fωp/c with the normalized power (P in/P cr) clearly demonstrate that the self-similar behavior shown in Figure 1 is actually determined by the lowest eigenmode in Eq. (7). In other words, during the self-focusing process the intensity profile of the laser beam would asymptotically evolve into its corresponding eigenmode. The soliton-like eigenmode then acts as a robust attractor to make the self-shaping process occur spontaneously.
Now some illustrations on the university of the self-similar behavior should be made. It had been found that for relativistic laser pulses propagating in underdense plasmas, its propagation behavior mainly depends on two dimensionless parameters, that is, the normalized radius (r 0ωp/c) and the normalized power (P in/P cr) of the input laser beam (Borisov et al., Reference Borisov, Borovskiy, Shiryaev, Korobkin, Prokhorov, Solem, Luk, Boyer and Rhodes1992; Reference Borisov, Borovskiy, Mcpherson, Boyer and Rhodes1995). The stability map for an initial circularly distributed relativistic laser beam propagating in underdense plasmas is shown in Figure 4. It is demonstrated that the laser beam would suffer from the filamentation instability and break up into serval filaments when both the radius and power of the beam are large enough, as shown in the inset. While the yellow region in Figure 4 corresponds to the stable region and it is noted that the self-similar behavior only occurs in this region, that is, an initial arbitrary shaped laser beam in the yellow region would collapse towards its corresponding soliton solution for a fixed normalized laser power (P in/P cr).
Stability map for the propagation of an initial circularly distributed relativistic Gaussian beam in homogeneous underdense plasmas, where the lower boundary is the radius of the lowest eigenmode in Eq. (7) considering the CC [Eq. (8)] and the left boundary refers to the condition of electron cavitation (P in > 1.1P cr). The horizontal axis is the normalized laser power and the longitudinal axis is the normalized radius of the input laser beam. The yellow region in the map corresponds to the stable region with single filament and the above blank region is the unstable region with multiple filaments. An example of the multiple filament patterns corresponding to the B point is shown in the inset.

Understanding the self-shaping mechanism of self-focusing laser beams propagating in plasmas is not only of fundamental interest but is also important for many applications in LPI (Yu et al., Reference Yu, Shukla and Spatschek1978; Reference Yu, Bychenkov, Sentoku, Yu, Sheng and Mima2000; Chen et al., Reference Chen, Sarkisov, Maksimchuk, Wagner and Umstadter1998; Fuchs et al., Reference Fuchs, Malka, Adam, Amiranoff, Baton, Blanchot, Héron, Laval, Miquel, Mora, Pépin and Rousseaux1998; Reference Fuchs, Sentoku, Karsch, Cobble, Audebert, Kemp, Nikroo, Antici, Brambrink, Blazevic, Campbell, Fern¨¢ndez, Gauthier, Geissel, Hegelich, Pépin, Popescu, Renard-LeGalloudec, Roth, Schreiber, Stephens and Cowan2005; Mourou et al., Reference Mourou, Tajima and Bulanov2006; Zhou & He, Reference Zhou and He2007; Hoffmann, Reference Hoffmann2008; Norreys, Reference Norreys2009; Norreys et al., Reference Norreys, Scott, Lancaster, Green, Robinson, Sherlock, Evans, Haines, Kar, Zepf, Key, King, Ma, Yabuuchi, Wei, Beg, Nilson, Theobald, Stephens, Valente, Davies, Takeda, Azechi, Nakatsutsumi, Tanimoto, Kodama and Tanaka2009; Qiao et al., Reference Qiao, Kar, Geissler, Gibbon, Zepf and Borghesi2012). Especially, many potential applications depend strongly on the beam quality, including the intensity and the transverse profile of the laser spot. For example, in relativistic laser-driven particle sources, the maximum proton energy driven by the target normal sheath acceleration mechanism (Mora, Reference Mora2003) as well as the temperature of hot electrons accelerated from a solid target (Wilks et al., Reference Wilks, Kruer, Tabak and Langdon1992) is scaled as ∝ I 1/2. Furthermore, both the energy and angle spectra depend on the intensity and the transverse distribution of the laser spot (Mourou et al., Reference Mourou, Tajima and Bulanov2006; Zhou & He, Reference Zhou and He2007). Figure 1 shows that an initial elliptical laser beam can self-organize into a circularly symmetric self-similar smooth beam. The corresponding peak laser intensity is approximately enhanced by a factor of 4. In other words, the cut-off energy of the laser-accelerated protons and the temperature of hot electrons may be increased by a factor of approximately 2 if a proper underdense plasma is put in front of the solid target. The key is to ensure that the reshaped pulse has a higher intensity and a better radial profile before the laser beam interacts with the solid target.
4. CONCLUSIONS
In summary, self-focusing of a relativistic elliptical Gaussian laser beam in underdense plasmas with different values of the ellipticity is investigated. It is found that a self-similar, smooth, and circularly symmetric pattern of the self-shaped beam can be formed regardless of its initial radial profile. The transverse ponderomotive force of the elliptical laser beam in both short- and long axes can lead to the electrons being redistributed around the beam and self-shaping the laser field into a circular structure by nonlinear self-organization processes. Our theoretical results show that the central portion of the intensity profile of the self-shaped beam in self-focusing processes can approximately be described according to a soliton-like profile. Such a self-shaped laser pulse beam can be of many potential applications in relativistic high-energy density plasmas.
ACKNOWLEDGEMENTS
This work is supported by the National Natural Science Foundation of China (grant no. 91230205 and 11175026), the National Basic Research 973 Project, No. 2013CB834100, and the National High-Tech 863 Project. T. W. H. would like to thank H. Zhang, S. Z. Wu, F. L. Zheng, T. P. Yu, H. B. Zhuo, C. Z. Xiao, Q. Jia, D. Wu, H. Y. Wang, and B. Liu for their useful helps and discussions.



