Implications
An increase in somatic cell count (SCC) and total bacterial count (TBC) and a decrease in fat and protein content were observed during summer months. Critical climatic thresholds for milk composition have been established. Temperature–humidity index breakpoints for milk SCC, TBC, fat and proteins were established. The results of this study could be helpful to dairy cow producers, allowing them to adopt specific heat-abatement measures to counter the unfavourable consequences of heat stress at farm level.
Introduction
Climate change, defined as the long-term disbalance of customary weather conditions such as temperature, wind and rainfall characteristics of a specific region, is likely to be one of the main challenges mankind faces during the current century. The increasing concern with the thermal comfort of agricultural animals is justifiable not only for countries occupying tropical zones, but also for nations in temperate zones where high-ambient temperatures are becoming an issue (Nardone et al., Reference Nardone, Ronchi, Lacetera, Ranieri and Bernabucci2010).
Climatic conditions may affect the welfare and productive performance of livestock species. In dairy cows, high temperatures experienced during the hot season have an effect on physiology, metabolism, production and reproduction of the animal (Jordan, Reference Jordan2003; Bernabucci et al., Reference Bernabucci, Lacetera, Baumgard, Rhoads, Ronchi and Nardone2010). In some studies, seasonal variations in milk yield and composition have been investigated. Renna et al. (Reference Renna, Lussiana, Malfatto, Mimosi and Battaglini2010) compared the milk production of grazing cows recorded in 2003 and 2004. Those authors reported a decrease in milk, fat and protein yields during the summer months of the hottest year, 2003. Bouraoui et al. (Reference Bouraoui, Lahmar, Majdoub, Djemali and Belyea2002) observed a significant decrease in milk, fat and protein yield and a significant increase in the somatic cell count (SCC) of lactating Holstein cows during the summer (temperature–humidity index (THI)=78) compared with spring (THI=68). In a 4-year retrospective study conducted on Holstein cows, Olde Riekerink et al. (Reference Olde Riekerink, Barkema and Stryhn2007) analysed the seasonal variations in SCC in individual and bulk milk samples. The authors reported a significant increase in the SCC during August and September. In a study carried out in Israel, cows that calved in December produced the highest milk and milk protein yields, and those that calved in June produced the lowest, 92.8% of the maximum (Barash et al., Reference Barash, Silanikove, Shamay and Ezra2001). Information on THI milk fat and protein percentage and SCC relationships are scarce or lacking.
Reduction in milk production related to the increase in THI has been reported (Ravagnolo et al., Reference Ravagnolo, Misztal and Hoogenboom2000; West et al., Reference West, Mullinix and Bernard2003). Ravagnolo et al. (Reference Ravagnolo, Misztal and Hoogenboom2000) have observed a decrease of 0.009 kg and 0.012 kg in protein and fat yield, respectively, for each unit of THI above the threshold of 72. Our study carried out on Holstein cows housed in climatic chambers and exposed to THI=84 during the day and THI=78 during the night (Nardone et al., Reference Nardone, Lacetera, Ronchi and Bernabucci1992) highlighted a 25% decrease in milk yield and an 11.6% decrease in protein percentage, when compared with a control group exposed to thermo-neutral conditions (THI=65). Furthermore, on comparing milk production during summer and spring in a dairy herd located in central Italy, we found a lower milk yield (−10%), and also lower protein and casein percentages in summer (3.01% v. 3.31% and 2.18% v. 2.58%, respectively; Bernabucci et al., Reference Bernabucci, Lacetera, Ronchi and Nardone2002).
Most of the previous studies focused their attention on milk, protein and fat yield changes under hot conditions. To date, very little information is available in the literature regarding the seasonal variation of total bacterial count (TBC) and THI relationship for SCC, TBC, and fat and protein percentage. The study was thus aimed at investigating annual, seasonal and monthly variations in milk characteristics (SCC and TBC, fat and protein percentage) and THI–milk characteristics relationships in Holstein dairy farms.
Materials and methods
The retrospective studies described below (seasonal pattern and THI milk composition relationships study) were conducted on bulk tank milk tests recorded over a 7-year period (2003 to 2009) in Holstein dairy farms located in the Po valley (Region of Lombardy, North Italy), one of the most important areas in Europe for milk and cheese production. Italian Holstein cattle are an interesting case study because they represent a large and highly selected dairy cow population reared in a warm area of the Mediterranean basin, that is becoming one of the hot spots in the world, owing to climate change (Segnalini et al., Reference Segnalini, Nardone, Bernabucci, Vitali, Ronchi and Lacetera2010). Dairy farms located in the study area were highly homogeneous in terms of the production system adopted (intensive), the number of cows (110 cows in lactation on average), the genetic merit of cows, the average milk yield per cow (∼9000 kg/lactation in 305 days on average), and the barn design and management (total confinement free barn housing with no time at pasture, TMR feeding practices and year-round calving patterns). Moreover, ∼95% of the farms were provided with heat abatement measures. The following information was associated with each record reported: test date, farm code, SCC, TBC, fat and protein expressed as percentages (FA% and PR%, respectively).
Milk samples were analysed for SCC (5% and 8% intra- and inter-assay coefficients of variation, respectively) using a fluoro-opto-electronic counter (FossomaticTM FC, Foss, Hillerød Denmark), for TBC (11.9% and 18.4% intra- and inter-assay coefficients of variation, respectively) using a fluoro-opto-electronic counter (BactoScanTM FC, Foss, Hillerød Denmark), and for FA% (0.014 g/100 ml and 0.045 g/100 ml intra- and inter-assay coefficients of variation, respectively) and PR% (0.014 g/100 ml and 0.035 g/100 ml intra- and inter-assay coefficients of variation, respectively) using FTIR spectrophotometry (MilkoScanTM FT 6000, Foss, Hillerød Denmark). Bulk tank milk was analysed at farms twice a month under a milk-quality payment system.
The values referring to SCC and TBC, expressed as cells/ml and colony-forming units (cfu)/ml, respectively, were transformed. The SCC was transformed into somatic cell score (SCS) by means of the following formula (Ali and Shook, Reference Ali and Shook1980): SCS=[log2 (somatic cell count/100 000)+3], and TBC values were natural log-transformed (LnTBC). The corresponding thresholds for SCS and LnTBC are indicated in REGULATION (EC) No 853/2004, as shown: LnTBC of 11.51 corresponds to 1.105 cfu/ml (rolling geometric average over a 2-month period, with at least two samples per month); SCS of 5.00 corresponds to 4.105 cells/ml (rolling geometric average over a 3-month period, with at least one sample per month). Italian Law 169/89 fixes a lower SCC limit in its application in Ministerial Decree 185/91 for the commercialization of high-quality drinking milk: SCS of 4.58 corresponds to 3.105 cells/ml. It is as rolling geometric average over a 3-month period with at least two samples per month.
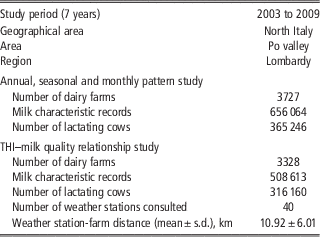
Data were tested for non-normality by the Shapiro test by using SAS 9.2 software package (SAS/STAT, 2008). The analysis of data distribution indicated that all parameters analysed followed a normal distribution (P<0.05). Complete descriptive statistics of the studies are reported in Table 1.
Descriptive statistics of the studies

THI=temperature–humidity index.
Seasonal pattern study
The seasonal pattern was studied by utilizing 656 064 milk composition data items recorded in 3727 dairy farms (365 246 lactating cows). The months of December, January and February were defined as winter; March, April and May as spring; June, July and August as summer; and September, October and November as fall. The annual, seasonal and monthly variation in bulk tank milk composition (SCS, LnTBC, FA% and PR%) were evaluated by means of a GLM where THI, SCS, LnTBC, FA% and PR% were set as dependent variables, and year, season and month as independent variables. Farm was included into the model and considered as random effect. The differences were analysed by the Tukey test and the significances were set at a value of P<0.05. The analysis was carried out using the SAS 9.2 software package (SAS/STAT, 2008).
THI relationship study
The study was carried out on 508 613 milk composition data items recorded in 3328 dairy farms (316 160 lactating cows). The National Reference Centre for Animal Welfare (Istituto Zooprofilattico Sperimentale Lombardia ed Emilia Romagna, Brescia, Italy) provided the latitude and longitude for all farms. The useful weather stations belonged to the following institutions: Regional Environmental Protection Agency of the Lombardy Region and the Research Unit for Agricultural Climatology and Meteorology (CRA-CMA). The distances between farms and 40 weather stations were calculated and each farm was associated with the nearest weather station, located within a minimum radius of 0.3 km and maximum radius of 30 km. The average distance between any given farm and weather station was 10.92±6.01 km. Supplementary Figure S1 displays a map of the study area where the weather stations and dairy farms are located.
Daily maximum temperature and minimum relative humidity and daily minimum temperature and maximum relative humidity data from the 40 weather stations were used to calculate maximum (maxTHI) and minimum (minTHI) daily THI, respectively. The maximum daily THI was chosen because it represents the worst environmental conditions experienced by the cows. Moreover, the maximum daily THI was also chosen in agreement with indication of Ravagnolo and Misztal (Reference Ravagnolo and Misztal2000) who found that maximum THI fits best to data from public weather stations, and with results by Brügemann et al. (Reference Brügemann, Gernand, König von Borstel and König2012) who indicated higher sensitivity of test-day milk yield to extreme values of maximum THI compared with daily average THI. The minTHI represents the night-time conditions. The THI was used for characterizing the climate conditions of the farms. The max and minTHI recorded 1, 2, 3, 4 and 5 days before the sampling date were attributed to each milk record. The best relationship between THI and milk parameters was found for the THI recorded 2 days before the sampling date with r-value of 0.92, 0.72, 0.93 and 0.97 for SCS, TBC, PR% and GR%, respectively. The maximum and minimum daily THI recorded 2 days before the sampling date were chosen for the THI relationship study.
The THI was calculated using the formula suggested by Kelly and Bond (Reference Kelly and Bond1971):
 $$\eqalign{{\rm THI}\,=\,({\rm 1}.{\rm 8}\,{\times}\,{\rm AT}\,{\plus}\,{\rm 32})\,-\,(0.{\rm 55}\,-\,0.{\rm 55}\, \,{\times}\, {\rm RH})\, \cr {\times}\,[({\rm 1}.{\rm 8}\,{\times}\,{\rm AT}\,{\plus}\,{\rm 32})\,-\,{\rm 58}];$$
where AT is the ambient temperature (°C), and RH is the relative humidity as a fraction of the unit.
The THI relationship analysis was based on the calculation of a two-phase linear regression procedure (Nickerson et al., Reference Nickerson, Facey and Grossman1989), which detected an inflection point (where one exists) in the relationship between max and minTHI, as the independent variable, and milk composition parameters, as the dependent variable. The following model was used:
 $$\eqalign{V_{{\rm 2}} \,=\,{\rm costant}\,{\plus}\,{\rm slope1}\,{\times}V_{{\rm 1}}\,{\plus}\,{\rm slope2}\cr\quad {\times}\left( {V_{{\rm 1}} \,{\minus}\,{\rm break}\,{\rm point}} \right){\times}\left( {V_{{\rm 1}} \,\gt \,{\rm break}\,{\rm point}} \right);$$
where V 1 is the independent variable and V 2 is the dependent variable.
The analysis was carried out using the Statistica 7.0 software package (StatSoft, 2004).
Results
THI pattern
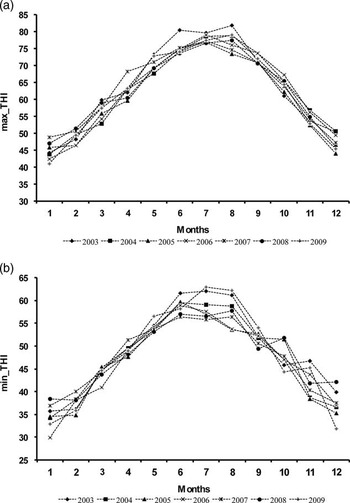
Changes in monthly maxTHI are reported in Figure 1a. In general, over the 7-year period (2003 to 2009), July was the hottest month with an average maxTHI of 77.8±3.6 (P<0.01). Within the period considered, 2003 was the hottest year (P<0.001) with an average monthly maxTHI of 80.4±3.5, 79.6±4.1 and 81.9±4.3 for June, July and August, respectively. Year 2005 was the coolest one with an average monthly maxTHI of 74.9±4.9, 76.8±4.6, 73.4±4.7 for June, July and August, respectively. The high-positive association between maximum and minimum daily THI was noted (Figure 1a and b).
Monthly least squares means (±s.e.m.) of the maximum (A) and minimum (B) temperature humidity index (THI) recorded during the 7-year period (from 2003 to 2009).

Annual, seasonal and monthly variations in milk composition
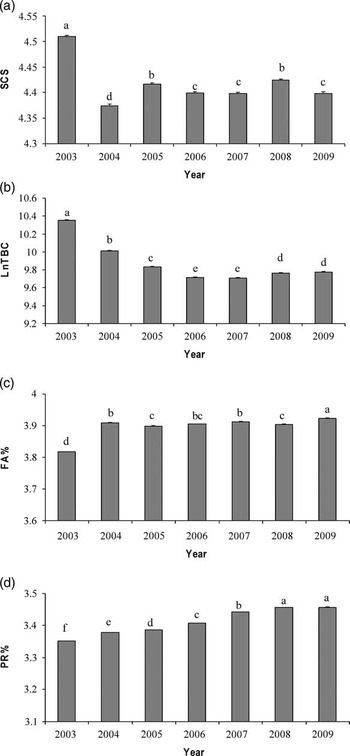
The model demonstrated a significant association (P<0.001) between year, season and month and the parameters analysed (SCS, LnTBC, FA%, PR%). Figure 2 reports the annual patterns of SCS, LnTBC, FA% and PR%. Year 2003 was the year with the highest (P<0.001) levels of SCS (4.50±0.79, corresponding to 331 570±232 649 cells/ml) and LnTBC (10.35±0.9, corresponding to 59 534±165 825 cfu/ml), as well as the lowest (P<0.001) levels of FA% (3.81±0.43) and PR% (3.35±0.17). Milk protein content increased (P<0.01) from 2003 to 2009.
Annual least squares means (±s.e.m.) in reference to the entire period of the study (from 2003 to 2009) for milk (a) somatic cell score (SCS), (b) natural log-total bacterial count (LnTBC), (c) fat percentage (FA%), and (d) protein percentage (PR%). a, b, c, d, e, f=P<0.01 between years.

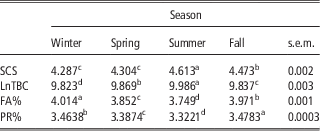
Of the seasons (Table 2), summer emerged as the most critical for all the parameters analysed, demonstrating the highest values (P<0.001) of SCS (4.61±0.74, corresponding to 349 489±23 581 cells/ml) and LnTBC (9.99±1.05, corresponding to 52 972±192 896 cfu/ml), and the lowest values (P<0.001) of FA% (3.75±0.35) and PR% (3.32±0.15) content.
Seasonal least squares means (±s.e.m.) of milk characteristics refer to the entire period of the study (2003 to 2009).
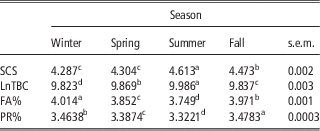
SCS=somatic cell score; LnTBC=natural log-total bacterial count; FA%=fat percentage; PR%=protein percentage.
a,b c,d P<0.01 between seasons.
Monthly and annual×month patterns are reported in Supplementary Figure S2 and S3, respectively. The monthly pattern identified July as the month with the most severe climatic conditions (P<0.001) for LnTBC, FA% and PR%, with average values of 10.00±1.04 (corresponding to 52 054±183 655 cfu/ml), 3.73±0.35 and 3.30±0.15, respectively. August emerged as the most critical month for SCS with an average value of 4.69±0.73 (corresponding to 369 503±228 377 cells/ml).
THI milk composition relationship
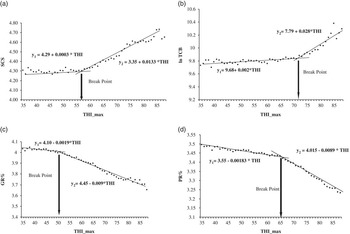
Results of the two-phase regression analysis computed for milk characteristics (SCS, LnTBC, FA% and PR%), with average daily maxTHI as the independent variable, are shown in Figure 3. The model indicated a break point at 57.3 (r=0.98) for SCS with a final loss of 0.034 (the lowest total sum of square errors). The model provided the slope and intercept of two distinct regression lines: the first line was Y 1=4.29+0.0003×THI (R 2 =0.0058; P=0.7) before the breakpoint (35 to 57.3 THI range); and the second line, after the breakpoint (57.3 and 88 THI range), was Y 2=3.55+0.0133×THI (R 2=0.95; P<0.001). A breakpoint was detected at 72.8 THI for LnTBC (r=0.96) with a final loss of 0.079 (the lowest total sum of square errors). The slope and intercept of two distinct regression lines were: Y 1=9.68+0.002×THI (R 2=0.41; P<0.01) before the breakpoint (35 to 72.8 THI range) and Y 2=7.79+0.028×THI (R 2=0.85; P<0.001) after the breakpoint (72.8 to 88 THI range).
Cow’s milk characteristics in relation to maximum temperature–humidity index (THI) recorded 2 days before sampling day. A breakpoint was detected at: 57.3 THI for (a) somatic cell score (SCS); 72.8 THI for (b) natural log-total bacterial count (LnTBC); 50.2 THI for (c) fat percentage (FA%); 65.2 THI for (d) protein percentage (PR%).

The two-phase regression computed for FA% indicated a breakpoint at 50.2 THI (r=0.99) with a final loss of 0.0089 (the lowest total sum of square errors). The regression line before the breakpoint (35 to 50.2 THI range) was Y 1=4.10–0.002×THI (R 2=0.51; P=0.05); the regression line after the breakpoint (50.2 to 88 THI range) was Y 2=4.45–0.009×THI (R 2=0.98; P<0.001). For PR%, the analysis indicated a breakpoint at 65.2 THI (r=0.99) with a final loss of 0.0014 (the lowest total sum of square errors). The two regression lines provided by the model were: Y 1=3.55–0.0019×THI (R 2=0.9; P<0.01) and Y 2=4.01–0.0089×THI (R 2=0.99; P<0.001) before (35 to 65.2 THI range) and after the break point (65.2 to 88 THI range), respectively.
Two-phase regression computed for milk characteristics (SCS, LnTBC, FA% and PR%), with average daily minTHI as the independent variable was also calculated. The minTHI break points were: 43.1 for SCS (r=0.99) with a final loss of 0.014; 49.4 for lnTBC (r=0.95) with final loss of 0.091; 38.0 for FA% (r=0.99) with final loss of 0.0094; and 49.4 for PR% (r=0.99) with final loss of 0.003.
Discussion
On average, the milk composition values recorded over the entire period of this study (2003 to 2009) were compliant with the Italian criteria for raw milk utilized for high-quality pasteurized milk production. The values for SCC recorded in July, August and September indicate that there is a risk of exceeding the criteria (3.105 cells/ml) for raw milk production utilized for high-quality pasteurized milk production. The TBC levels were always below the limit of 1.105 cfu/ml, as fixed by European legislation, whereas FA% and PR% were always above the limits fixed for high-quality pasteurized milk commercialization (3.5% and 3.2%, for FA% and PR%, respectively).
The retrospective study on the annual, seasonal and monthly variations in bulk milk composition demonstrates a significant association with climatic conditions. High SCC and TBC values and lower FA% and PR% values were recorded during the summer months, in correspondence with an increase in THI. This evidence was more pronounced for the year 2003, when the highest values of THI were recorded.
The increase in SCC during the summer has been reported (Schukken et al., Reference Schukken, Weersink, Leslie and Martin1993; Bouraoui et al., Reference Bouraoui, Lahmar, Majdoub, Djemali and Belyea2002; Green et al., Reference Green, Bradley, Newton and Browne2006), although the mechanism involved is not yet clear. Milk somatic cells are mainly leukocytes, including macrophages, lymphocytes and polymorphonuclear neutrophils. The major factor affecting SCC levels is the infection of the mammary gland. The main pathogens causing an increase in SCC include primary contagious pathogens such as Staphylococcus aureus and Streptococcus agalactiae, and environmental pathogens such as coliforms and Streptococcus spp. (Harmon, Reference Harmon1994). It is well known that high values of SCC in bulk milk are closely related to high individual SCC, indicating a high prevalence of subclinical mastitis (Waage et al., Reference Waage, Sviland and Ødegaard1998).
Some authors (Olde Riekerink et al., Reference Olde Riekerink, Barkema and Stryhn2007; Hogan and Smith, Reference Hogan and Smith2012) reported a high incidence of mastitis in dairy cows during the hot season. The increased incidence of mastitis during the summer might be related to the effect that high temperatures and humidity have on cows’ susceptibility to infections, as well as to the increased number of pathogens or vectors to which the cows are exposed. The impact of heat stress on immune function in dairy cows has been reported. Lacetera et al. (Reference Lacetera, Bernabucci, Scalia, Kuzminsky, Ronchi and Nardone2005) observed that summer conditions characterized by the occurrence of extreme events (heat waves) were associated with depressed cellular immunity. Moreover, peripheral blood mononuclear cells, isolated from dairy cows and exposed to incubation temperatures simulating conditions of hyperthermia, exhibited a decrease in DNA synthesis and an increase in heat-shock proteins (Lacetera et al., Reference Lacetera, Bernabucci, Scalia, Basiricò, Morera and Nardone2006), indicating a depressed response of cellular-mediated immunity in heat-shock cells.
It is also known that during the summer, the growth and number of environmental bacteria in bedding material increase owing to favourable temperature and humidity (Harmon, Reference Harmon1994). Under these conditions, it is reasonable that bacterial contamination of the udder by environmental pathogens may increase between milking operations, when the udder comes in contact with bedding, soil, water and dung (Jayarao et al., Reference Jayarao, Pillai, Sawant, Wolfgang and Hegde2004). Therefore, it is rational to hypothesize that the high values of SCC recorded during the summer are because of the increase in temperature, simultaneously operating in two ways. On one hand, high ambient temperatures may be responsible for the animals’ higher susceptibility to infection, by impairing the capacity of the immune system. On the other hand, high temperatures may encourage the growth and proliferation of environmental pathogens and their vectors, such as flies. It is acknowledged that a greater presence of environmental bacteria increases the risk of udder infection. The higher levels of bulk milk TBC observed during the summer testify the higher levels of udder contamination and could support this hypothesis.
A drop in fat and protein percentage and yield as temperature rises has been widely reported (Nardone et al., Reference Nardone, Lacetera, Ronchi and Bernabucci1992; Berabucci et al., Reference Bernabucci, Lacetera, Ronchi and Nardone2002; Renna et al., Reference Renna, Lussiana, Malfatto, Mimosi and Battaglini2010). Interestingly, it is the negative association between fat and proteins and spring found in the present study. Other authors (Barash et al., Reference Barash, Silanikove, Shamay and Ezra2001; Aharoni et al., Reference Aharoni, Ravagnolo and Misztal2002) who analysed test-day records of different cow populations (Georgian and Israeli primiparous and Israeli multiparous) observed peaks in fat and protein concentration from October to January, an initial drop in spring and a significant decrease during summer in these parameters. The mechanism responsible for the decrease in fat and protein percentage in spring is not well understood. The farms located in the study area are highly homogeneous in terms of the genetic merit of animals and, with the exception of summer (high-energy diet and heat-abatement devices), dietary and management practices are consistent throughout the year. The two breakpoints found in this study for fat and protein, in correspondence with maxTHI values of 50 and 65, respectively, and the negative association of these parameters with spring, when temperatures start to increase but are not very high, indicate an initial reduction in fat and protein content during a period that is not considered hot for dairy cows. Moreover, in this study, the climatic conditions recorded over 7 years demonstrated the same range of THI for spring and fall; unlike in spring, however, fat and protein increase to reach their peak during the fall. This evidence suggests that during the spring, heat load is not the main factor accounting for the decrease in milk components.
One possible factor affecting FA% and PR% in milk is the lactation phase. Basically, it is widely known that during lactation, fat and protein are lower in correspondence with the peak in milk yield, and increase until the end of lactation. One possible hypothesis for the drop in fat and protein content in spring is the higher incidence of calving and, subsequently, the higher number of fresh cows compared with other seasons. Under the conditions of this study, this factor must be excluded because the incidence of calving was distributed throughout the year with lower values during the spring months and higher values during the fall months and early winter (Italian breeding association, official statistics available at http://bollettino.aia.it/bollettino/bollettino.htm). Another possible factor influencing the percentage of fat and protein in the milk is the level of milk yield. As is well known, milk yield is affected by photoperiod and increases in correlation with increasing day length (Stanisiewski et al., Reference Stanisiewski, Mellenberger, Anderson and Tucker1985; Dalh and Petitclerc, Reference Dalh and Petitclerc2003); it is therefore plausible to believe that for the latitudes considered in this study, the reduction in milk components recorded in spring might be related to the increase in milk yield as a response to the increasing photoperiod, with a consequent dilution effect on protein and fat concentrations. The higher milk yield in spring in the study area is testified by official statistic data (www.CLAL.it). Considering the period of 7 years (2003 to 2009) the average spring milk yield was 15% higher than that recorded during the fall season. Barash et al. (Reference Barash, Silanikove, Shamay and Ezra2001) reported that the elongation of daylight increased the average milk production by 1.2 kg/h. Therefore, the decrease in fat and protein in spring and their increase in fall, in correspondence with the same climatic conditions, are more the result of the increasing photoperiod or the stage of lactation than of heat stress, whereas the broad drop in fat and protein content recorded during the summer is related to the negative impact of hot conditions on the synthesis of these milk components.
Interesting was the change of PR% from 2003 to 2009. The increase in PR% throughout the years is likely attributable to the genetic improvement. In fact, milk protein is the most important trait considered into the Holstein breed selection scheme in Italy (Canavesi et al., Reference Canavesi, Biffani, Finocchiaro and Nicolazzi2009).
The retrospective analysis on the relationship between THI and milk characteristics demonstrated a significant association between maximum and minimum daily THI, recorded 2 days before the sampling day, and SCC, TBC, FA% and PR%. Other than by the analysis of data of the present study, the use of THI recorded 2 days before sampling was also suggested by an analysis of the literature and by other research carried out recently by the authors of this study (U. Bernabucci, unpublished data), which reported a lag time between exposition to climatic conditions and the animal’s biological response. As an example, West et al. (Reference West, Mullinix and Bernard2003) reported that under hot conditions, milk yield was more affected by THI recorded 2 days before the sampling day. Other authors (Spiers et al., Reference Spiers, Spain, Sampson and Rhoads2004) reported an increase in respiration rate and rectal temperature 1 day after exposure to heat stress conditions and a reduction in dry matter intake and milk yield 2 to 4 days after heat exposure.
The THI–SCC relationship indicated a positive association with SCC, in relation to increased values of THI, and indicated a breakpoint at 57.3 maxTHI and 43.1 minTHI. It should be noticed that the breakpoint identified for SCC could be affected by the SCC flat pattern recorded within the 74 and 83 maxTHI range. Constant values of SCC, recorded between 74 and 83 maxTHI, affect (reducing) the slope of the second regression line and lead to the identification of a breakpoint for the lower value of THI. This reduction could be estimated at 2 to 3 THI points, and thus it is more reasonable to hypothesize a breakpoint for SCC at around 60 maxTHI and 46 minTHI. The flat pattern is probably a consequence of the measures put in place for maintaining the levels of SCC below the limit of 3.105 cells/ml.
The analysis of the THI–TBC relationship showed a positive association and indicated a breakpoint at 72.8 maxTHI and 49.4 minTHI. Milk TBC starts to increase in correspondence with values of THI characteristics of the hot season, confirming what it has been said previously, namely, the increase of the content of TBC in the milk during the summer is strictly related to the greater bacterial growth and higher contamination of the udder compared with the other seasons. To date, there are no studies concerning the relationship between THI or other climatic variables and somatic cell and bacterial count, and this makes it difficult to compare the results of this study. The results provided by this study regarding the relationship between THI and SCC and TBC represent a first indication for understanding the relationship between climatic conditions and changes in these indices.
The two-phase regression analysis indicated a negative association between fat and protein and increasing values of THI and indicated a breakpoint, representing a significant change in the slope, in correspondence with 50.2 and 65.2 maxTHI and 38.0 and 49.4 minTHI for FA% and PR%, respectively. Studies aimed at assessing the threshold of maxTHI, above which milk yield starts to decrease, have been carried out (Igono et al., Reference Igono, Bjotvedt and Sanford-Crane1992; Ravagnolo et al., Reference Ravagnolo, Misztal and Hoogenboom2000; West et al., Reference West, Mullinix and Bernard2003). Conversely, still less information is available regarding the relationship between THI and milk fat and protein percentage. In a New Zealand study, Bryant et al. (Reference Bryant, Lopez-Villalobos, Pryce, Holmes, Johnson and Garrick2007) reported patterns for fat and protein with a drop that occurred around the values of 50 and 60 THI, respectively. These results support the findings of this study insofar as they indicate the high sensibility of fat and protein to hot conditions. One should recall that the Bryant et al. (Reference Bryant, Lopez-Villalobos, Pryce, Holmes, Johnson and Garrick2007) study referred to different field conditions than the ones of this study, mainly because of the farming systems adopted. In particular, in the New Zealand study, the dairy cows were raised under a grazing system, whereas in this study the dairy cows were confined within free stall housing with no time at pasture.
Ravagnolo et al. (Reference Ravagnolo, Misztal and Hoogenboom2000) analysed the association between THI and 249 430 first-parity test-day records of milk, fat and protein yields collected from 1990 to 1997. They identified 72 THI as critical threshold because above this point milk, fat and protein yield start to decrease. The discrepancy with our results could be explained by the different experimental conditions. First of all, they analysed first-parity test-day record, whereas we used bulk milk data collected from all parity cows. As is known, heifers generate far less metabolic heat than cows, have greater surface area compared with internal body mass and would be expected to suffer less from heat stress (West, Reference West2003) than mature cows. In addition, one should recall the different genetic merit of the two cow populations analysed. The American study refers to a dairy cow population from the 1990s, whereas this study refers to a dairy cow population from the 2000s. The genetic improvement in milk yield experienced over the last few decades is often in conflict with maintaining homeothermy (Bernabucci et al., Reference Bernabucci, Lacetera, Baumgard, Rhoads, Ronchi and Nardone2010). This supports the evidence reported by Bryant et al. (Reference Bryant, Lopez-Villalobos, Pryce, Holmes, Johnson and Garrick2007): cows with high genetic merit were more susceptible to the effects of hot environments than their low genetic merit counterparts. Finally, in the American study, each test-day record was assigned to daily weather records, whereas the THI values used in this study were recorded 2 days before the sampling day.
Second, results of the two-phase regression analysis represent a contribution that pointed out the importance of the minimum THI during hot periods. Our results indicated that minTHI thresholds were similar for protein, SCC and TBC. When minimum daily THI was >46 to 49, an increase in SCC and TBC and a decrease in PR% occurred. In contrast, very low minTHI threshold was found for FA%. This last result confirms that milk fat percentage more than the other milk characteristics is strongly affected by the increasing photoperiod other than heat stress.
The findings reported in this and other studies suggest the existence of a climatic condition threshold, above which fat and protein start to decrease. However, the THI breakpoint values reported in these studies do not agree in indicating one exclusive onset critical condition. Further studies are necessary to understand the phenomena better, defining more accurately the climatic references at farm level that characterize the risk of heat stress, for better assisting farmers in the planning of useful heat management strategies.
Conclusions
Summer was the most critical season for milk characteristics, with negative consequences on the commercialization of high-quality milk. The maxTHI values of 57 and 73 and minTHI of 43.1 and 49.4 for SCC and TBC, respectively, represent the critical threshold above which SCC and TBC start to increase significantly in bulk tank milk. At the same time, the maxTHI values of 50 and 65 and the minTHI of 38.0 and 39.4 for FA% and PR%, respectively, represent the thresholds above which FA% and PR% start to decrease significantly. The THI breakpoints found for FA% and PR% suggests that during the year, heat load is not the main factor accounting for the decrease in bulk milk components.
Although the milk composition values identified in this study were always within the limits of the Italian law for the commercialization of pasteurized milk, there is a risk of exceeding the threshold for the commercialization of high-quality milk during the summer. Low quality leads to a decrease in the milk price paid at cowshed with subsequent economic losses for the farmers. The results of this study could be helpful to dairy cow producers, allowing them to adopt specific heat-abatement measures to counter the unfavourable consequences of heat stress at farm level.
Acknowledgements
This study was supported financially by MiPAAF-FILIGRANA Project (D.M. 25741/7303/11–01/12/2011) and co-supported by FACCE-MACSUR project (D.M. 2660–20.06.2012). The authors gratefully acknowledge the Lombardia Environmental Protection Agency and the Research Unit for Agricultural Climatology and Meteorology (MiPAAF-CRA-CMA) for providing temperature and relative humidity data.