Introduction
Delli Carpini and Keeter (Reference Delli Carpini and Keeter1997) impressively documented “What Americans Know about Politics and Why it Matters,” highlighting important limitations of Americans’ political knowledge and shaping the study of American politics over the last decades. During this time, political scientists have increasingly turned to the American states to study representation (e.g., Caughey and Warshaw Reference Caughey and Warshaw2022) and electoral behavior (e.g., Hopkins Reference Hopkins2018). Since state governments are closer to the people, we may assume Americans are relatively informed about their state governments. For instance, Madison even wrote, “the first and most natural attachment of the people will be to the governments of their respective States” and “the prepossessions of the people…will be more on the side of the State governments, than of the federal government” (Federalist 46). As states become more active policymakers (e.g., Grumbach Reference Grumbach2022) and political scientists develop theories and test hypotheses focused on state politics, it is critical to more thoroughly document and understand “What Americans Know about Statehouse Democracy.”
To add to this documentation, I conducted a nationally representative survey asking Americans over 30 questions about who represented them in state government, state government institutions, and the policies their government had enacted. In a descriptive analysis, I show that more Americans knew which parties represent them in state government than they knew of policies and political conditions specific to their state. For example, a healthy majority of Americans knew who their Governor was, but fewer knew her powers. Americans additionally overestimated their state’s unemployment rate, the size of the state budget, and levels of descriptive representation in their state legislature. When asked true or false questions about gun or abortion policies in their states, Americans’ attempts at correct answers performed little better than random guessing, but Americans were more aware of policies they more frequently interacted with, such as the initiative process or voter identification laws. Together, my findings show that while most Americans knew something about state politics, a sizable portion did not.
These findings highlight potential obstacles for statehouse democracy and political scientists studying American politics. To better understand these obstacles, the following study makes at least two key contributions. First, I document and describe Americans’ knowledge about state politics across multiple domains of political knowledge, highlighting where empirical realities may not meet normative expectations. Second, I identify which political knowledge questions best discriminate between individuals who have more or less state politics knowledge across different domains of knowledge. Such questions will enable future researchers to measure state political knowledge more efficiently.
All political knowledge is not federal
Many political scientists have come to a consensus that “most citizens are politically uninformed” (e.g., Delli Carpini and Keeter Reference Delli Carpini and Keeter1997). However, this consensus is primarily built on assessing voters’ knowledge of national politics. As put by Lupia (Reference Lupia2006, 223–25) when defending voters’ competence,
Without minimizing the importance of federal activities, it is important to recognize that they constitute but a handful of all of the politically relevant actions that occur on a given day…When scholars criticize the mass public for its inability to answer common political-information questions, then, they are basically condemning others for not sharing their federal fixation.
While the number of studies on state-level political knowledge has grown since Lupia made his defense, existing work often has a narrow focus and does not consider different types of political knowledge. For example, Delli Carpini and Keeter (Reference Delli Carpini and Keeter1997, 64) build from Barber (Reference Barber1972) and classify political knowledge into “three broad areas”: people and parties, the rules of the game, and the substance of politics. Evaluating knowledge across different domains is important because Americans may know who their policymaker is but not know what laws they created.
The domain of state-level political knowledge that has received the most attention is “people and parties,” centering on questions of who represents Americans in state governments. Prior state-level work often focuses on the executive branch and, for example, shows that individuals are more likely to identify who their Governor is when they live closer to the state capital (Delli Carpini, Keeter, and Kennamer Reference Delli Carpini, Keeter and Kennamer1994; Hopkins Reference Hopkins2018) or when a state is more politically competitive (Lyons, Jaeger, and Wolak Reference Lyons, Jaeger and Wolak2013). Recent work also demonstrates that voters are more likely to identify the majority party in their state legislature if the legislative parties are homogenous and polarized (Fortunato and Stevenson Reference Fortunato and Stevenson2021). However, research concerning Americans knowledge of their individual state legislator is often limited to single state samples and somewhat dated (e.g., Patterson, Ripley, and Quinlan Reference Patterson, Ripley and Quinlan1992).Footnote 1
Fewer studies examine Americans’ knowledge of “the rules of the game” or the “substance of politics” at the state level. The most extensive rules of the game studies focus on Americans’ knowledge of electoral reforms (e.g., Bowler, Donovan, and Tolbert Reference Bowler, Donovan and Tolbert1998). However, despite the attention given to executive and legislative state-level institutions such as Governor’s executive orders (e.g., Barber, Bolton, and Thrower Reference Barber, Bolton and Thrower2019), state legislative professionalism (e.g., Squire Reference Squire2017), or revolving door policies (e.g., Strickland Reference Strickland2020), I am unaware of any national survey that asks Americans whether they are aware of such state-level institutions. Similarly, national surveys often concentrate on studying Americans’ political knowledge about single issues, such as abortion (e.g., Swartz et al. Reference Swartz, Rowe, Morse, Bryant and Stuart2020) or Medicaid expansion (e.g., Long and Goin Reference Long and Goin2016), instead of comparing the same Americans’ knowledge across policies.
By focusing on a limited number of political actors, institutions, or issues, political scientists do not have a good understanding if individuals know more within one domain of political knowledge than another. Similarly, within individual domains of knowledge, do Americans know more about the executive versus legislative branches or different types of policies? Answers to these questions will help political scientists assess the health of statehouse democracy and study state politics.
Survey description
To provide such an assessment, I draw upon a national survey that asked approximately 1,000 Americans over 30 state political knowledge questions. Questions generally fall into the following three domains of political knowledge: people and parties, the rules of the game, and the substance of politics. Tables 1–3 summarize question wordings and Americans’ responses to each of these sets of questions. The Online Appendix and replication materials detail these questions, sources used to verify correct answers, and results for voters instead of all Americans.
Political knowledge of people and parties in government

Note: Percentage of correct responses to questions focused on who represents Americans in state government. Survey responses are weighted to be nationally representative.
Political knowledge of the rules of the game in government

Note: Percentage of correct responses to questions focused on who represents Americans in state government. Survey responses are weighted to be nationally representative.
Political knowledge of the substance of politics in government

Note: Percentage of correct responses to questions focused on state-level policies and political conditions. Survey responses are weighted to be nationally representative.
Survey findings are from a 2018 Cooperative Election Study (CES) module. The module consisted of two waves. Respondents answered questions sometime between September 27 and November 5, 2018, before the 2018 election, and additional questions sometime between November 7 and December 2, after the 2018 election. I employ sample weights specific to the module’s respondents and refer readers to YouGov’s documentation concerning the 2018 CES for information about sampling and weighting procedures.
The survey includes questions rarely asked of a national sample, and I cannot do analytical justice to the number of topics considered. In turn, my presentation is mainly descriptive, and I look forward to future scholars using these data to better understand state politics or create new measures of state political knowledge. I warn readers that results may overestimate the typical American’s political knowledge for at least three reasons. First, CES respondents are typically more educated and politically interested than the average American, and respondents who participate in online studies are more likely to be politically informed (Burnett Reference Burnett2016; Liu and Wang Reference Liu and Wang2014). Survey weights partly ameliorate this concern but are not a cure-all. Second, respondents took the survey online, and there is evidence that respondents “cheat” when answering political knowledge questions on online surveys (Smith, Clifford, and Jerit Reference Smith, Clifford and Jerit2020).
A third concern stems from question-wording choices. To avoid being “elitist” in my presentation of Americans’ knowledge about state politics (Lupia Reference Lupia2006), I employed guardrails to promote correct answers. For example, most survey questions took the form of a “True/False” or “Check all that apply.”Footnote 5 Such questions are simpler (Lupia Reference Lupia2006, 230) and promote guessing (Fraile Reference Fraile2017). Most questions also did not include an opt-out via a “Don’t Know” option (Mondak Reference Mondak2000, see also Luskin and Bullock Reference Luskin and Bullock2011). The survey, at times, provided respondents with context to reasonably bound answers. For instance, when asking about state unemployment rates, I informed the respondent of the average, lowest, and highest unemployment rate in their state since 1972, and the slider scale constrained answers to be within these ranges. I encourage readers to consider these research design decisions while interpreting the findings below.
People and parties in state politics
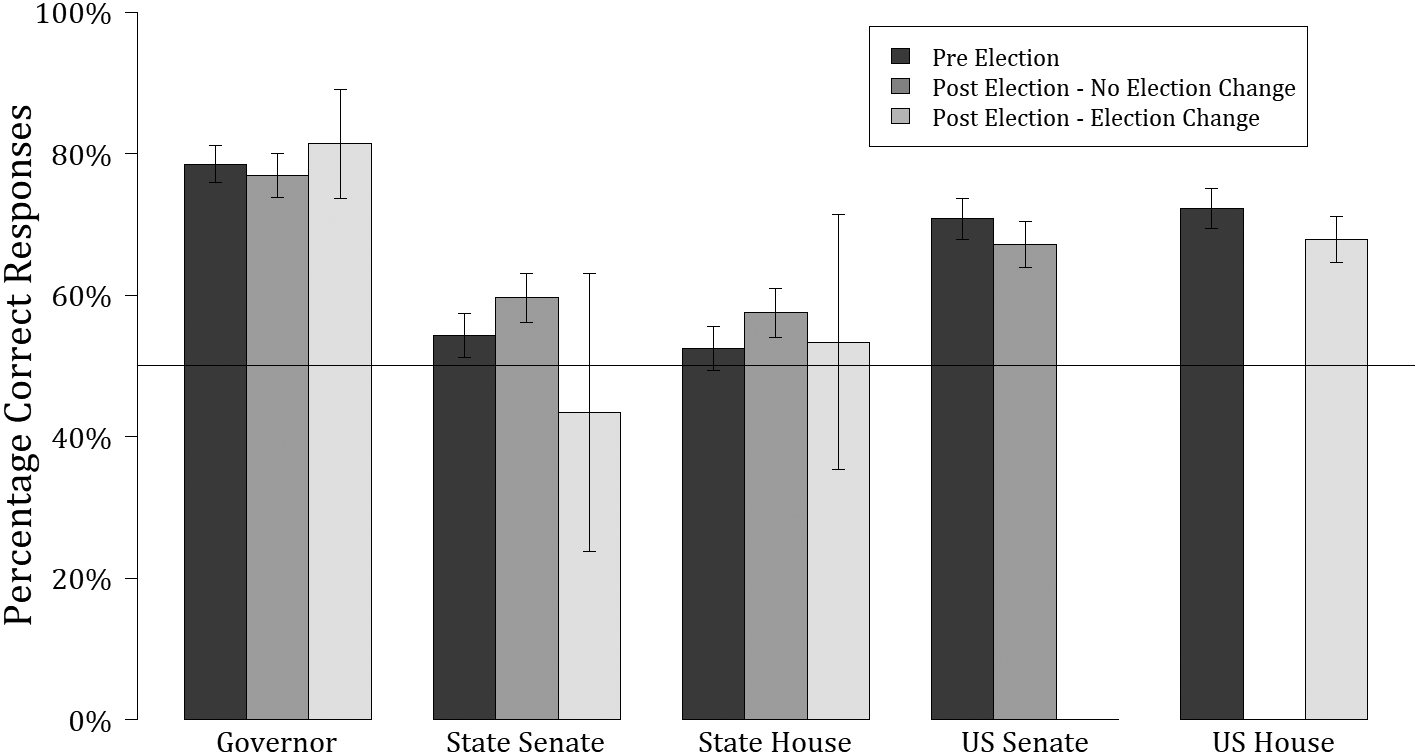
Citizens knowing who serves them in government can be critical for representation and accountability. At the state level, an overwhelming majority of Americans knew who their Governor was and to which party she belonged, but fewer were familiar with their state legislators. Prior to the 2018 election, 79 percent of Americans correctly recognized the name of their Governor and “if so which party he or she is affiliated with” (Figure 1, leftmost dark gray bar). However, when asked, “Even if you had to guess, who is your current representative in [State Legislature Lower Chamber Name]?” during the month prior to the 2018 election, when many state representatives were actively campaigning for reelection, only 9 percent of Americans could accurately recall their state representative’s name, and 23 percent explicitly stated they did not know the answer. While responses did not need to be the full name of their representative to be marked as correct and were awarded partial credit (e.g., Gibson and Caldeira Reference Gibson and Caldeira2009), it is important to remember that recall questions are more difficult than recognition questions (Hollander Reference Hollander2014).Footnote 6 Some incorrect answers were not random guesses. 4 percent of Americans gave either the name of their state senator or Governor. However, Americans sometimes confuse their state-level and federal legislators. 11 percent named their US House representative’s name when asked who their state legislator was.
Americans’ knowledge of partisan control of political institutions.
Note: The percentages of Americans who correctly identified which party controlled different state and federal political institutions. Dark gray bars reflect respondents’ answers prior to the 2018 election, and other bars reflect the same respondents’ answers following the 2018 election.

Very few Americans remembered their state representative’s name, but this information may be unnecessary for Americans to meaningfully participate in statehouse democracy. When addressing voter competence, Lupia argues that “party cues can engender competent performance even in the complex situations described above” (Lupia Reference Lupia2006, 230, Lupia Reference Lupia2015). And over five times as many Americans knew which party controlled their state legislature than who their state legislator was (Figure 1, dark gray bars). However, fewer Americans could correctly identify the party that held a majority of seats in their state senate (54 percent) or state house (53 percent) as compared to the US Senate (71 percent) or the US House of Representatives (72 percent).
The above findings reflect Americans’ responses before the 2018 election, when Americans had at least a year to learn which parties controlled their Governorship and the state legislature. Who is in power, however, changes, and it is important to understand how well Americans update their information (Barabas et al. Reference Barabas, Jerit, Pollock and Rainey2014). The survey then asked the same Americans the same questions concerning which party controlled the Governorship and state legislature shortly following the results of the 2018 election. In the 43 states where the Governor’s party would be the same in 2018 and 2019, 77 percent of respondents correctly identified the incoming 2019 governor’s party (Figure 1: center gray bar), and in the 7 states where the Governor’s party changed, a roughly similar 81 percent of respondents correctly identified the to-be 2019 governor’s party (Figure 1: light gray bar), but differences do not meet conventional levels of statistical significance.
Overall, more Americans correctly identified which parties controlled their state legislature after the election compared to before, but they were less accurate when control of a legislative chamber changed. In states where the election did not change control of the state senate, 60 percent of Americans correctly identified that state senate majority party, but in states where partisan control changed, this figure drops to 43 percent. A 4 percent difference emerges when comparing Americans in states where the party controlling the state house did and did not change, but differences do not meet conventional levels of statistical significance. These findings suggest that Americans do not appear to update their knowledge about the state legislature as well as they do their Governor.
Descriptive representation
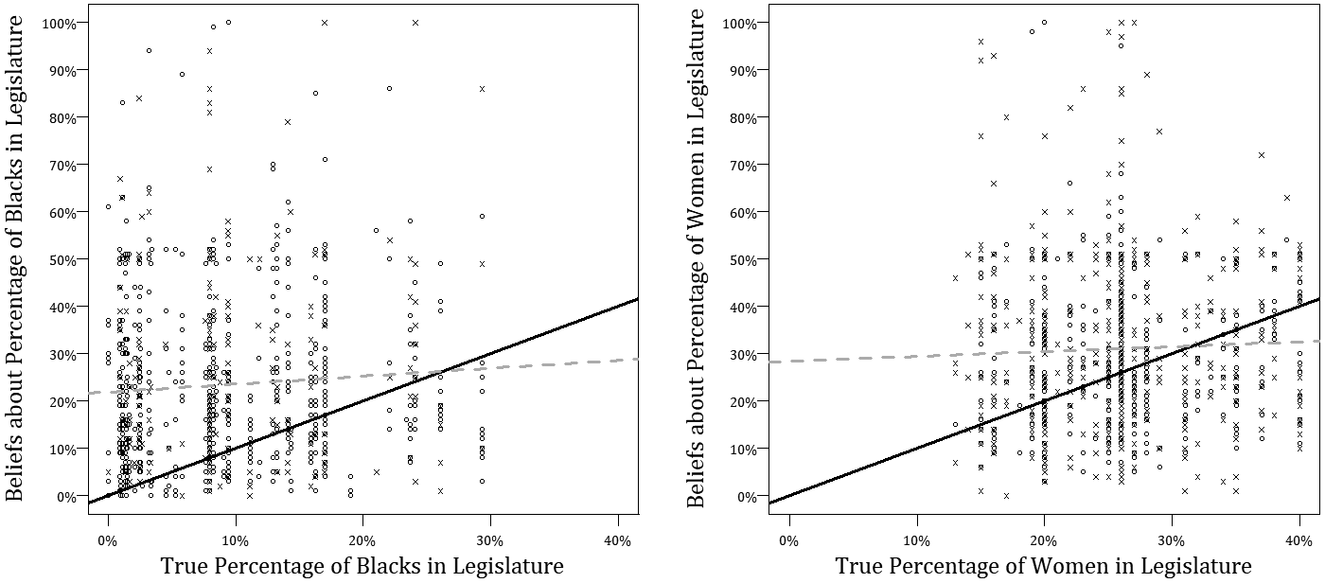
When asked what percentage of members of their state legislature they believed were African American (Figure 2, left panel) or women (Figure 2, right panel) prior to the election, only a fourth of Americans were relatively accurate. When calculating the percentages of Americans whose beliefs about descriptive representation were within 5 percentage points of the actual percentage (e.g., Dolan Reference Dolan2011; see also Sanbonmatsu Reference Sanbonmatsu2003), 22.9 and 25.6 percent of Americans were “accurate” concerning racial or gender representation in their state legislature, but 28.0 and 28.1 percent of Americans were accurate when considering Congress. The average absolute error in Americans’ beliefs about the percentages of African Americans and women in their state legislature were 19 and 15 percent, which are similar to their comparable errors for Congress: 18 and 15 percent.
Americans’ knowledge of descriptive representation.
Note: The left and right panels reflect Americans’ beliefs about the percentage of their state legislature that was black or women. The solid lines represent the relationship if Americans had accurate perceptions of descriptive representation, and the dashed gray lines indicate the observed association. Xs in each panel indicate whether the respondent was black or a woman.

These errors largely stem from Americans overestimating descriptive representation in their legislative institutions. 78 and 61 percent of respondents overestimated the percentage of African Americans or women in their state legislature, which are smaller than the comparable figures for Congress: 84 and 76 percent. These overestimations are similar to those of party-stereotypical groups found by Ahler and Sood (Reference Ahler and Sood2018) and are important to consider, as recent work demonstrates that one can draw different conclusions when using objective versus subjective measures of descriptive representation. Stauffer (Reference Stauffer2021), for example, shows that Americans perceiving that more women serve in federal and state legislatures is tied to people exhibiting greater external political efficacy. However, Stauffer does not find a similar relationship between actual gender representation and efficacy toward state legislatures.
The rules of game in state politics
A second important area of political knowledge concerns the institutions and processes of state politics. As put by Delli Carpini and Keeter (Reference Delli Carpini and Keeter1997, 69), this domain of knowledge is essential because “[w]hether as a spectator or player, to be a part of a game one must understand the rules.” Institutions are central to many studies of state-executive and legislative politics. The survey then asked Americans about state executive’s powers, restrictions on state legislators’ service, and how voters participate in politics.
Executive powers
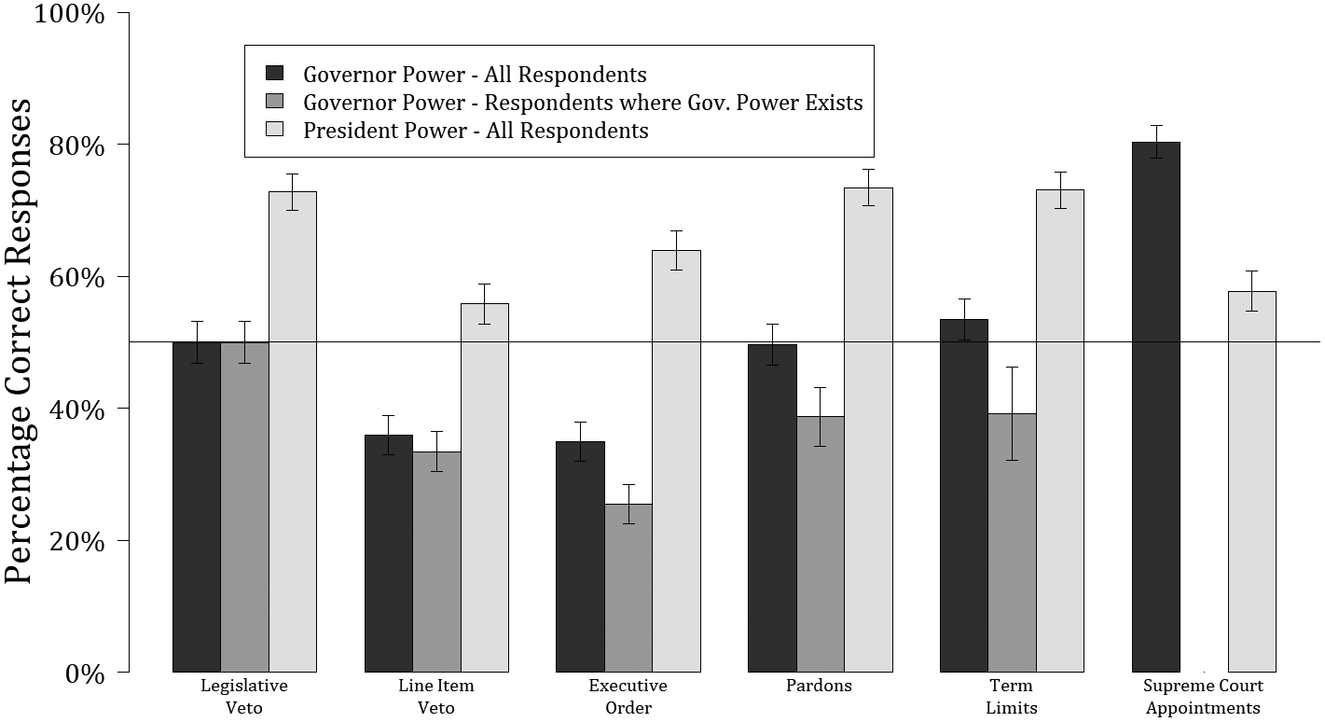
Every Governor can veto legislation passed by the state legislature, but only 50 percent of Americans knew their Governor held this power (Figure 3). Fewer Americans knew if their Governor could veto specific provisions listed in appropriations or spending bills (e.g., through a line-item veto) (36 percent), issue executive orders without legislative approval (35 percent), or pardon state criminals without anyone else’s approval (50 percent). More Americans, however, knew if their Governor was subject to a two-term term limit (54 percent) and whether their Governor could “make a lifetime appointment to the [state high court name] with consent of the state senate.” For all states, the correct answer to this judicial appointments question is “false,” and over 80 percent of Americans gave this response.Footnote 8
Americans’ knowledge of state and federal executives’ powers.
Note: Dark gray bars indicate percentages of Americans who could correctly identify whether their Governor held a specific power. Gray bars reflect the percentage of correct responses in states where Governors have the indicated power. Light gray bars reflect the percentage of Americans who knew whether the President held comparable powers.

Shortly after answering questions about their Governor’s powers, respondents answered similar questions about the President of the United States, and Americans were more aware of whether the President could issue vetoes, line-item vetoes, executive orders, or pardons (Figure 3, light gray bars).Footnote 9 Americans are then somewhat aware of these executive powers, as they correctly recognize that the President does or does not hold these powers. However, a non-trivial number of Americans are unaware if their Governor holds these same powers. Given Americans’ limited knowledge of state-executive politics, future work may want to reconsider employing objective measures of Governor’s powers to capture voters’ views of state government institutions, such as the “ambiguity over responsibility for budgetary outcomes” (Krupnikov and Shipan Reference Krupnikov and Shipan2020, 16).Footnote 10
Legislative institutions
Political scientists often use state legislatures to study how institutions shape legislators’ behavior. State legislative term limits, for example, decrease state legislative professionalism (Kousser Reference Kousser2005), and most Americans appear to have some familiarity with each of these concepts. 59 percent of Americans knew if their state legislators were subject to term limits. Similarly, 58 percent of Americans correctly identified whether their state legislator made on average more than $50,000 per year, suggesting that they partly recognize how professional their state legislature is. Only 42 percent of respondents knew their state senator’s term length, but this is comparable to the 38 percent of Americans who indicated a regular US Senate term is 6 years.
Rules in elections
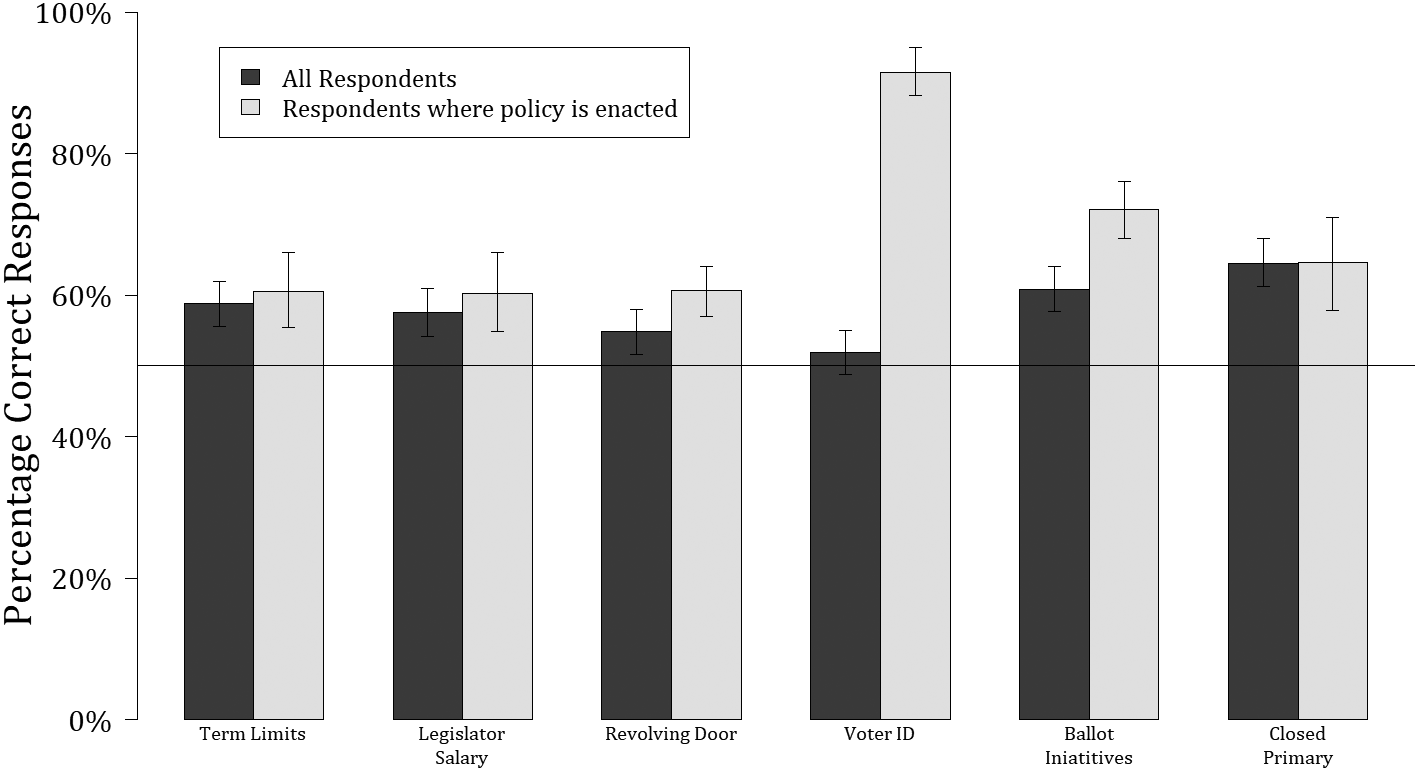
There is increasing concern about democracy in the states (e.g., Grumbach Reference Grumbach2022), and survey findings indicate that Americans are more familiar with electoral institutions if their states have enacted policies. For example, only 52 percent of Americans knew if they needed “to show a form of identification before being allowed to vote” (Figure 4, dark gray bar). However, in states where voters need to remember to bring their IDs to the polls, 92 percent of Americans knew their state had a voter identification requirement (Figure 4, light gray bar). Similarly, 61 percent of Americans knew whether voters “can pass state laws using ballot initiatives,” but 72 percent knew when only considering respondents from states where such initiatives occur. Approximately 65 percent of Americans in both open and closed primary states recognize whether before election day if voters in their state “need to be registered with the Democratic or Republican party to participate in these parties’ primary elections.” Almost two-thirds of Americans then appear to have some of the “mobilizing information” necessary to vote in elections (Lemert Reference Lemert1981).
Americans’ knowledge of legislative and electoral institutions.
Note: Dark gray bars indicated the percentage of respondents aware that a particular legislative or electoral institution exists within their state. Light gray bars reflect respondents who reside in states where the given policy exists.

Substance of state politics
The third domain of political knowledge considered by Delli Carpini and Keeter concerns the substance of politics, such as policies enacted by the state government and whether Americans had accurate perceptions of political conditions (e.g., the economy). Such knowledge is critical for representation and accountability in the American states. For instance, public liberalism better predicts policy liberalism when state electorates are knowledgeable (Jaeger, Lyons, and Wolak Reference Jaeger, Lyons and Wolak2017), and knowledgeable voters are more likely to approve of the legislature when it “produces policy outcomes that correspond with their interests” (Langehennig, Zamadics, and Wolak Reference Langehennig, Zamadics and Wolak2019, Abstract).
State policies
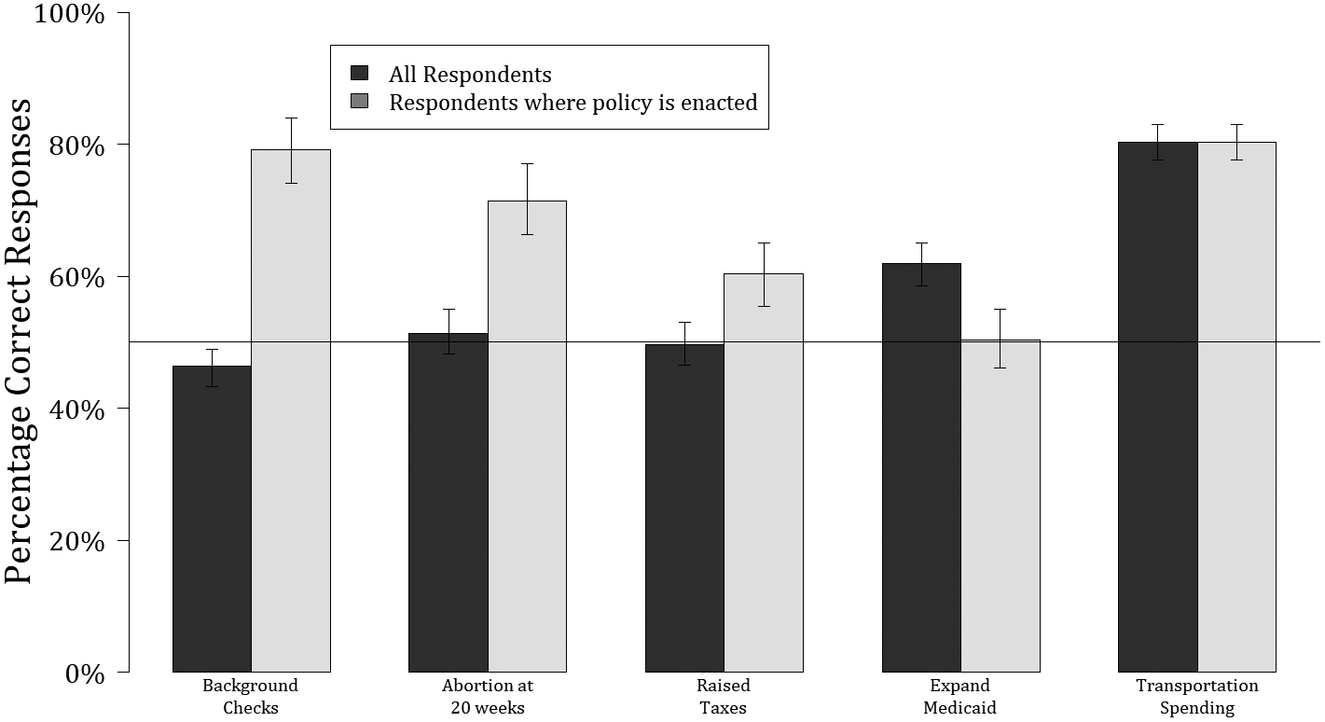
Many Americans did not know whether key policies were enacted in their states. 51 percent or fewer Americans correctly identified whether their state required background checks on guns, permitted abortions after 20 weeks of a pregnancy, or if taxes had been raised in their state (Figure 5, dark gray bars), but Americans are again generally more aware of whether their state has these policies if these policies are enacted in their state, with an exception being Medicaid expansion (Figure 5, light gray bars). Despite Americans’ relatively lower knowledge about policy issues as compared to who represents them in government, 80 percent of respondents knew that transportation and infrastructure spending was not the state government’s greatest expenditure, which is the case in every state. This finding, combined with increased correct answers in states where policies are enacted, suggests that survey respondents are not randomly guessing about their state’s policies.Footnote 13
Americans’ knowledge of state-level policies.
Note: Dark gray bars reflect the proportion of respondents who correctly identified whether a policy was enacted in their state. Light gray bars reflect correct responses among Americans where the given policy was enacted in their state.

Continuing focus on state budgets, the survey asked Americans, “what were the total expenditures of the [state name] state government, general fund budget in 2017? For this question, do not account for matching funds (e.g., Medicaid).” Given the potential difficulty of this question, the survey provided respondents with the 2016 budget figures of states with smaller and larger budgets, such as South Dakota ($1.5 billion) and California ($119 billion). Respondents then indicated their beliefs about the state budget on a slider scale ranging from $0 to $150 billion. They later answered a similar question about the federal budget, where the slider scale ranged from $0 to $10 trillion.
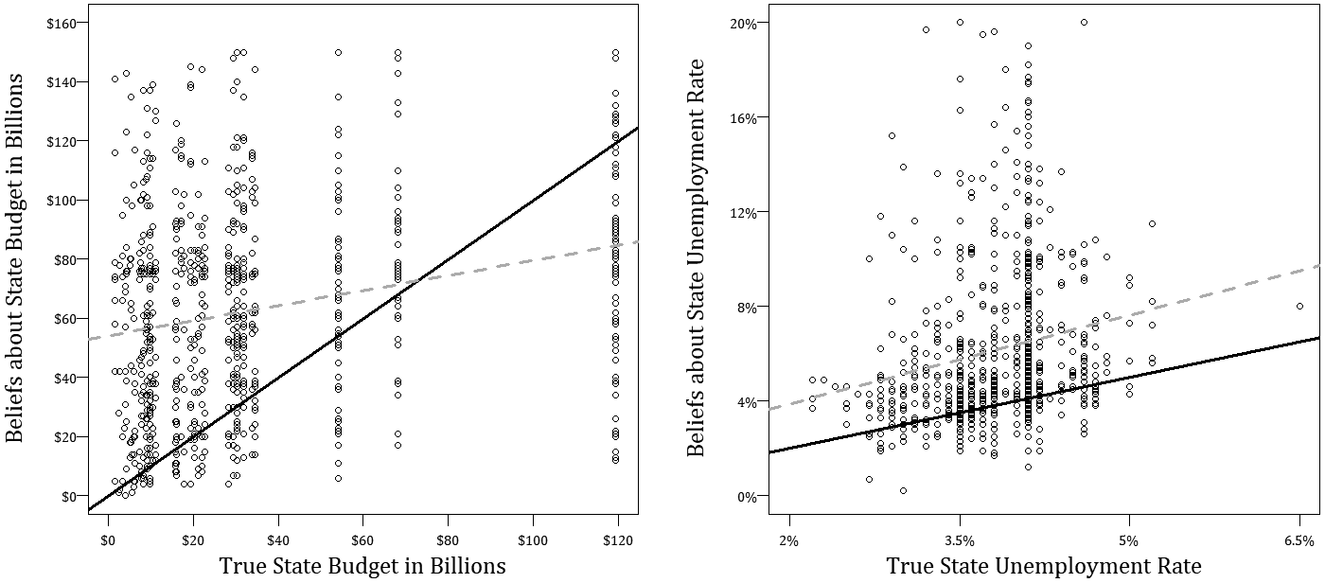
Like their perceptions of descriptive representation, Americans overestimate the size of their state and federal budgets. Figure 6’s left panel indicates respondents’ beliefs about the size of their state budget (y-axis) compared to the actual size of their state budget (x-axis). Americans in states with larger budgets are more likely to believe their state has a larger budget (Figure 6: positive sloped, dashed gray line), but 78 percent overestimated the size of their state budget, and the average absolute error was approximately $41 billion. When calculating the absolute error in percentage terms:
 $ \left(\frac{\left| Budget\ Belief- True\ Budget\right|}{True\ Budget}\right) $
to normalize respondents’ errors relative to the size of their state budget, Americans misjudged state budgets by over 350 percent. Approximately the same number of Americans (78 percent) overestimated the size of the federal budget but were considerably more accurate, with the average error only being 62 percent. These findings raise questions concerning assumptions about Americans’ awareness of policies, such as taxes or budgets, that prior work argues shape electoral behavior (e.g., Andersen, Lassen, and Nielsen Reference Andersen, Lassen and Nielsen2020; Besley and Case Reference Besley and Case1995).
Americans’ estimates of state budgets and unemployment.
Note: Left and right panels reflect Americans’ beliefs about the size of the state budget in their state and their state’s unemployment rate. Solid lines represent the relationship if Americans had accurate perceptions, and the dashed gray lines indicate the observed relationship.

The state economy
An established determinant of election outcomes in American politics is the economy, where Americans have more accurate but overly pessimistic perceptions.Footnote 14 Americans report that their state has a higher unemployment rate in states with higher unemployment rates (Figure 6, right panel, dashed gray line, Pearson’s r: 0.22). Such findings complement those concerning voters’ perceptions of the local economy (Holbrook and Weinschenk Reference Holbrook and Weinschenk2019). However, 84 and 88 percent of Americans, respectively, overestimated the state and national unemployment rates. The size of errors in Americans’ beliefs about the state and national unemployment rates is remarkably similar. The absolute error in beliefs for each state and national unemployment rates were approximately 2.7 percent.
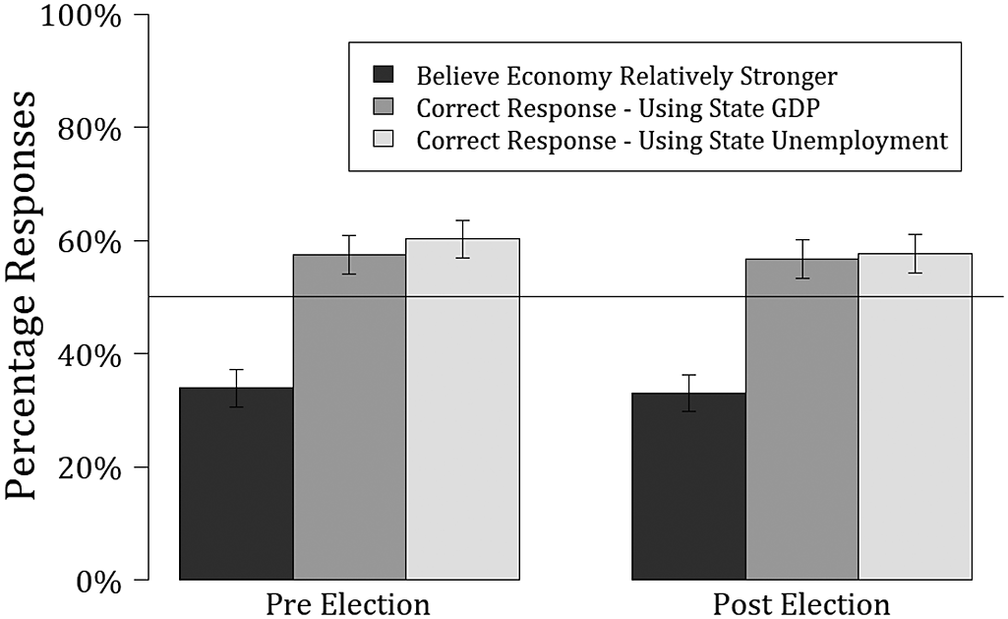
Pessimistic unemployment rate estimates likely relate to another survey finding: many Americans believe their state’s economy is worse than other states’ economies. On both the pre- and post-election modules, Americans indicated whether their state’s economy “is stronger than state economies in most other states.” The dark gray bars in Figure 7 indicate that only a third of Americans thought their state’s economy was stronger than other states. The gray and light gray bars indicate the proportion of Americans who accurately identify where the state economy was better or worse than other states when ranking states by state GDP per capita or state unemployment rate. Prior to the election, 57 and 60 percent of Americans’ relative rankings were accurate when using state GDP per capita or state unemployment, respectively. Americans then appear to be slightly more cognizant of some aspects of the economy than others, such as whether people have jobs rather than the total of all value created in a state economy.
Americans’ beliefs about their state’s economy compared to other states.
Note: Dark gray bars reflect Americans’ belief whether their state’s economy was stronger than most states. Lighter gray bars indicate what percentage of Americans were correct when using measures of state GDP per capita or state unemployment. The left and right sets of bars reflect Americans’ responses before and after the 2018 election.

Measuring what Americans know about state politics
Survey findings indicate that there are limits to Americans’ knowledge of state politics. Measuring such limitations is vital for many studies of political behavior. To aid future researchers, I use many of the above knowledge questions to better identify how to measure Americans’ state political knowledge efficiently.Footnote 15 I first assess whether measures of federal political knowledge are suitable substitutes for measures of state political knowledge. Second, I follow Delli Carpini and Keeter (Reference Delli Carpini and Keeter1993) and highlight how individual knowledge questions correlate with the full set of knowledge questions. I also estimate discrimination and difficulty parameters for state knowledge questions. Finally, I recommend questions and indices researchers can employ in their future work to measure state political knowledge efficiently.
Federal knowledge measures substituting for state knowledge
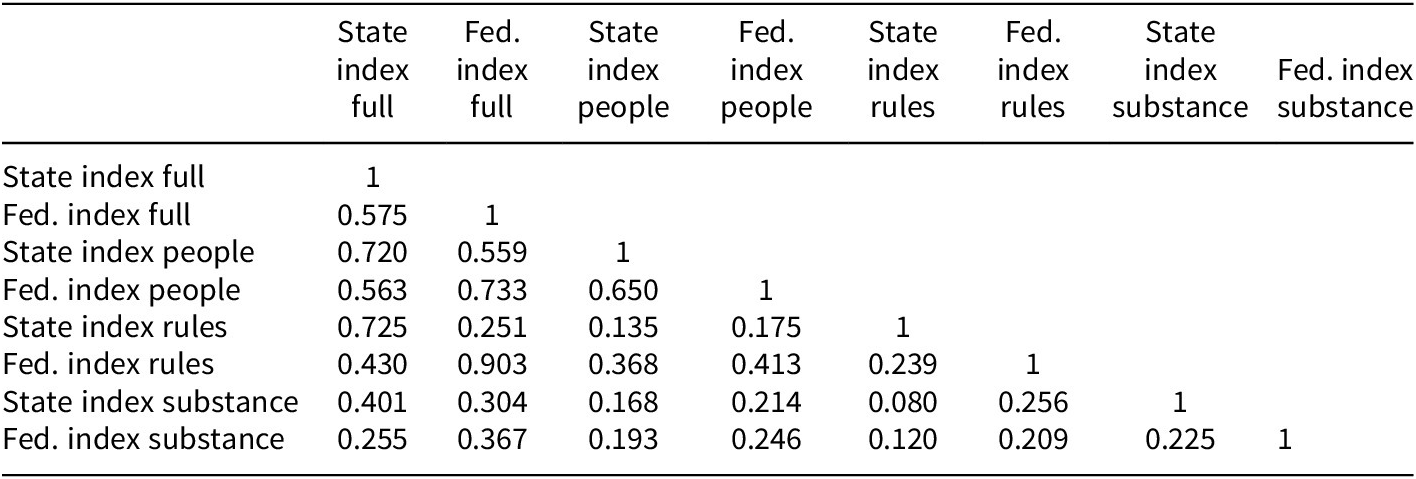
Americans know more about federal than state politics (e.g., Figures 1 and 3), but are Americans who are knowledgeable about federal politics also knowledgeable about state politics? To help answer this question, I identify federal and state politics survey items that focused on similar concepts within the “people,” “rules,” and “substance” domains of knowledge and create state and federal knowledge indices. The “People” indexes include legislative majority party and descriptive representation questions. The “Rules” indexes include the executive powers and senator term length questions. The “Substance” indexes include the unemployment rate and budget questions. Table 4 presents the correlations between these indices. The Online Appendix provides correlations across individual questions.
Correlations between federal and state knowledge indices

The correlations between federal and state indices indicate that Americans who know more about federal politics also know more about state politics. The correlation between the full federal and state indices is reasonably strong (0.58), and analyses in the Online Appendix suggest that male or more educated Americans are more knowledgeable about federal and state politics (Supplementary Table A-8).Footnote 16 However, the strength of the relationships between federal and state knowledge varies by knowledge domain. The correlation between federal and state indices that focus on the “People” domain of political knowledge is 0.65, but for the “Rules” and “Substance” domains, the respective correlations are only 0.24 and 0.23. Researchers then should be more comfortable substituting measures of federal political knowledge for state political knowledge in the “People” rather than the “Rules” or “Substance” domains of political knowledge.
Corrected-item correlations
A common method to evaluate knowledge items is calculating an item’s correlation with a respondent’s score across other questions. Table 5 presents each item’s corrected-item correlation (CITC) with a respondent’s score across all domains or within that specific item’s domain.Footnote 17 Items concerning which party controls their state senate and the Governor’s ability to veto legislation produce the strongest CITCs across the full set of items and within their own “people” or “rules” domains. Within the “substance” domain, individual items correlated relatively poorly with other items. Americans’ knowledge of whether their state had expanded Medicaid had the strongest CITC, but this CITC was only 0.10. Readers should be conscious that meager correlations were common across most items. Eleven of the 25 considered items had a CITC of less than 0.1 when considering the fuller set of items.Footnote 18
Item performance statistics for state knowledge questions

Note: Corrected-item correlations, discrimination parameters, and difficulty parameters for closed-ended state politics questions. Standard errors in parentheses. *p < 0.05. The first three sets of estimates use the full set of questions. The second set of estimates only considers questions within a particular item’s knowledge domain. For example, the state senate question’s corrected-item correlation is 0.460 with all other questions and 0.606 with other questions in the people domain.
Discrimination and difficulty of state political knowledge questions
To further assess individual survey items’ ability to assess more general state political knowledge, I estimate discrimination and difficulty parameters for the above questions using a two-parameter, logistic IRT model:
 $$ \log \left(\frac{\pi_i}{1-{\pi}_i}\right)={\beta}_{0i}+{\beta}_{1i}{z}_1 $$
Item response theory typically assumes that one unobserved latent trait (e.g., general knowledge of state politics) predominantly determines an individual’s correct or incorrect responses. In turn, every correct or incorrect survey answer reveals something about that latent trait or a respondent’s “ability.” With measures of ability, we can estimate individual question item’s difficulty and discrimination. An item’s difficulty (the intercept term:
 $ {\unicode{x03B2}}_{0\mathrm{i}} $
) will be the point at which the typical respondent, in terms of ability, provides a correct answer with a probability of 0.5. The discrimination parameter (the slope:
 $ {\unicode{x03B2}}_{1\mathrm{i}} $
) captures the rate at which the probability of a correct answer changes given an individual’s ability
 $ \left({\mathrm{z}}_{\mathrm{i}}\right) $
. Factor analyses suggest that state political knowledge is multidimensional (Supplementary Table A-4). I then estimate these parameters when pooling all questions and only within the people, rules, and substance domains. The Online Appendix offers item characteristic curves for each of these estimations.
Among “people” questions, voters’ knowledge of the state house majority party provides the best discrimination when considering either the fuller set or the domain-specific questions. This item additionally had a relatively strong CITC with both the full and the domain-specific index. This question was of moderate difficulty, suggesting it helps separate high- and low-knowledge respondents. Asking survey takers which party controls their state house then may be a good candidate for researchers to use if limited to a single survey question. This item has also been asked on nearly every CES survey, making it available for many studies. Focusing on the “rules” questions, Governor’s line-item veto, legislative veto, or state legislative term limits items had the strongest discrimination, and these items’ difficulty parameters suggest they were respectively increasingly easier to answer.
Among “substance” questions, I only find positive and statistically significant discrimination parameters when considering the full set of items. Asking Americans about the state unemployment rate offers the strongest discrimination, but this is a very difficult question, suggesting it will only distinguish a few high-knowledge respondents. Questions concerning background checks for guns or abortion also provide some discrimination between respondents and are questions with more moderate difficulty. But overall, like findings from the CITC analyses, the considered substantive individual items appear to be weaker and less generalizable measures of state political knowledge.
Recommended knowledge questions
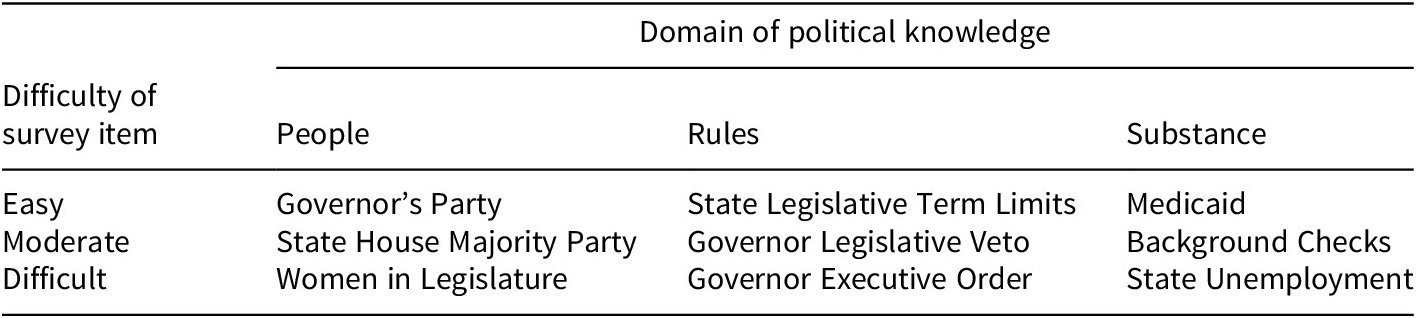
Most researchers cannot place over 30 questions about state political knowledge on their surveys. Table 6 then offers recommended questions to measure state political knowledge more efficiently, following the above CITC, discrimination, and difficulty estimates. Table 6 is organized by question difficulty (rows) and knowledge domain (columns). For example, a scholar interested in a general index measure could use questions listed in the “Moderate” row. Questions about the state house majority party, Governor’s legislative veto, and background checks are moderately difficult, helping separate low- and high-knowledge respondents, and cover each knowledge domain, creating a more general index measure. Scholars can add items from the “Easy” row to build a six-item index and then the “Difficult” row to build a nine-item index measures. The Cronbach alphas of these 3, 6, and 9 item indices, respectively, are 0.375, 0.441, and 0.483.
Recommended questions and indices to measure state political knowledge

The columns of Table 6 offer recommendations for single knowledge domain indices. For example, a representation scholar, who is less interested in gubernatorial powers, can build an index using items in the “People” column. Again, the state house majority party item separates respondents with above- and below-average political knowledge. Meanwhile, the Governor’s party item separates low-knowledge and below-average knowledge respondents. Descriptive representation items can separate above-average and high-knowledge respondents. Such questions are also substantively important, particularly for assessing Americans’ knowledge of politics. Dolan (Reference Dolan2011) shows that a gender gap does not emerge when asking about descriptive representation instead of traditional knowledge questions, and questions about descriptive representation are good alternative candidates to distinguish more knowledgeable or higher-ability Americans.Footnote 19
The above recommendations draw upon one of the most extensive surveys of state political knowledge, but the indices’ limitations are worth attention. First, as indicated above, recommended indices generally have relatively low reliability. Second, the addition of substance items reduces indices’ reliability. For instance, the Cronbach alpha for a two-index measure with the state house party and Governor’s legislative veto items is 0.444, while the three-item measure is 0.375. Footnote 20 Third, items in the “Substance” domain correlate poorly with each other and discriminate poorly within their domain, suggesting their limited generalizability. Scholars whose research has less policy focus may then want to consider excluding substance measures from indices.
Discussion
Even though state governments are closer to the people, Americans know less about state politics than federal politics, and their knowledge varies across domains of political knowledge. Americans are most familiar with the parties representing them in state government and the policies they interact with. They are least knowledgeable about the rules of the game governing state officials, particularly relative to their understanding of whether the same rules govern federal officials. Americans additionally have a weaker understanding of their state’s policies and often overestimate the size of state budgets and unemployment rates, producing overly pessimistic economic outlooks.
The above findings are potentially normatively concerning and add to political scientists’ long struggle to assess Americans’ political competence (Kuklinski and Quirk Reference Kuklinski and Quirk2001). Regrettably, analyses from a single survey cannot lead to definitive conclusions regarding whether Americans have the information they need to participate in statehouse democracy. Empirically, the above questions connect to important research questions, but the survey did not ask about all issues important to state politics. Similarly, no question wording nor the mere incentive to complete an online survey will create perfect measures of Americans’ knowledge (Boudreau and Lupia Reference Boudreau, Lupia, Druckman, Green, Kuklinski and Lupia2011; Prior and Lupia Reference Prior and Lupia2008). I look forward to future work to ask new questions with different survey modes to build on the findings presented here.
Conceptually, the above findings speak most to competence assessments that focus on “heuristics” (e.g., Lupia Reference Lupia1994) and “enlightened self-interest” (e.g., Delli Carpini and Keeter Reference Delli Carpini and Keeter1997) rather than “ideological belief systems” (e.g., Converse Reference Converse1964).Footnote 21 Within the heuristics approach, many agree that Americans do not need to know “all the facts” (Cramer and Toff Reference Cramer and Toff2017; Lodge, Steenbergen, and Brau Reference Lodge, Steenbergen and Brau1995; Lupia Reference Lupia2015), and the above findings indicate that Americans know some facts. For instance, the 21 percent of Americans who correctly answered at least 60 percent of the state political knowledge questions could drive a “miracle of aggregation” to produce desirable policies (e.g., Erikson, Wright, and McIver Reference Erikson, Wright and McIver1993). Additionally, a little knowledge could offset for what citizens do not know. 79 percent of Americans knew their Governor’s party, and Mondak (Reference Mondak1993) shows that Americans with more knowledge about what Governor appointed a state judge struggle less in state judicial elections. Moreover, while most Americans did not know if their state has a voter ID law, those who need identification to vote were more likely to know whether their state has a voter identification law. Americans then knew a necessary fact to allow them to help achieve a socially desirable outcome of democratic participation.
Heuristics can go a long way, but an American needs to know some facts for a heuristic to work. If Americans do not know which party controls their legislature (Figure 1) or whether the state economy is good or bad (Figures 6 and 7), applying the heuristic-driven theories, such as responsible party government, to the states is challenging. More knowledgeable citizens additionally lead to better policy feedback. Knowledgeable state electorates are more likely to be responsive to state government policy changes (Langehennig, Zamadics, and Wolak Reference Langehennig, Zamadics and Wolak2019, Figure 2), enabling them to hold their elected officials accountable, and states with more knowledgeable electorates have greater policy congruence (Jaeger, Lyons, and Wolak Reference Jaeger, Lyons and Wolak2017). Regrettably, citizens’ state political knowledge will unlikely improve soon. Despite state governments being closer to the people and Madison’s claims that “the prepossessions of the people…will be more on the side of the State governments, than of the federal government” (Federalist 46), 36 percent of American voters stated they more closely followed “what is going on in government and public affairs” in federal rather than state government. Moreover, with dramatic cuts to state house reporting, it is difficult for even interested Americans to learn about their state government (Rogers Reference Rogers2023a; Shearer et al. Reference Shearer, Matsa, Mitchell, Jurkowitz, Worden and Forman-Katz2022).
A knowledgeable electorate is essential, and the above findings can guide researchers better to empirically account for Americans’ differing knowledge when answering normatively important questions about statehouse democracy. All survey data is publicly available for scholars to build on the above descriptive work and examine individual domains of political knowledge, better understand what predicts political knowledge, further study how political knowledge relates to policy outcomes or political attitudes, or generate new measures of state political knowledge using more advanced statistical techniques, such as multilevel regression with post-stratification, to answer important questions about accountability and representation (e.g., Jaeger, Lyons, and Wolak Reference Jaeger, Lyons and Wolak2017). With the growing policy activity in states (e.g., Grumbach Reference Grumbach2022), it is critical to understand what Americans know about statehouse democracy.
Supplementary material
The supplementary material for this article can be found at http://doi.org/10.1017/spq.2023.19.
Data availability statement
Replication materials are available on SPPQ Dataverse at https://doi.org/10.15139/S3/ZM3AXA (Rogers Reference Rogers2023b).
Acknowledgments
I thank participants of the 2018 State Politics and Policy Conference for their excellent suggestions and feedback for the survey instrument. I additionally thank Doug Ahler, Larry Bartels, Dan Biggers, Chris Clark, Nick Carnes, Jaclyn Kettler, Justin Kirkland, Dan Konisky, Rebecca Kreitzer, Jennifer Lawless, Seth Masket, Michael Nelson, and especially Jennifer Wolak for feedback about the survey instrument and earlier drafts. I also thank John Barrett, Abigail Faust, Thomas Holland, Cher Hu, Kaitlin Klasen, Emily Johansson, and Sequoyah Lopez for their research assistance.
Funding statement
The author received no financial support for the research, authorship, and/or publication of this article.
Competing interest
The author declared no potential conflicts of interest with respect to the research, authorship, and/or publication of this article.
Author Biography
Steven Rogers is an associate professor of Political Science at Saint Louis University. Rogers is the author of Accountability in State Legislatures and has published research in the American Political Science Review, American Journal of Political Science, and Legislative Studies Quarterly.