

INTRODUCTION
The ‘Prestige’ oil tanker accident occurred on 13 November 2002, on the Spanish North Atlantic coast. The first important oil slick was detected the following day. After six days of drift navigation over the Galician continental shelf, and having spilled approximately 19,000 mt (Freire et al., Reference Freire, Fernandez and Muiño2006), it sank 130 miles off the coast, south-east of Finisterre. During the following months, the spill continued, totalling approximately 60,000 mt of heavy oil (type M-100). This spill became one of the 20 most important in history (statistics obtained from the International Tanker Owners Pollution Federation Limited, http://www.itopf.com/stats.html).
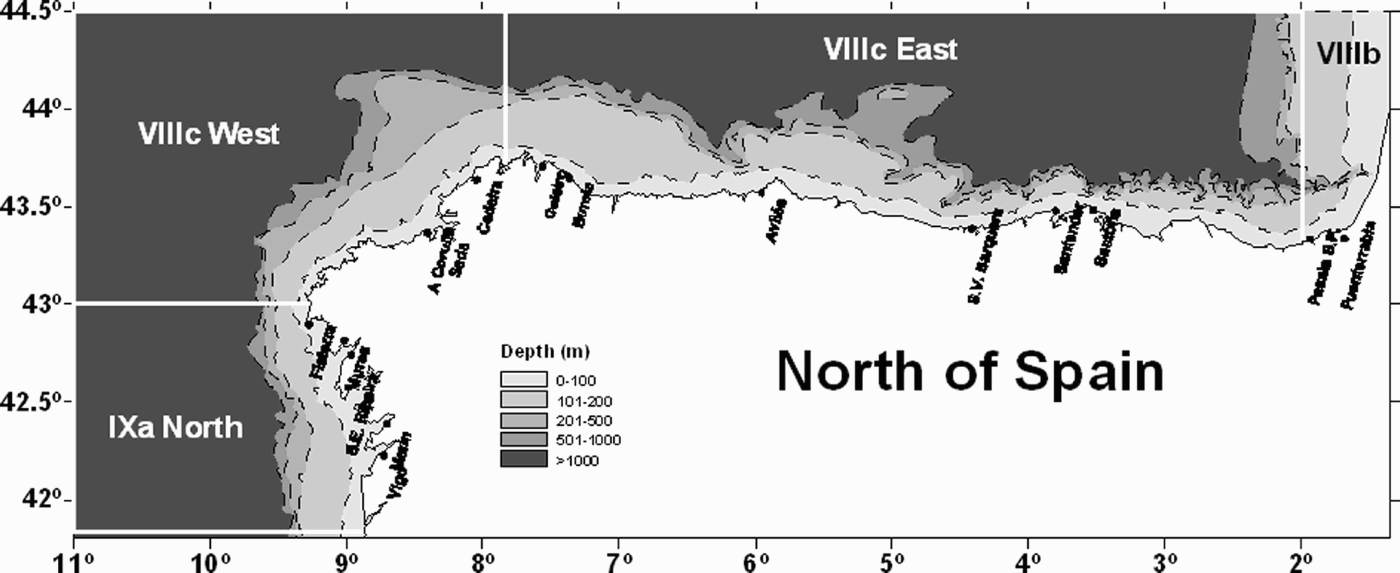
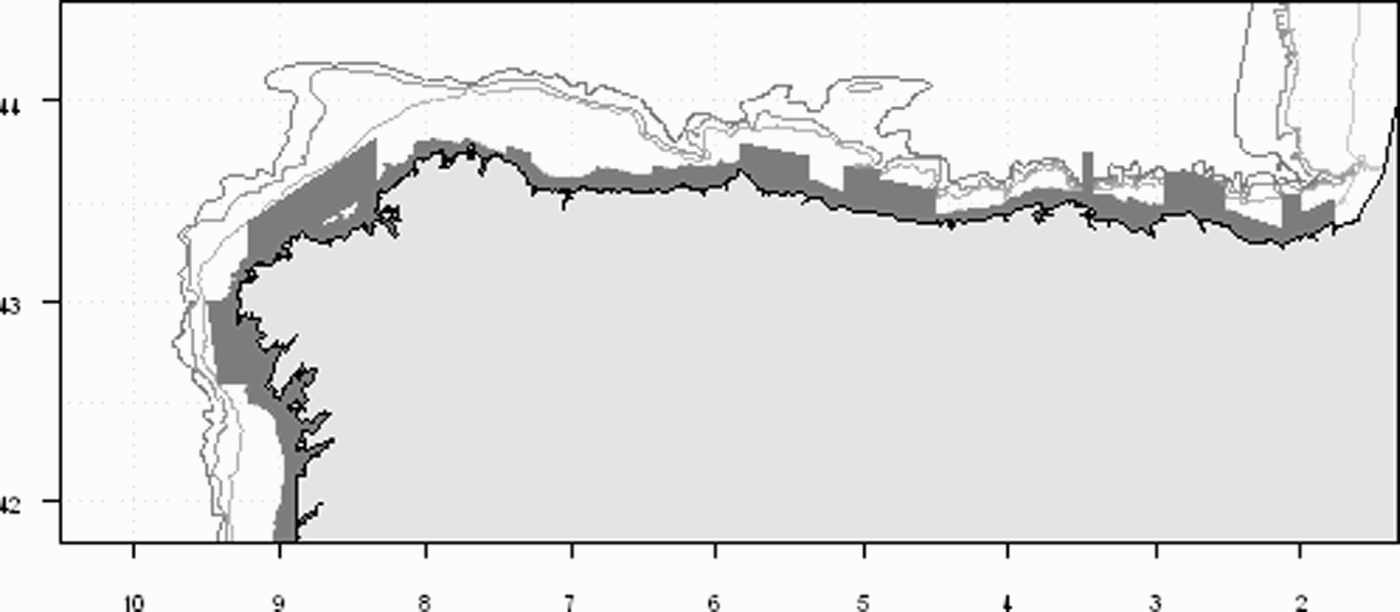
The fuel slick extended all over the coast and the continental shelves of Galicia and the Cantabric Sea (Punzón & Serrano, Reference Punzón and Serrano2003; Sánchez, Reference Sanchez2003; García-Soto, Reference García-Soto2004), where many of the commercial fish and shellfish stocks have their distribution area in the north-east of Spain (Figure 1). Currently, some of the exploited stocks distributed in this area are beyond the biological security limits, i.e. their production and regeneration capabilities are seriously damaged. This is the case for hake (Merluccius merluccius (L., 1758), Norwegian lobster (Nephrops norvegicus L., 1758) and anchovy (Engraulis enchrasicolus (L., 1758), among others (ICES, 2004a, b, 2005a, b). The ways in which this may affect fishery resources are diverse: (1) direct effects (lethal or sub-lethal) to populations; (2) direct effects to fisheries or interferences with the fishing activity; and (3) indirect effects through disturbances in the ecosystem (e.g. impact on trophic chains) (Dipper & Chua, Reference Dipper and Chua1997; Elliot et al., Reference Elliot, Hemingway, Krueger, Thiel, Hylland, Arukwe, Förlin, Sayer, Lawrence and Hemingway2003). Additionally, there may be a negative effect on fishing opportunities, since the black tide may permeate both vessels and fishing utensils, causing a decrease in vessel availability (GESAMP, 1993).
Study area and base harbours of the fleets under analyses.

There are also a number of possible indirect implications as a result of the management measures imposed after the spill, such as the closing and limiting of access to traditional fishing grounds for certain fishing techniques (Dipper & Chua, Reference Dipper and Chua1997); or the implementation of subsidies for banning the activity, compensation or participation in cleaning actions (Moller et al., Reference Moller, Dicks, Whittle and Girin1999; Surís & Garza, Reference Surís and Garza2003). Also, modifications in the market price, for example, may affect the bio-economical model (Crean & Lacambra, Reference Crean, Lacambra, Lawrence and Hemingway2003), and have implications for the fishing effort and the way in which it is performed. Management measures have been applied as a consequence of impact in those fishing areas where the presence of fuel also affects fishing technique effectiveness, commercialization of species, suitability for human consumption, etc.
Two important coastal semi-industrial fisheries are normally carried out in the area affected by the ‘Prestige’ spill. Firstly, trawling (otter and pair trawl), is responsible for an important part of the demersal resources obtained in the area affected by the spill: Norwegian lobster (Nephrops norvegicus) (100%), megrim (Lepidorhombus boscii and L. whiffiagonis) (100%), hake (Merluccius merluccius) (70%), monkfish (Lophius budegassa and L. piscatorius) (65%) and other species with a more pelagic behaviour such as blue whiting (99%), horse mackerel (36%) and mackerel (30%). Secondly, the purse-seine fleet, targeting exclusively pelagic species, unloads 100% of the anchovy (Engraulis encrasicolus) and sardine (Sardina pilchardus) catches, 60% of horse mackerel (Trachurus trachurus) and 25% of mackerel (Scomber scombrus) catches, respectively. Apart from these two fisheries there are a series of artisanal fleets (not analysed in the present work), which use a wide variety of techniques (Pereda & Villamor, Reference Pereda and Villamor1991) such as gill-net gear (trammel nets, falls, or anchored gill-nets), line gears (bottom set loglines, floating line and hand lines). Among these is the hand line fishery. It targets mackerel and has been incorporated in this analysis due to its social and economical importance, since it catches more than 40% of the total of the so-called south component of the north-eastern Atlantic mackerel population (Punzón et al., Reference Punzón, Villamor and Preciado2004).
In this document, we show the oil-spill related management measures which may have affected the activity of the most important fisheries and the possible modifications in the global effort exerted by the trawling and purse-seine fleets, from an historical perspective (Eberhardt, Reference Eberhardt1976). Moreover, we identify possible modifications in the temporal and spatial patterns of trawling effort and the possible alterations in the specific composition of the fleet components obtained for the trawling fleet. Finally, we also analyse possible changes in the exploitation strategies of the fisheries under analysis.
MATERIALS AND METHODS
Management of fisheries in relation with the ‘Prestige’ catastrophe
Management of the fishing activity in relation with the ‘Prestige’ spill was undertaken via the Spanish administration, by limiting fishing in certain areas and for specific techniques. Limitations are registered in governmental regulations as orders that may have a ministerial, autonomic or local character, depending on the official body using them. Hence, they affect different areas of application. For this work we have compiled all the regulations that were passed in relation to the ‘Prestige’ spill and the fishing activities which were published in the official bulletins of the affected communities.
Effort–time series
For demersal fisheries we have used two effort units depending on the gear used. In the otter trawl fleet, the unit was two fishing days, corrected for the different powers of the vessels involved:

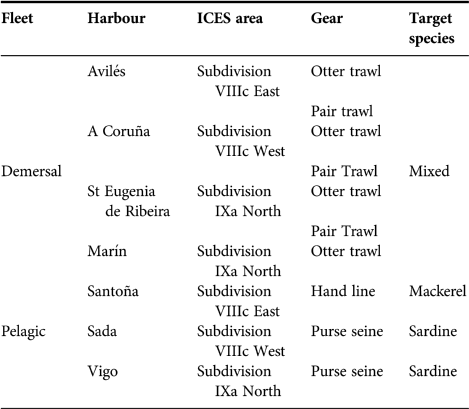
where d i stands for the fishing days of a particular boat i and HP i is the horse power of boat i. In the case of the pair trawl fleet, we used the trip number as a unit. In both cases we estimated the monthly effort in all areas where the prohibition was in place as well as the effort of the most important fleets (Figure 1 and Table 1), considering the fleet as the combination of fishing gear, working area and port of landing.
Fleets used for effort analysis.

In fisheries targeting pelagic species such as sardine and mackerel we used the number of fishing days in which a particular species was landed per type of fishing gear. In this case, since it is impossible to estimate the number of trips targeting one species in the area affected by the spill, we have selected the three most important fisheries which are carried out in the area (Table 1), considering fishery as the combination of the following variables: fishing gear, working area, landing harbour and target species. Another important fishery in the zone is anchovy, but we did not consider it as it was not affected by the temporal close.
We have compiled the monthly historical effort series from 1996 to 2004 for all fleets except the trawling fleet from A Coruña harbour in 1998 and the surrounding net fleet from Vigo harbour in 2000, since data were not available for them. To obtain the total effort of all trawling fleets we have had to estimate the total trawling effort from A Coruña in 1998. In all cases information has been derived from the professional fishermen organizations and the sea captaincies.
Spatial trawl effort
For the analysis of the spatial change in effort exerted by otter trawl and pair trawl fleets, we used the fleets' fishing books. These books record fishing days by statistical rectangle (each statistical rectangle is one degree of longitude by half a degree of latitude) of the industrial fleets working in the study area. As no information was available prior to the spill, data up to 2006 were used to include the greatest possible variability in the description, and the years from 2004 to 2006 were assumed to be normal situations.
Analysis of the specific composition by trawl trip
To identify whether there were changes in the specific composition of the fish landed from different trawl trips in the affected area, trips from 2002 (pre-spill) and 2004 (post-spill) were analysed. We analysed a total of 12,906 trips in 2002, 11,777 trips in 2003 and 8284 trips in 2004, which accounts for 55% of the total trips performed by this fleet between both years in the affected area. The database was set up by the Spanish Institute of Oceanography (IEO is the Spanish abbreviation) under its national market monitoring program. This database contains information of landed weight by boat and species for different strata on: fishing area (ICES subdivision), type of gear, harbour and date. Weight landings were transformed into percentages and grouped in categories of species.
The original data frame was split by year for single otter and pair trawls to avoid the possible overlap of catch profiles. To classify the catch profiles a non-hierarchical cluster analysis (K-mean method) (Hair et al., Reference Hair, Anderson, Tatham and Black1999) was performed. This method is especially useful when there is a previous knowledge of the fishery (Kaufman & Rousseeuw, Reference Kaufman and Rousseeuw1990).
RESULTS
Fishing management of the catastrophe
The first ban on industrial fleets, in this case for purse-seiners, was established by the local administration on 18 November 2002, a day before the definitive sinking of the vessel, and was adopted by the national authorities on the 21st of the same month. For trawl fleets the first ban was set on 30 November. The ban for these fleets was limited exclusively to the 12 mile strip out of interior waters. As regards pelagic fleets, the ban affected the totality of the continental platform and oceanic waters enclosed within two points marked on the coast (Figure 2).
Maps of the times and the areas subject to bans (shadowed areas) imposed on trawl and pelagic fleets.

Closed areas were progressively widened in accordance to the evolution of the oil slicks, reaching their maximum extent for both fisheries in February 2003 (Figure 2). Bans were lifted for all fisheries at the end of June 2003. Therefore, the longest lasted six months.
Effort–time series
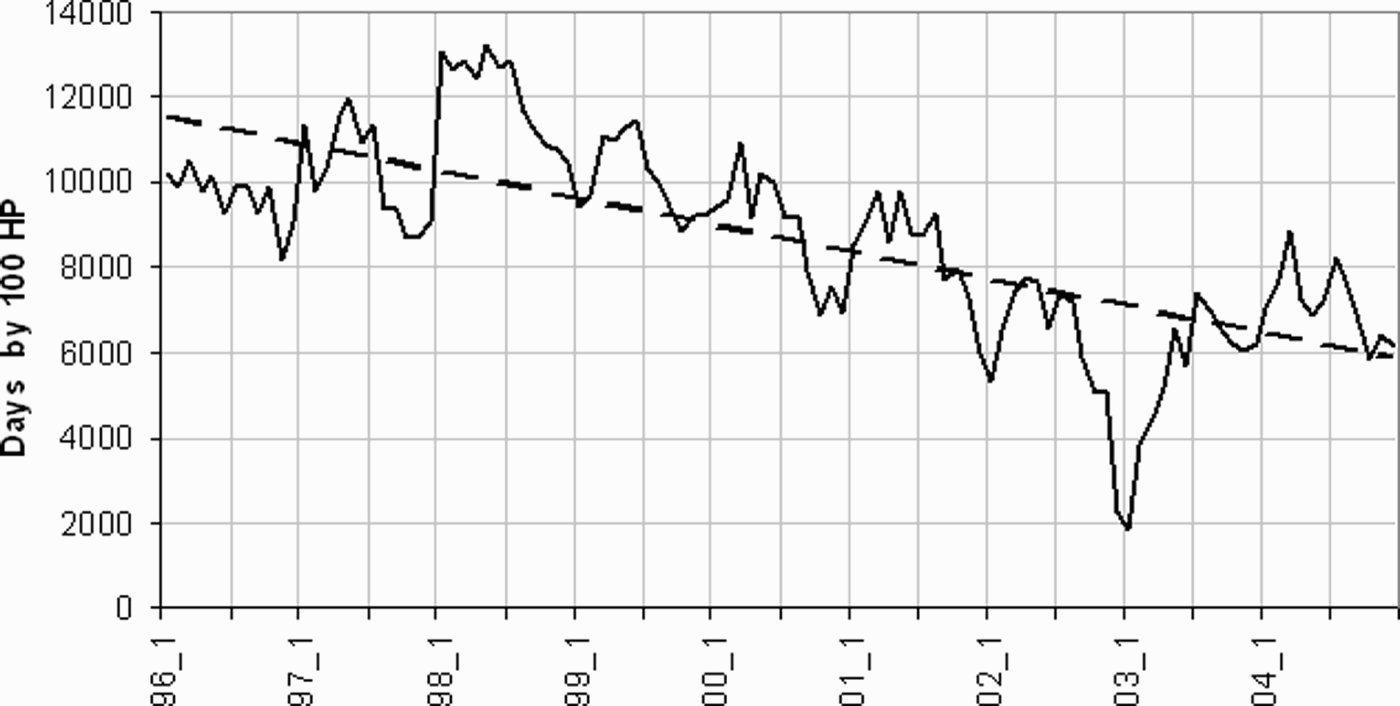
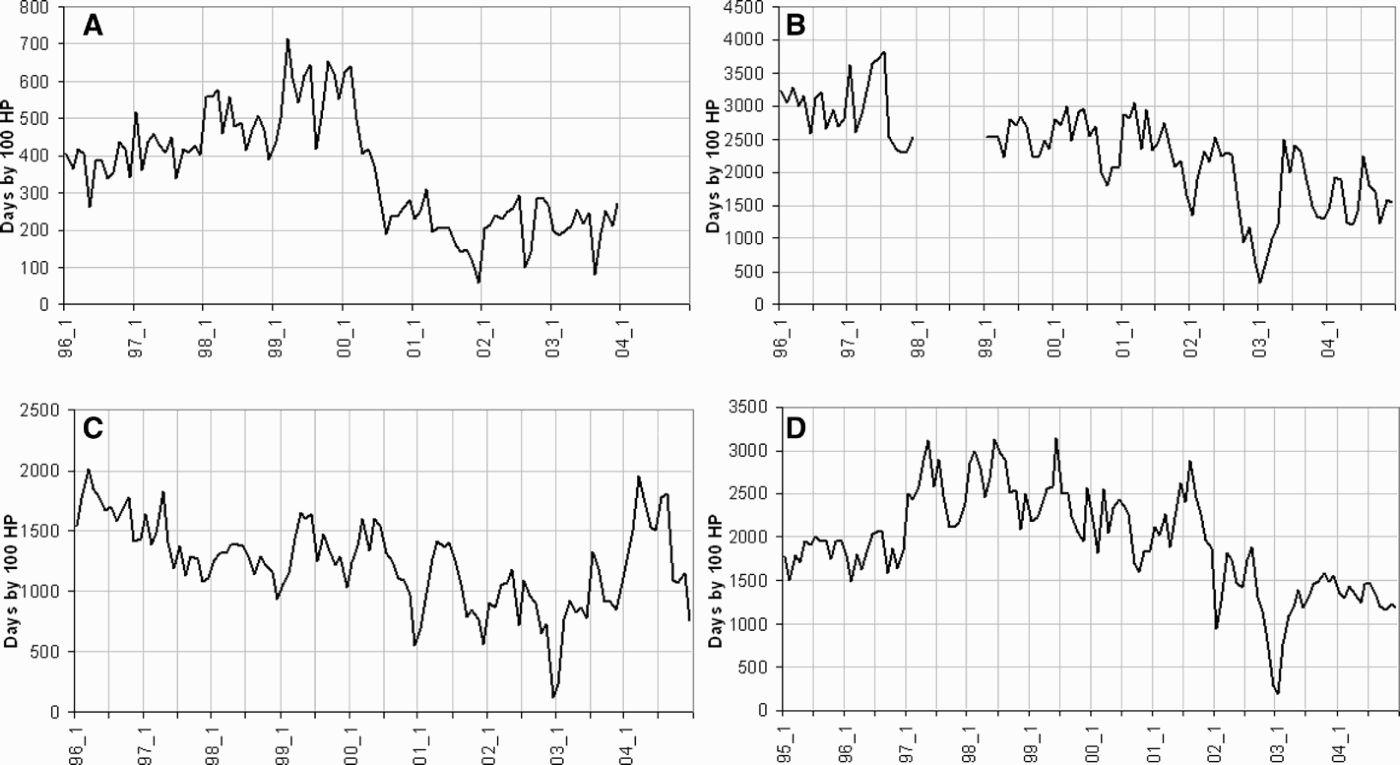
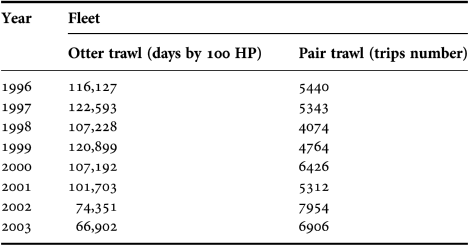
A considerable increase was observed in monthly effort for the whole otter trawl fleet between December 2002 and February 2003 (Figure 3). January was the month with the lowest value of those recorded in the entire historical series under consideration: 1.841 days by 100 HP, which is almost a third of the effort performed by the same fleet in January the previous year (5.330 days by 100 HP). From March onwards, there was practically no difference in fishing effort compared to previous years, values being at the same levels as the year before from the last six months of 2003 onwards. Analysing the evolution in effort of the main harbours operating with otter trawl in the VIIIc West (A Coruña) and IXa North (Marín and Vigo) subdivisions, a similar trend can be observed, with minimum values in February and a recovery of effort values to normal levels from April onwards (Figure 4). However, this trend was not observed for the Avilés fleet, the most important operating in the VIIIc East subdivision of ICES (Figure 4). This fleet's effort was very similar, especially during the spill, to that of the previous year. In this case, a decrease during summer which has been noticeable since 2001 could be observed. This fleet's total annual effort series trend is decreasing (Figure 3), and this tendency was maintained during 2003 (Table 2).
Total effort (days per 100 CV) of the trawling fleets between 1996 and 2003 in the ICES subdivisions VIIIc and IXa North.

Effort of otter trawl (days per 100 CV) per fleet: (A) Avilés harbour fleet; (B) A Coruña fleet; (C) Ribeira fleet; and (D) Marín fleet.

Total annual effort exerted by the Otter and Pair trawl fleets in the ICES subdivisions VIIIc East and West and IXa North.

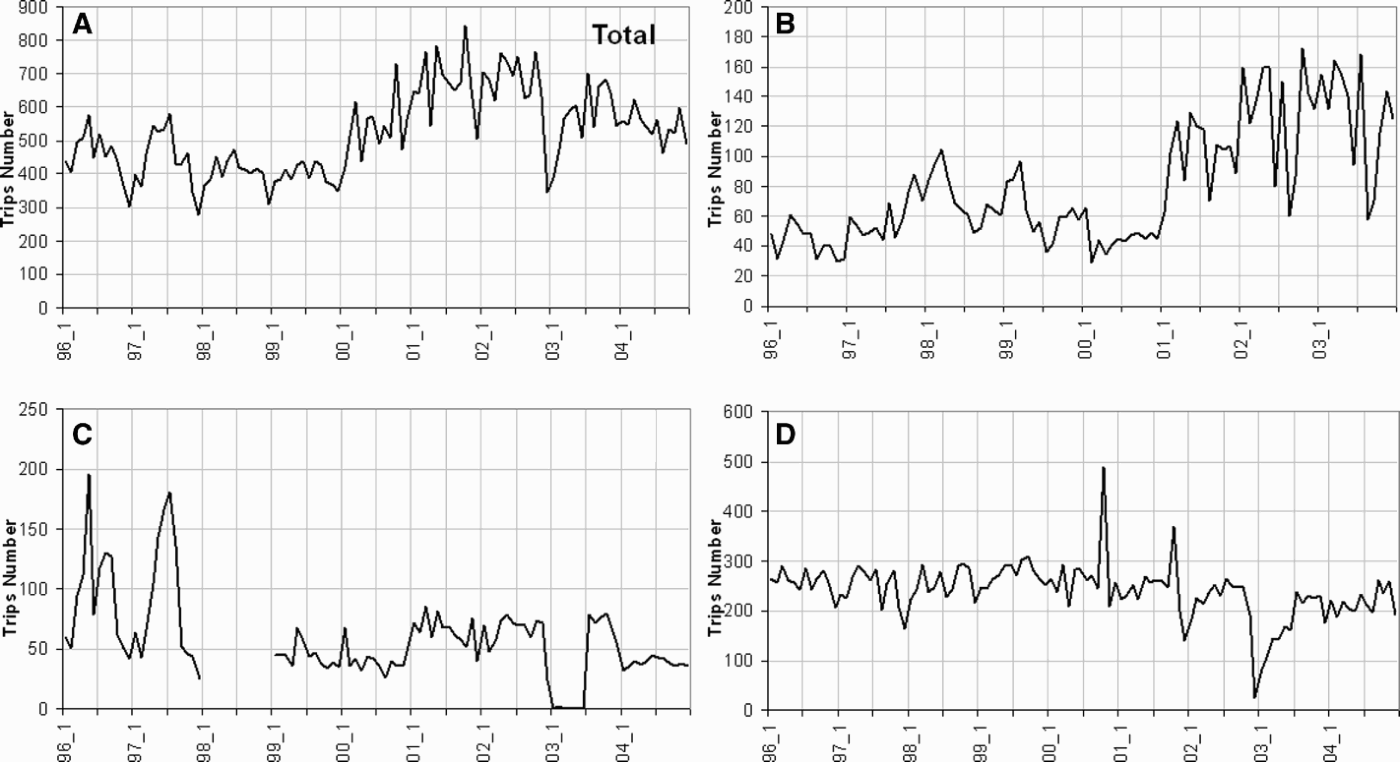
The total effort exerted by the pair trawl fleet during the spatial close suffered an important decrease from December 2002 and during the first six months of 2003 (Figure 5). Effort was minimal during December and January of this period, when 345 and 386 trips were done in the affected area, respectively. Each trip lasted one day. There was no clear trend over previous years, and 2003 was at the same level as previously (Table 2). With respect to effort per harbour, the Ribeira fleet showed a decrease during the same period as the general series. This fleet operates mainly in the IXa North subdivision, and reached during December 2002 and January 2003, the minima of the series (23 and 80 trips, respectively). A stop in activity (landings) was observed in the A Coruña harbour (VIIIc West subdivision) during the first semester of 2003 (Figure 5). No change was observed in the Avilés harbour fleet (VIIIc East subdivision), with respect to previous years. The only evident decrease during the summer was in the otter trawl fleet, which was similar in size to the annual recurrence since 2001 (Figure 5).
Total and per fleet pair trawl effort (trip number): (A) Avilés fleet; (B) A Coruña fleet; (C) Ribeira fleet.

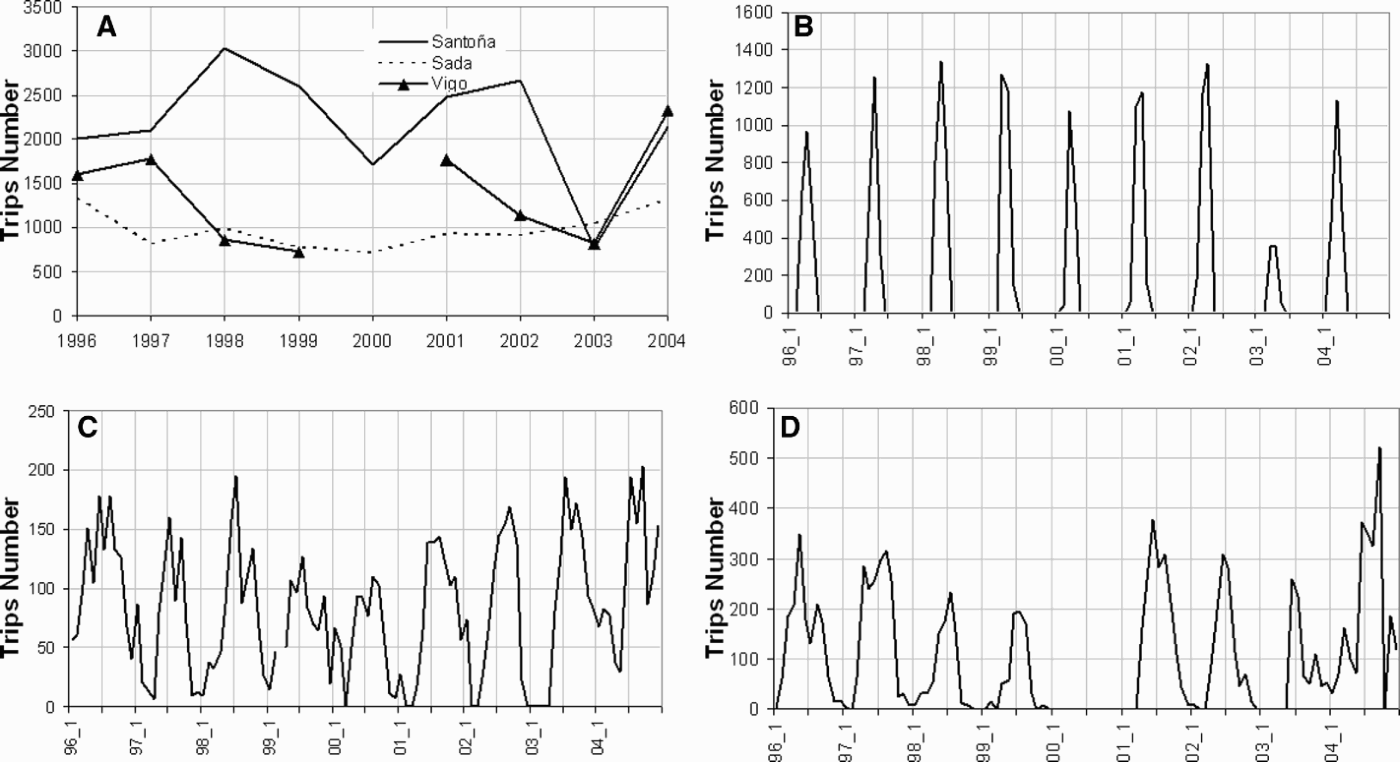
All selected pelagic fisheries have a marked seasonal character, i.e. while the mackerel fishery is carried out mainly between February and March; sardine is caught mainly during the summer (Figure 6). Also, in both fisheries, trips last for one day. We did not detect an important decrease in annual effort in either of the two fisheries targeting sardine, though an interruption in activity during the first months of the year was detected in the monthly analysis. This pause coincided mainly with a biological stop which was effective before the ‘Prestige’ catastrophe (Figure 6). As regards the hand line fishery targeting mackerel, a great decrease in effort throughout the 2003 fishing campaign was evident, only 759 trips being performed by the Santoña harbour fleet.
(A) Annual effort of the pelagic fleets (trip number); (B) monthly effort of the hook (handline) fleet of the Santoña harbour targeting mackerel; and (C, D) purse-seiner targeting sardine fleets of Sada (C) and Vigo (D).

Trawl effort spatial modification
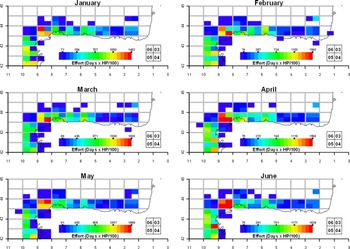
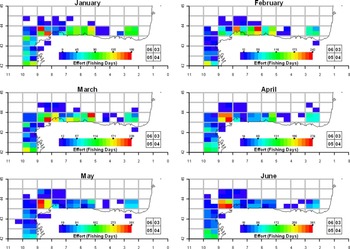
Figures 7 and 8 show efforts by statistical rectangle of the otter and pair trawl fleets respectively between 2003 (‘Prestige’) and 2004 – 2006 (post-‘Prestige’). In order to simultaneously compare the efforts of the four years in each statistical rectangle, the four years are represented clockwise by the four segments of a circle, i.e. the top right quadrant represents the effort of 2003, the bottom right 2004, the bottom left 2005 and lastly the top left is 2006. The pattern of colours refers to the total of the series in each month.
Spatial distribution of the otter trawl fleet in ICES subdivision IXa North and VIIIc from 2003 to 2006.

Spatial distribution of the pair trawl fleet in ICES subdivision IXa North and VIIIc from 2003 to 2006.

The values for effort In January 2003 are the lowest of the historical series in the entire area to the west of 5°W and to the south of the study area (in all statistical rectangles). To the east of 5°W, where the lowest efforts throughout the series are obtained, no change in the series is observed. In February there is a slight increase in the activity in all statistical rectangles affected contrasted to January, although they are still lower with respect to the rest of the series. In March and April the picture is very similar, and only is affected by the fall in effort in the area to the west of 8°W. In May a fall is only seen in the time series analysed in the statistical rectangle between 43°N and 43.5°N. The highest level of effort in this month is found on the continental shelf off A Coruña. To the south of 43°N values for effort come within the variability observed in the series. In June, low levels of effort are still observed in the area of the continental shelf previously mentioned.
In January, the effort of the pair trawl fleet only shows a fall to the south of 42.5°N and on the continental shelf off A Coruña (the statistical rectangle whose centre is 8.5°W and 43.75°N). In February an increase in activity is observed in these statistical rectangles, although it is still lower than the rest of the series analysed. From March the situation may be considered normal with respect to the rest of the series, or values come within the variability found in the series.
Analysis of specific composition by trawl trip
The most reliable segmentation, taking into account the previous knowledge of the fishery, was obtained using five clusters, three for otter trawl and two for pair trawl. Increasing the number of clusters creates nonsensical groups and does not improve the robustness of the clusters. These results describe more components than previous analyses (Punzón et al., Reference Punzón, Costas, Gancedo and Morlán2001; Bellido et al., Reference Bellido, Pérez, Castro and Araujo2003).
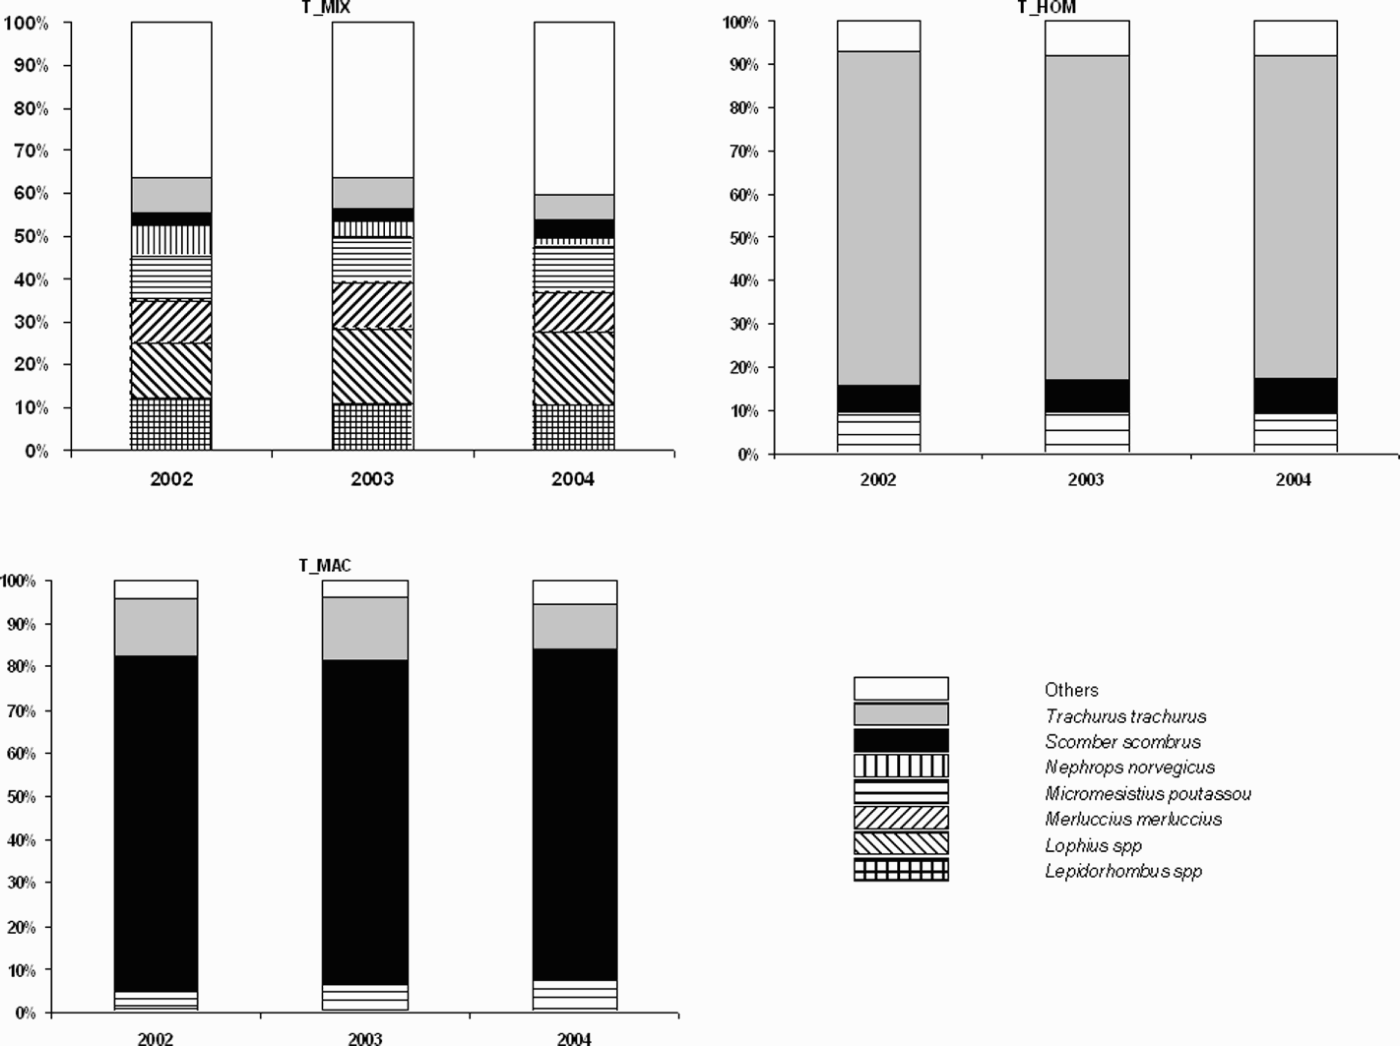
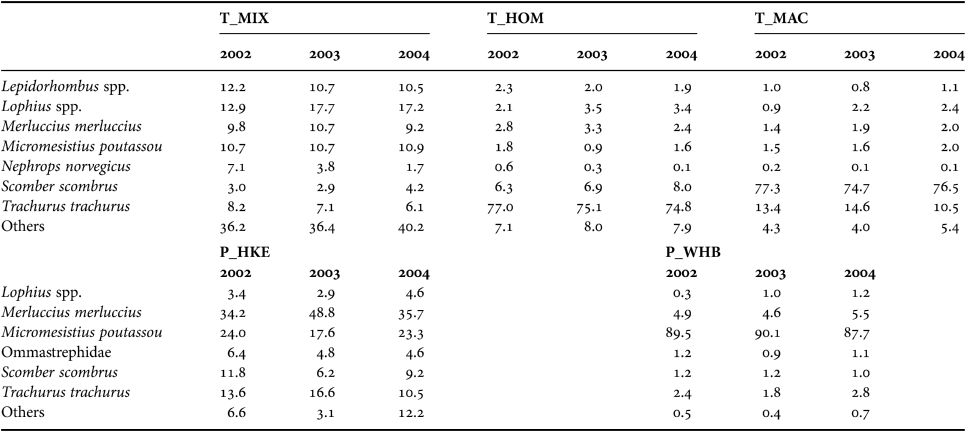
The three clusters obtained in the single trawl data set show the catch profile (Figure 9; Table 3) and could be classified as follows: trips targeting horse mackerel (T_HOM), trips targeting mackerel (T_MAC); trips targeting hake-megrim-monk-Nephrops (T_MIX).
Percentage inter-annual changes (2002–2004) for target species of the different otter trawl components: trips targeting horse mackerel (T_HOM); trips targeting mackerel (T_MAC); and trips targeting hake-megrim-monk-Nephrops (T_MIX).

Otter trawl and pair trawl métier species composition in the years 2002–2003 for otter trawl (trips targeting horse mackerel (T_HOM); trips targeting mackerel (T_MAC); trips targeting hake-megrim-monk-Nephrops (T_MIX)) and pair trawl (trips targeting blue whiting (P_WHB); and trips targeting hake (P_HKE)).

In the fishery targeting mackerel and in that of horse mackerel no changes are observed in the percentages of the main species. In the case of the mixed fishery a substantial change is only seen in the importance of Norway lobster, in which a fall of 46% in percentage of catch occurs in 2003 (the year of the spill) with respect to 2002 (pre-spill). In 2004 (post-spill) this trend continues, and only 1.4% of the total landed by this fishery is Norway lobster, whereas in 2002 the figure was 7.1%.
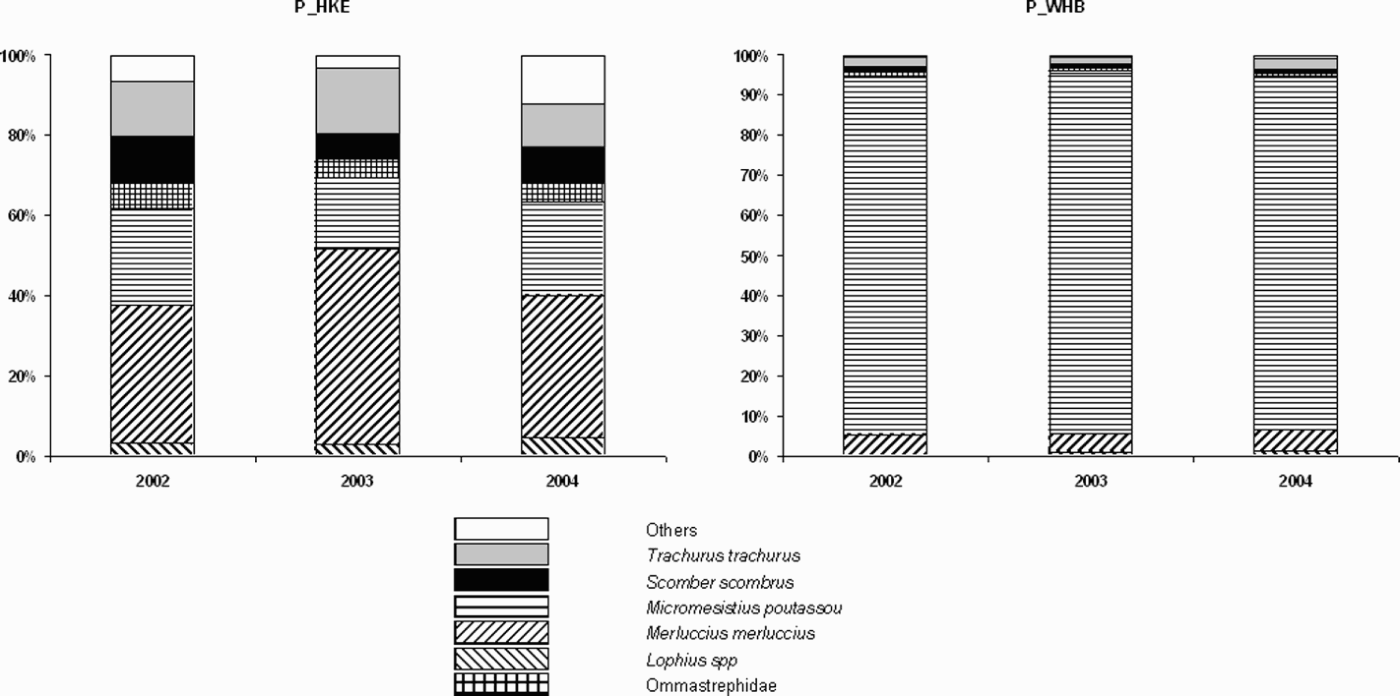
The two clusters obtained from the pair trawl fleet show the next profiles (Figure 10): trips targeting blue whiting and trips targeting hake. Taking into account the variability in the abundance of the pelagic resources, comparing both components between years, a similar catch profile is shown in both fisheries.
Percentage inter-annual changes (2002–2003) for target species of the different pair trawl components.

DISCUSSION
One of the immediate consequences of a spill such as that of the ‘Prestige’ is the establishment of fishing exclusion areas, as a measure to protect consumers (White & Baker, Reference White and Baker1998; Moller et al., Reference Moller, Dicks, Whittle and Girin1999). Normally, the most important impact of a black tide, or at least the most evident, occurs in the coastal zone (Lancaster et al., Reference Lancaster, Pawson, Pickett and Jennings1998), where the majority of accidents normally take place. Hence, in most cases, as in the ‘Jessica’ accident in the Galapagos Islands (Born et al., Reference Born, Espinoza, Murillo, Nicolaides and Edgar2003) or the ‘Sea Empress’ in Milford Haven, on the south-west coast of Wales (Law & Kelly, Reference Law and Kelly2004), closed areas are restricted to the coastal zone. In the case of the ‘Prestige’, the ban affected an important part of the continental shelf (Figure 2) due to the extensive areas occupied by the oil slicks, both on the sea surface (García-Soto, Reference García-Soto2004, CEDRE, 2004) and on the bottom (Punzón & Serrano, Reference Punzón and Serrano2003; Sánchez et al., 2003). Therefore the ban had a bearing on the fisheries, both industrial and artisanal, that had developed in these areas.
This type of measure which is applied to fishing activities is one of the tactics used to attain some sort of target or harvest strategy (Beddington & Rettig, Reference Beddington and Rettig1984; Lindeboom, Reference Lindeboom1994; Sobel & Dahlgren, Reference Sobel and Dahlgren2004). As with any other tactic or fishing regulation, its application may have its effects on selectivity, effort and fishing mortality (Pastoors et al., Reference Pastoors, Rijnsdorp and van Beek2000; Rijnsdorp et al., Reference Rijnsdorp, Piet and Poos2001). However, it is often quite difficult to quantify these effects (Quinn & Deriso, Reference Quinn and Deriso1999), although in the ‘Sea Empress’ case, an improvement was observed in lobster catches after the ban was lifted (Coates, Reference Coates and Edwards1998).
Pelagic fisheries
The dimensions of the superficial slicks and their rapid changes in distribution and direction, due to meteorological and oceanographic conditions, resulted in the bans affecting almost all the continental shelf from January to March 2003. The objective of these closed areas was to guarantee the operability of vessels and gear, together with protecting public health (Villamor, Reference Villamor2003). Consequently, semi-industrial pelagic fisheries such as purse seine types, even if characterized by a great mobility, were considerably affected by the ban, since their exploitation criteria (trips shorter than 24 h, exploited resources normally close to the coast and often marked by a strong seasonality, i.e. limited working area) are very similar to those of artisanal fisheries, normally the most affected by these accidents.
These criteria have also caused an impact on the various pelagic fisheries which has varied depending on the fishing season. Thus, only a small drop in effort at the beginning of the fishing season was observed in the purse seine fishery targeting sardine. This was, however, not reflected in the annual effort exerted by the main fleets, since the biological stop which existed prior to the spill coincided with the bans imposed after it. Conversely, in the line fishery targeting mackerel, a considerable decrease in effort was observed, since the ban directly affected the fishing season for this species (Punzón et al., Reference Punzón, Villamor and Preciado2004). This has caused an important decrease in catches, with a drop of almost half in the number of Spanish catches in this species' southern component in the north-eastern Atlantic (ICES, 2005b), and a decrease in partial fisheries mortality being evident for this species in 2003. However, due to historical variability, it is very difficult to establish a direct relationship between this decrease and the ‘Prestige’ spill (Trujillo et al., Reference Trujillo, Punzón, Abaunza, Bellido, Fariña, Landa, Meixide, Pérez, Velasco and Villamor2005).
Demersal fisheries
In this case the superficial distribution of fuel only affected the fisheries at the beginning and the ending of the fishing manoeuvre, and what really affected its extractive activity sensu stricto was the distribution of oil on the bottom of the sea. The closed areas which were imposed on these fisheries (Figure 2) coincide with this bottom distribution (Punzón & Serrano, Reference Punzón and Serrano2003; Sánchez et al., 2003) and were mainly limited to the coastal strip of the continental shelf. This, together with the fact that the fleet has greater mobility and that its trips may last longer than 24 h, results in efforts carried out by fleets of these or similar characteristics being less affected by the bans than after other spills (Born et al., Reference Born, Espinoza, Murillo, Nicolaides and Edgar2003). This was the case after the ‘Prestige’ spill, when only a mild decrease in effort was detected and only for some fleets in the beginning of 2003, often without a stop in activity.
Another of the possible consequences of the establishment of closed areas is that they prompt displacements of the fleet (Gulland, Reference Gulland1974) and hence a transfer of effort. With the available information (Figure 7), we have not been able to determine substantial changes in effort distribution in the continental shelf. This might have been due to the fact that the bans associated with the spill (Figure 2) coincided with special annual bans imposed on trawling during this period, mainly to protect hake recruitment (Figure 11).
Closed areas imposed annually on trawling.

A special case is that of pair trawling, in which there actually was a drop in effort in one of the fleets (Ribeira), while in others there was a total stop in activity (A Coruña) (Figure 5) during the first six months of 2003. This might have been because the ban for trawling was maintained for a longer period of time (Figures 1 & 5) in the area close to the A Coruña harbour. Also, although technical characteristics (boat length, TRB and HP) of the fleet involved in this fishery are generally the same as that of bottom trawlers (otter trawl) (Punzón et al., Reference Punzón, Costas, Gancedo and Morlán2001), its behaviour is similar to pelagic fleets, with trips of less than 24 h and most of their operations being carried out close to the landing harbour. A considerable decrease in total annual effort with respect to the previous year can be observed in 2003 (Table 2), but this is within the levels of preceding years, so it seems that the total stop in activity affecting the A Coruña fleet had no dramatic effect on its global effort.
Despite this, the effect of the bans was similar for both the otter and the pair trawl fleets. Contrary to what happens in pelagic fisheries, in which a global drop in effort was detected for the whole area, in demersal fisheries this drop was only found in the areas in which impact was maximal (ICES VIIIc West and IXa North subdivisions), while in the Cantabric they did not have a noticeable effect.
The length of the trip for otter trawls is 24 or 48 h, and for the pair trawls less than 24 h, for this reason the work area is close to the landing harbour. Therefore, the fall in the monthly effort of certain fleets meant there is a fall in effort in areas close to the landing port from which the fleet is assumed to be working. For this reason the locations of the closed areas imposed on trawl gears are related to the quantity of fleets (ports) affected. There is a spatial but no temporal correlation, since the effect of the closures, which in certain places last until June, is only detected until February or March. It is noteworthy that this does not occur in the A Coruña pair trawl fleet. Despite the absence of activity in the first half of the year, a fall in effort in the area close to this port is only observed in March. This may be because this fleet continued to work in its traditional fishing grounds and landings were made at the ports where its effort was not being recorded. This would explain why no increase is found in the fishing trips landed elsewhere.
Often relationships between effort and fishing mortality are not detected because, as was the case here, the analysed trends in effort do not cover the activity carried out de facto over a stock; there are alterations in fleet catches, or failures in the estimations of fishing mortality and abundance of the stocks. Additionally the models used are based on hypotheses which do not contemplate the possibility of a catastrophe of these dimensions (for example, they assume a constant natural mortality), so it is difficult to identify the possible causal relationships explaining them.
We did not observe differences in the two types of trips carried out by pair trawlers targeting hake and blue whiting respectively between the two years under analysis. We identified five trawling trip types, and only detected a decrease in the relative importance of Norwegian lobster in 2003 in the HMMN component, whose main target species are hake, Norwegian lobster, megrim and monk fish. The changes in the specific composition could be due mainly to changes in the fleet behaviour and their directionality or to changes in the abundance of the species in the area.
The reduction in the abundance of Norwegian lobster in 2003 was already observed by Sanchez et al. (Reference Sanchez, Velasco, Cartes, Olaso, Preciado, Fanelli, Serrano and Zabala2005) in the Galicia area although this decreasing trend had been detected previously to the ‘Prestige’ catastrophe (ICES, 2005). However, it should be taken into account that in the case of the ‘Prestige,’ considerable amounts of fuel have been found in the sediment (Punzón & Serrano, Reference Punzón and Serrano2003; Sánchez et al., 2003). In the case of the ‘Braer’ accident in the Shetland Islands the high concentration of PAHs found in the tissue of Norwegian lobster were explained by the high amounts of fuel in the sediments (Crean & Lacambra, Reference Crean, Lacambra, Lawrence and Hemingway2003). In fact, Norway lobster catches were banned for two years (Fisheries Research Service, 2000). No analyses of PAH (polycyclic aromatic hydrocarbon) contents in Norwegian lobster tissues have been made after the ‘Prestige’ spill, so we have no data regarding their concentration or development.
Apart from the considerations made to this point, one should consider that an important part of the fisheries in the area received different subsidies (Surís & Garza, Reference Surís and Garza2003). This may have had different consequences, as favouring abandonment of the fishing activity, changes in the technical characteristics, renovation of the fleet, exploration of new fishing grounds and/or resources, etc., aspects which are in need of further analyses and for which a longer temporal perspective is needed.
There are various aspects raised by this study that should be taken into account for future accidents. Other than making an immediate analysis of the resources that may be affected by the spill, it is important to analyse the fisheries that may be affected by the bans, as the establishment of these measures is almost guaranteed after an oil spill (Moller et al., Reference Moller, Dicks, Whittle and Girin1999). This should be done considering their seasonality and the management measures which have already been established so that an evaluation can be made a priori, not only of the affected fisheries, but also of those that are susceptible of being subsidized in such a way that a correct sampling design can be done to identify their consequences. This will allow us to determine which fisheries will be operative during the bans and sample them in order to analyse the effectiveness of the gear they use, and identify possible changes in effort and in the way it should be exerted. Finally, it is necessary to collect varied biological material, concentrating on crustaceans with a tight relation to the sediment so that not only the consumers' health is protected, but also further results are obtained to continue those given in this paper concerning Norwegian lobster.
ACKNOWLEDGEMENTS
This work was funded by ECOPREST Project (Spanish Science and Technology Ministry) and the Instituto Español de Oceanografía. The authors wish to thank all technicians involved in sampling and data storage. Also a special mention to the fishermen associations for their collaboration.