Introduction
Liquid crystals (LC) are a unique class of anisotropic materials those can explore a wide range of ordered phases. The latest experimental developments consider LC droplets as a promising tool for sensing biological and chemical events due to their label-free detection, phase-separation, and easy visualization.[Reference Kato1] LC-based bio-sensing systems are typically used to detect the interaction among the biomolecules by utilizing an aligned nematic state of the LC droplets.[Reference Hu and Jang2–Reference Lee, Chang and Lee7] Concurrently the interest in studying the drying drops is growing in the recent years and has attracted the attention of bio-medical and forensic applications. The drying systems include suspension of colloids, proteins (lysozyme, bovine serum albumin), LC, nanocrystals, biofluids, etc.[Reference Ryu, Kim, Kim and Weon8–Reference Brutin and Starov15]
Apparently, the self-assembled drying mechanism of a combined system consisting of protein and LC (without any prior alignment) has not attracted any attention. This work bridges the gap between LC and drying protein droplet research by introducing a conventional, thermotropic LC at the initial concentrations of LC droplets  $\lpar \emptyset \rpar $ into a lysozyme–water system. Lysozyme is often used as an archetype in studying the drying mechanism of the protein solutions. Therefore, adding bulk LC droplets in a simplest lysozyme–water system helps us to identify the effects of these droplets in the form of emerging patterns. The main findings of this paper include (1) a temporal study providing a qualitative description of the collective motion and the inter-particle interactions of the protein particles and the LC droplets. The main advantage is that the self-assembled structures are formed in the absence of any external field––either electric or magnetic, and induced due to evaporative flow; (2) a birefringence intensity profile of the temporal study reveals three regimes in the lysozyme drops with LC droplets, first with a slow increase of intensity, followed by a rapid rise in the transition regime and finally the saturation of the intensity when the evaporation of the water in the drop is about to complete; (3) the textural study [first-order statistics (FOS) and gray level co-occurrence matrix (GLCM)] is performed on the images of the dried drops. It reveals that the structural changes at various concentration of LC droplets (
 $\emptyset $) follow simple exponential laws[Reference Carreón, Ríos-Ramírez, Moctezuma and González-Gutiérrez16]; and lastly (4) it is observed with statistical evidences that the mean crack spacing (
 $\bar{x}_{\rm c}$) near the edge of the drop appears to be larger in the presence of LC droplets than that in central region at different
 $\emptyset $.
Experimental methods
Lysozyme, mostly found in human mucosal secretions, has a molecular mass of ~14.3 kDa with a roughly ellipsoid shape of dimensions 3.0 nm × 3.0 nm × 4.5 nm.[Reference Gorr, Zueger and Barnard17] The commercial lysozyme powder (Sigma Aldrich, USA, L6876) of 100 mg was massed and dissolved in 1 ml of de-ionized water (Millipore, a resistivity of 18.2 MΩ.cm, density of 0.9970 g/mL at 25 °C) to prepare an initial protein solution. The nematic LC 4-cyano-4′-pentyl-biphenyl (5CB, Sigma Aldrich, 328510) has a nematic to isotropic phase transition temperature of ~35 °C. The LC was heated just above the transition temperature and added to the protein solution. Different volumes of LC were added to make the initial concentration of LC droplets ( $\emptyset $) as 0.23, 0.46 and 0.91 wt%. Further, an LC and de-ionized water solution were also made. All the samples were ultrasonicated, a circular drop of volume ~1.3 µL was created and allowed it to dry under ambient conditions (room temperature of 25 °C and relative humidity of 30%).[Reference Pal, Gope and Iannacchione18]
The drops were observed using an optical microscopy (Leitz Wetzlar, Germany) with a 5× objective lens, 8-bit digital camera (Amscope MU300) at a resolution of 2048× 1536 pixels and analyzed with ImageJ.[Reference Abràmoff, Magalhães and Ram19] The time lapsed images were taken between crossed polarizers for the duration of the drying process. A circular region of interest (ROI) was drawn on the gray images with the Oval tool of ImageJ. In the next step, the mean intensity (intensity per pixel) was determined for all the sample drops and background (coverslip) with ImageJ. A calibration of the image was conducted in respect to the coverslip and the corrected intensity for each sample (I c) was measured. Drops from the same sample set were deposited three times by keeping the lamp intensity fixed. The whole procedure was repeated and the averaged intensity ( $\bar{I}_{\rm c}$) was plotted against time. To study the morphology of the dried drops, different sections of each drop were imaged separately as the ~2 mm diameter drop could not be captured under 5×. The image of the whole drop was extracted with the Stitching plugin[Reference Preibisch, Saalfeld and Tomancak20] of ImageJ. For the crack analysis, only bright-field images were converted into gray, filtered with a variance filter, and processed into binary images. All the images of the dried drops were converted into a scaled stack and three circular-cut lines were drawn in each region (near the drop edge and the central region) using the Oval Profile plugin of ImageJ. The 8-bit intensity values (255 for pixels depicting the crack lines and 0 for pixels elsewhere) were plotted as a function of arc-length along each circle at every 0.1°. A script employing “Array.findMaxima” was used to determine the positions of maximum intensity values. The consecutive maxima difference provided an estimate of the spacing between cracks (x c) along each circular line. The x c values which did not fall within ±0.005 mm were considered in respect to the reference circular line in order to avoid double-counting. The data were aggregated to yield an average (
 $\bar{x}_{\rm c}$) in each region as a function of the different concentration of LC droplets (
 $\emptyset $).[Reference Pal, Gope and Iannacchione18] FOS and GLCM parameters were extracted from 8-bit images of the dried drops for the textural analysis. The images were taken between the crossed polarizers using the Texture Analyzer plugin of ImageJ. These analyses indicated a uniform (high) reproducibility for each sample.
Results and discussions
Temporal study in drying drops
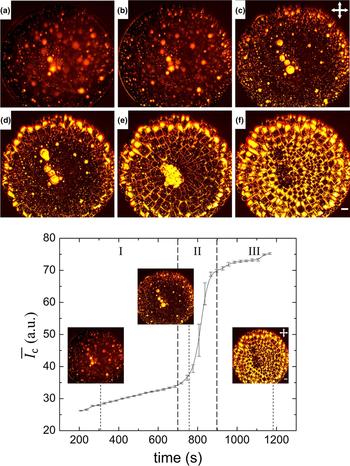
A sessile drying drop generally features a curved air–fluid interface. Time dependence of a drying LC–lysozyme drop at a concentration of LC droplets ( $\emptyset $) of 0.91 wt% between crossed polarizers is shown in the top panel of Fig. 1. The drop was pinned to the coverslip and a convective flow of both the protein particles and LC droplets took place. These droplets were bright in the cross-polarizing configuration due to their birefringence nature. Similar to the lysozyme–water system (
 $\emptyset $ of 0 wt%), this system too decreased along the contact angle [revealing a blur to prominent bright spots, Figs. 1(a)–1(c)]. As soon as the contact angle reached a minimum configuration, a fluid front started moving from the edge to the center (similar to the lysozyme–water system). An outline at the curved interface [Fig. 1(b)] was observed indicating a starting effect of the “coffee-ring” (alternatively called rim). The solvent loss was highest near the drop edge; as a result, all particles were rushed with the flow to compensate the non-uniform evaporation rate. The big LC droplets (small LC droplets clustered together) were mostly observed in the central region (these were originally found there, while depositing the drop). The small LC droplets were spread (easily flowed by the convective and radial flow) throughout the drop, mostly near the drop edge [Fig. 1(c)]. The restrictive movement of the big LC droplets was possibly due to their viscous nature, resulting in space confinement by flow-induced shear force. However, big LC droplets went through a little orientation, alignment, or tumbling as induced by inherent non-uniform fluid front flow due to the attractive forces (capillary, van der Waals, and dipolar interactions) between adjacent LC droplets [Fig. 1(d)].[Reference Jeong, Gross, Wei, Tu, Lee, Collings and Yodh21] The individual big LC droplets further merged and coalesced into bigger LC droplets, resulting in increasing the optical intensity [Fig. 1(e)]. Like lysozyme–water system, this system also showed the rim which was at a greater height from the central region due to the deposition of most of the lysozyme particles. Finally, a mechanical stress originated due to the solvent loss and the pinning of the drop leading to the formation of cracks (starting from the drop edge). The crack lines started forming like the lysozyme–water system; however, a slow and ordered way was observed in this system. Subsequently, a fast follow-up process of LC droplets took place in the crack lines [all lines become bright, Fig. 1(e)]. A simultaneous process of filling of domains (created by the cracks) with LC droplets started at the drop edge, unlike lysozyme–water system. This whole process of LC-filling completed within a time span of ~2 min (starting from ~745 to ~865 s). The final step of the drying process was the formation of the self-assembled patterns of the lysozyme particles in the presence of a small fraction of LC droplets [Fig. 1(f)]. The miscibility of the solutes (LC droplets and lysozyme particles) is the key to obtain this pattern after the water evaporates from the system. The LC droplets were found to be partially soluble in the de-ionized water; whereas, the lysozyme particles without LC droplets form a homogeneous solution with water. However, the inclusion of LC droplets into lysozyme without water was not possible as we have used lyophilized lysozyme. The striking feature of this study is the phase separation of LC droplets induced by the convective flow of solutes and the loss of water during the drying process. A complete video of drying LC–lysozyme drop is available in the Supplementary section.
Top panel: Time-lapse images of drying LC–lysozyme drop at the concentration of LC droplets ( $\emptyset $) of 0.91 wt%. (a) 193 s showed an initial stage of drying where the contact angle started to decrease. A radial flow of the particles to the drop edge at (b) 403 s and (c) 731 s are shown. Merging of big sized LC droplets in the central region and filling of LC droplets at the drop edge were displayed at (d) 791 s and (e) 815 s. The self-assembled structures after visual evaporation was observed at (f) 1193 s. Bottom panel: Intensity variation with time of LC–lysozyme drop showing three regimes, an initial slower regime (I), a transition regime (II), and a saturation regime (III). The error bars correspond to the standard deviation. The microscopic images in I, II, and III were taken at 301, 745, and 1193 s, respectively. The crossed polarizing configuration is depicted by crossed double arrows. The white color in the right corner is a scale bar of 0.20 mm.

The bottom panel of Fig. 1 illustrates a typical intensity response of LC droplets (since only LC droplets are birefringent) varying with drying time in LC–lysozyme drop at  $\emptyset $ of 0.91 wt%. Furthermore, a clear correlation between the top and bottom panels of Fig. 1 was made. Initially, the intensity did not change much for a certain period (up to ~700 s). The movement of LC droplets and the change in the intensity were not quite visible during this period (regime I) due to spherical-“cap” shape of the drop. However, this shape got reduced by the decrease of the contact angle and finally reached a minimum value. In regime II, by maintaining the minimum contact angle configuration, the onset of LC activities (such as merging and filling up the crack domains) increased resulting in a rapid increase of intensity. This transition period (regime II) was only found for ~200 s, in which the intensity varied from ~35 to ~69 a.u., i.e., an increase by a factor of two: the rate of change in intensity with time is ~0.17. The standard deviation was higher in the transition than all other regimes due to the presence of different sized big LC droplets in different drops. As this regime was solely dependent on the LC activities, it resulted in the change of the intensity (values) for three different drops and hence, a higher standard deviation was observed. It was followed by regime III in which the intensity saturated as the drop was about to complete the drying process.
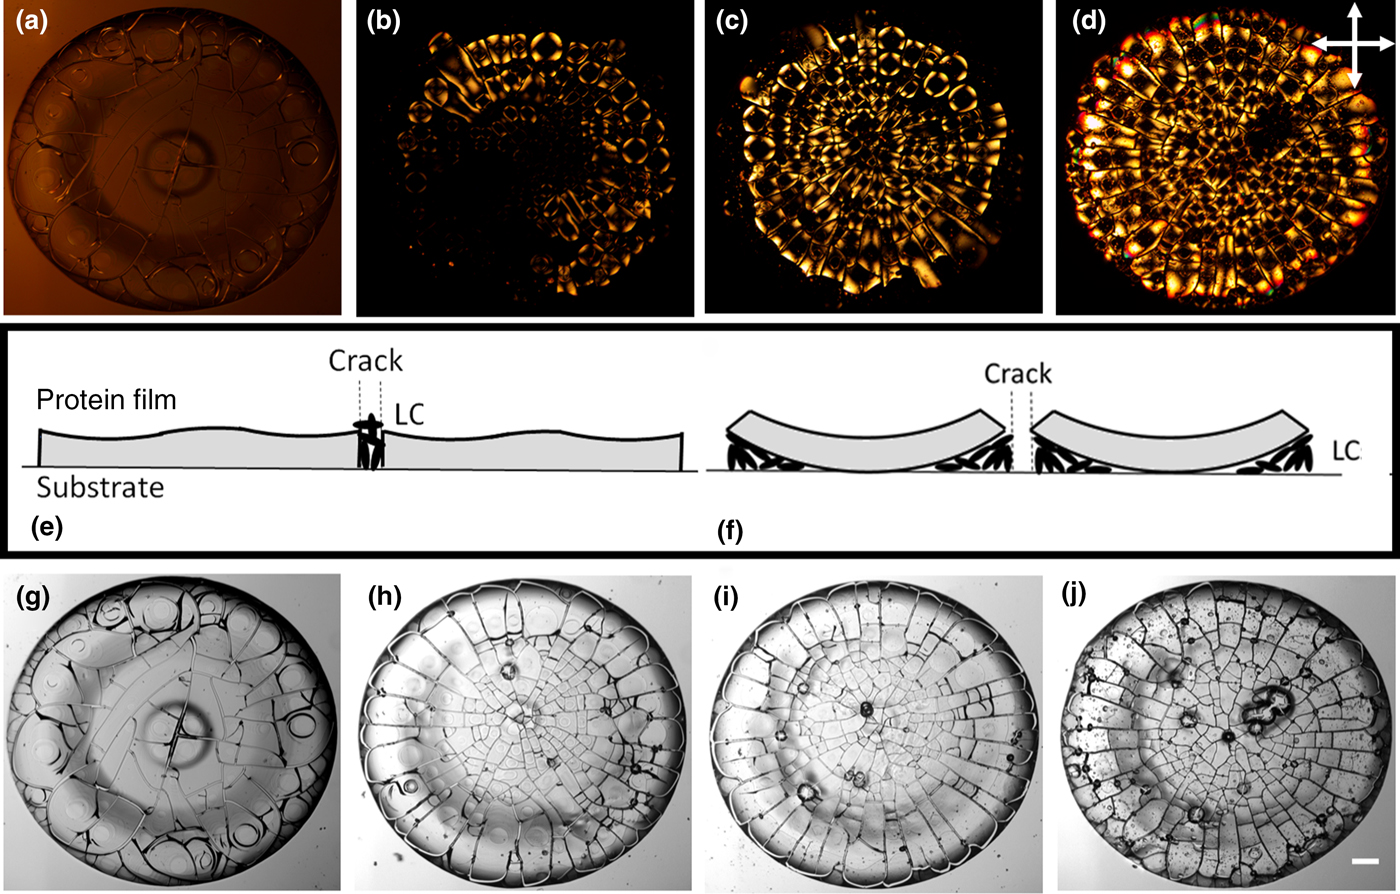
The drying system of LC–water was also studied in this paper and we observed a slow movement of bulk LC droplets toward the drop edge. A non-uniform evaporation of water was observed in the LC–water drop and the LC droplets remained at the surface (coverslip) due to LC–surface interaction. Contrary to the LC–water system, in the lysozyme–water system [concentration of LC droplets ( $\emptyset $) of 0 wt%], the lysozyme particles were distributed on the coverslip to form a protein film during the convective flow. It followed by a radial flow of particles toward the drop edge which helped to deposit most of the particles. Then, the fluid front started moving from the edge and rest of the particles were carried to the center resulting in the formation of “mound”-like structure [Figs. 2(a) and 2(g)]. The averaged intensity
 $\bar{I}_{\rm c}$ was measured for both LC–water and lysozyme–water systems in which no variation of intensity in drying time was observed. However, LC–water showed a higher value of intensity than lysozyme–water system due to the birefringence nature of LC droplets. A significant difference was noticed between LC–water and lysozyme–water or lysozyme–LC drop, i.e., there was no coffee-ring or no self-assembled patterns in the absence of lysozyme (protein) particles. This reveals that the significant contributions to the final patterns were lysozyme–lysozyme and LC–lysozyme interactions. Furthermore, protein in general has a non-uniform surface, with most of the hydrophobic regions sheltered inside and with exposed charged or polar residues. This helps in making it available for new points of attraction with either neighboring protein particles or LC droplets.[Reference Paul, Paul, Basova and Ray22] LC has its own dipole moment due to the presence of cyano group at its one end.[Reference Prost23] The accumulation of LC droplets into the protein solution has a tendency to form lysozyme–LC complexes. These complexes were formed by attracting the exposed parts of the protein to the cyano group of 5CB. At this point, the electrostatic attraction is almost zero due to non-involvement of external salts/ions. Nonetheless, this attraction may not have a large contribution owing to the presence of cyano groups at one end of the LC droplets and due to the overall positive charge of lysozyme.
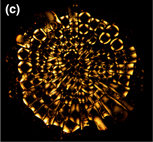
The morphology of drops after 24 h. Top panel: Drops imaged in crossed polarizing configuration. The initial concentration of LC droplets (∅ in wt%) is (a) 0, (b) 0.23, (c) 0.46, and (d) 0.91. The drop without LC droplets (∅ of 0 wt%) showed very weak birefringence; therefore, lamp intensity was increased for clear visualization. Middle panel: (e) and (f) show a proposed mechanism for the evolution of the unique patterns. Bottom panel: Gray scaled drops imaged in bright field configuration, where ∅ in wt% is (g) 0, (h) 0.23, (i) 0.46, and (j) 0.91. The scale bar corresponds to 0.15 mm.

Morphological study in dried drops
The available stress in the dried drops (after visible evaporation) was relieved by the increase in the number of cracks. Also, the flow of LC droplets was found to be affected in the drops [Fig. 1(f) which was taken after visible evaporation and Fig. 2(d) which was taken after 24 h at the concentration of LC droplets ( $\emptyset $) of 0.91 wt%]. We observed that some regions in the dried drop initially had more LC droplets (bright regions) and then, uniformly distributed toward the end of the day. Hence, all the dried samples were imaged after 24 h.
Figures 2(a)–2(d) show the images of the dried lysozyme drops with and without LC droplets imaged in the crossed polarizing configuration. The lamp intensity of the dried lysozyme drop without any LC droplets [concentration of LC droplets ( $\emptyset $) of 0 wt%] was increased for a clear visualization. It is well known that lysozyme in crystal form shows birefringence and scatter light depending on the domain size.[Reference Singer, Nieminen, Gibson, Heckenberg and Rubinsztein-Dunlop24] However, our perception is that only the evaporation process (the loss of water) from the lysozyme solution without LC droplets may not be able to form crystals completely. The scattering of light was mostly visible near the crack lines once the lamp intensity was increased to maximum. These lines were the areas without any lysozyme particles or 5CB droplets and were just the bare coverslips leaking the light from the microscope probably. Hence, comparing
 $\emptyset $ of 0 wt% to other concentrations, it could be inferred that lysozyme–water system exhibits a very weak birefringence. This indicates that, the optical activity in cross-polarizing imaging was mostly due to the activities of the LC droplets. Contrary to the lysozyme–water system, LC–lysozyme systems showed a dark region in the interior and bright regions at each corner of every crack domains. In this context, a physical mechanism is proposed to understand the self-assembled patterns in the lysozyme drops due to phase separation of LC droplets [Figs. 2(e) and 2(f)]. During the convective flow of the drying process, most of the lysozyme particles were distributed on the coverslip and resulted in a protein film. However, it is possible to have some LC droplets to get trapped in the film or to be on the top of the lysozyme film. The external stress increased due to solvent loss and the drop cracked resulting in different sized interconnected domains. A simultaneous process of buckling in every domain took place. Two scenarios were possible; (i) the presence of the LC droplets was on the top of the lysozyme film; and/or (ii) the presence of these droplets was underneath the film. It was found in Figs. 1(d)–(f) that LC droplets were following the crack lines (channels) for their distributions in every domain, starting from the drop edge. Moreover, after completing the visible evaporation, the LC droplets distributed in the crack lines depicted by bright color [Fig. 1(f)], but within 24 h the crack lines became dark [Fig. 2(d)]. If the LC droplets were present on the top of the film, then their flowing through the crack lines would not be possible because the protein film is at a greater height near the drop edge (compared with the central region). The change of the bright crack lines into dark within 24 h would also be baffling. In addition to this, the air–LC interface is known to have weak homeotropic anchoring; hence, all the domains would have shown a radial point defect in the form of the Maltese cross (a cross always lining up with the polarizer and analyzer); but here, that was not the case. The dried drops in the presence of LC droplets showed a dark region which is likely to be the attached lysozyme film to the coverslip (substrate) and most of the bright regions were the randomly oriented LC droplets underneath the protein film; suggesting being the second scenario (mentioned above). Within 24 h, the lysozyme domains were more uplifted (buckled) and the LC droplets flowed inside the domains from the crack lines through the capillary action. The representative of most of the domains in the dried drops with LC droplets show randomly oriented LC droplets in the bright regions. However, in some of the domains, a perfect radial configuration (Maltese cross) was observed probably due to the presence of the LC droplets at the air–LC interface. On the other hand, some of the crosses often seem to align with what was likely a radial flow during the drying process. In addition to this, most of the crack domains contained a single dark region at the center, some were found to be off-centered probably due to the domain shape and the unstable buckling mode. The centered configuration would evolve from that off-centering when buckling start to develop fully.[Reference Islam, Nobili, Ye, Lubensky and Yodh25, Reference Zou and Fang26] To ensure that each of the domain had a distribution of LC droplets with random orientations, the domains were rotated with a sample angle for a complete revolution, and we did not observe any optical change in the patterns. All crack lines appeared dark even when the sample angle was varied for a complete revolution and no uniformed angular dependence with the intensity was found when compared among different domains.
In Figs. 2(b) and 2(c), an uncertainty arose in the count of the bright regions in the drop as LC droplets were partially soluble in the water. But these drops were the most repetitive ones and we concluded that LC droplets were not enough to fill the whole surface of the drop. The LC concentration up to 0.91 wt% was chosen which was just enough to fill the whole drop of radius ~1 mm. It was also observed that further increase of LC concentration (for, e.g., 1.82 wt%, or more) made bright blob-like structures which restricted the smooth flow of LC droplets within the drop.
A minute observation of Figs. 2(c) and 2(d) confirmed the presence of ripples in some dark regions of the domains. These were formed because of an air gap between the protein film and packing of LC droplets. These domains had a non-uniform thickness and these small (unavoidable) variations were depicted by different colors (reddish, yellowish, greenish) in the drops.[Reference Heo and Park27, Reference Ohzono, Katoh, Wang, Fukazawa, Yamaguchi and Fukuda28]
In the bright field imaging, the gray images with and without LC droplets were shown in Figs. 2(g)–2(j). Following the observation of the morphology at  $\emptyset $ of 0 wt% [Fig. 2(g)], it could be argued that the stress was built not only along the fluid front movement, but applied from all directions. The gradient in the protein-film thickness (a thick sheet in rim, a thin sheet in the center, and an extremely thin sheet in between the regions) resulted in a chaotic system. Therefore, it could be concluded that a random (chaotic) crack is a response to the lack of dominant stress in any specific direction. Unlike Fig. 2(g), the presence of viscous, denser particles (here LC droplets) enabled the cracks to experience mostly azimuthal tensile stress (the stress along the fluid front), leading to radial and highly ordered cracks. Fine radial, regularly spaced cracks appeared first near the drop edge (rim), then the big LC droplets tried to fill in the large crack domains, and a further flaw was developed with the propagation of desiccation. Due to these flaws, the long and large radial cracks were developed throughout the drop. However, the orthoradial cracks appeared in the rim to release the available local strain energy in the domains created by the radial cracks. This helped the cracks to curve and join the consecutive radial cracks. Furthermore, both orthoradial and radial cracks continuously appeared in the central region to release the remaining stress in the drop resulted in forming the small domains (when compared with the domains in the rim). Further, a prominent “mound”-like structure in the central region of the drop in the absence of LC droplets (
 $\emptyset $ of 0 wt%) was observed; however, the presence of LC droplets was likely to prevent or disturb this formation. This structure was likely to be “free” lysozyme particles that were light enough for the fluid front to carry to the center.[Reference Pal, Gope and Iannacchione18] The out-of-equilibrium drying of this system and the increased viscosity, density and surface tension gradients (LC–coverslip, LC–lysozyme, lysozyme–coverslip interfaces) helped in the protein aggregation throughout the whole drop. In addition to this, LC droplets were affected in forming the small domains in the central region and big domains (highly ordered, uniform radial cracks) in the rim. The perception is that LC droplets in the central region did not get to relax to a smooth uniform state owing to the in-homogeneous, fast fluid front movement as soon as the front part touched the big LC droplets while propagating from drop edge. On the other hand, in the rim, the absence of big LC droplets helped the fluid front to move in a uniform way. As a result, the smaller LC droplets gathered enough time to anneal into the homogeneous structures, resulting in the big domains.[Reference Davidson, Huang, Gross, Martinez, Still, Zhou, Collings, Kamien and Yodh10] Moreover, in all systems, the curved and wavy-ring patterns were found near the drop edge possibly due to the stress originating from the boundaries created by the radial cracks.[Reference Gao, Huang and Zhao29] A minute observation of Figs. 2(h)–2(j) showed a gelation between central and rim regions in the presence of LC droplets. This region believed to be a transition region in the protein film thickness and we conclude that the dispersion of LC droplets within the film trapped some water during the fluid front movement and formed this gelation.
Interestingly, no rim width dependence was observed with varying concentration of LC droplets ( $\emptyset $). This expanded our knowledge that the rim was only affected by the concentration of protein particles and not from the added amount of LC droplets. The independence of rim width on
 $\emptyset $ (due to the dispersion of LC droplets into different crack domains) supported the physical mechanism proposed in this paper.
Textural analysis in dried drops
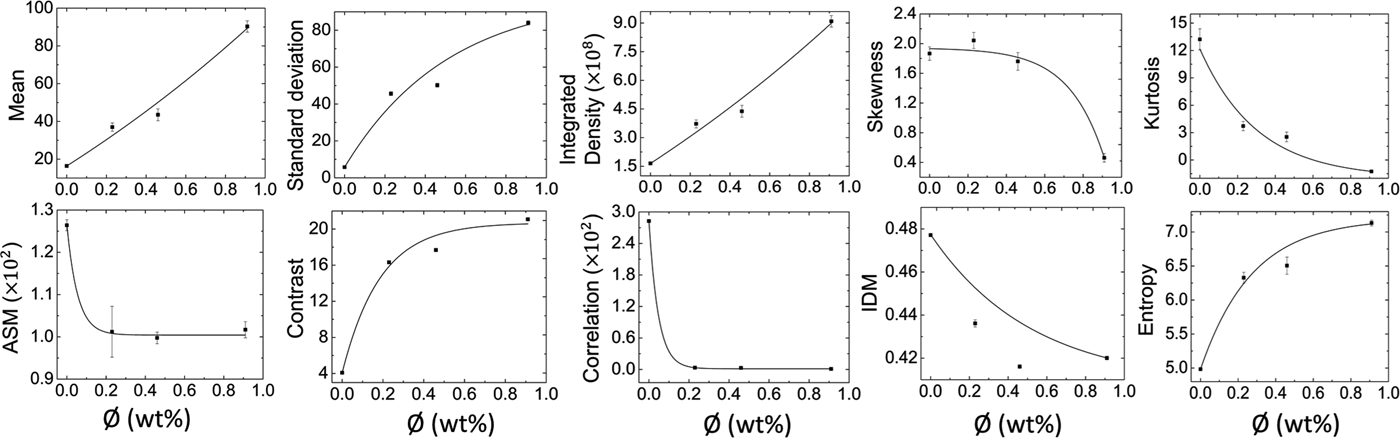
FOS depends on the pixel distribution of the selected ROI, whereas GLCM depends on the interpixel relations. Though these are complimentary measurements to evaluate drop texture, interestingly all the parameters followed a simple exponential law when varied with the concentration of LC droplets ( $\emptyset $).[Reference Carreón, Ríos-Ramírez, Moctezuma and González-Gutiérrez16] The equation stated as:
 $$\delta = \delta _0e^{- \textstyle{\phi \over k}} + \delta _{\rm s},$$
where δ is the textural parameter, δ 0 is an initial textural parameter, δ s is the saturated parameter and k is the characteristic concentration at which the parameter diminishes by the 1/e factor.
The variation of  $\emptyset $ affected the textural patterns (morphology) in the dried drops (Fig. 2). The top panel of Fig. 3 showed FOS parameters in which the mean determines the intensity per pixel of the selected ROI within the drop, standard deviation determines the variation around the mean values relating to the roughness of the image texture, and integrated density determines the total pixel intensity of the ROI. All grew exponentially due to the increase of LC-dominating regions resulting in an increase of the brightness (hence, the pixel intensity of the image).[Reference Carreón, Ríos-Ramírez, Moctezuma and González-Gutiérrez16] Both the skewness and kurtosis, in contrast, decreased with the increase of LC-dominating regions possibly due to the intensity distribution (histograms changed from asymmetrical to symmetrical tailed). The lowest values of skewness and kurtosis were found at the highest
 $\emptyset $. The bottom panel of Fig. 3 showed GLCM parameters varying with
 $\emptyset $, i.e., ASM measures global homogeneity in the texture, correlation measures the degree of similarity in a row or column direction of the image texture and IDM measures local homogeneity of the selected ROI. All these displayed an exponential decrease due to the decrease in the uniformity of the texture with the increase of
 $\emptyset $. On the other hand, contrast and entropy increased in terms of the number of pixels and the heterogeneous regions formed. An increase in the diversity of the self-assembled structures occurred when
 $\emptyset $ was varied through the increase of bright LC-dominating regions in the dried textures.[Reference Carreón, Ríos-Ramírez, Moctezuma and González-Gutiérrez16]
Texture analysis of dried drops. Top panel: First-order statistics (FOS) reveals the pixel distribution through mean, standard deviation, integrated density, skewness, and kurtosis. Bottom panel: Gray level co-occurrence matrix (GLCM) reveals the interpixel relations through ASM (angular second moment), contrast, correlation, IDM (inverse difference moment), and entropy. The exponential fit for the curves are shown in each graph. The error bars correspond to the standard error.

It can be hypothesized that these analyses (FOS and/or GLCM) in the final deposits of any drying drops will follow simple exponential laws. Our perception is that these structural changes following the exponential laws are not due to any contribution of external salts, as our experiments were conducted by varying LC concentrations only.
Statistical analysis of crack patterns
The visual observations showed the differences in terms of crack spacing between two different regions at each concentration of LC droplets ( $\emptyset $). However, the visual observations may not be able to distinguish the data fluctuations borne out due to the experimental conditions or quantify the trend of
 $\bar{x}_{\rm c}$ with increasing
 $\emptyset $. We observed that the aggregated data in different regions at each
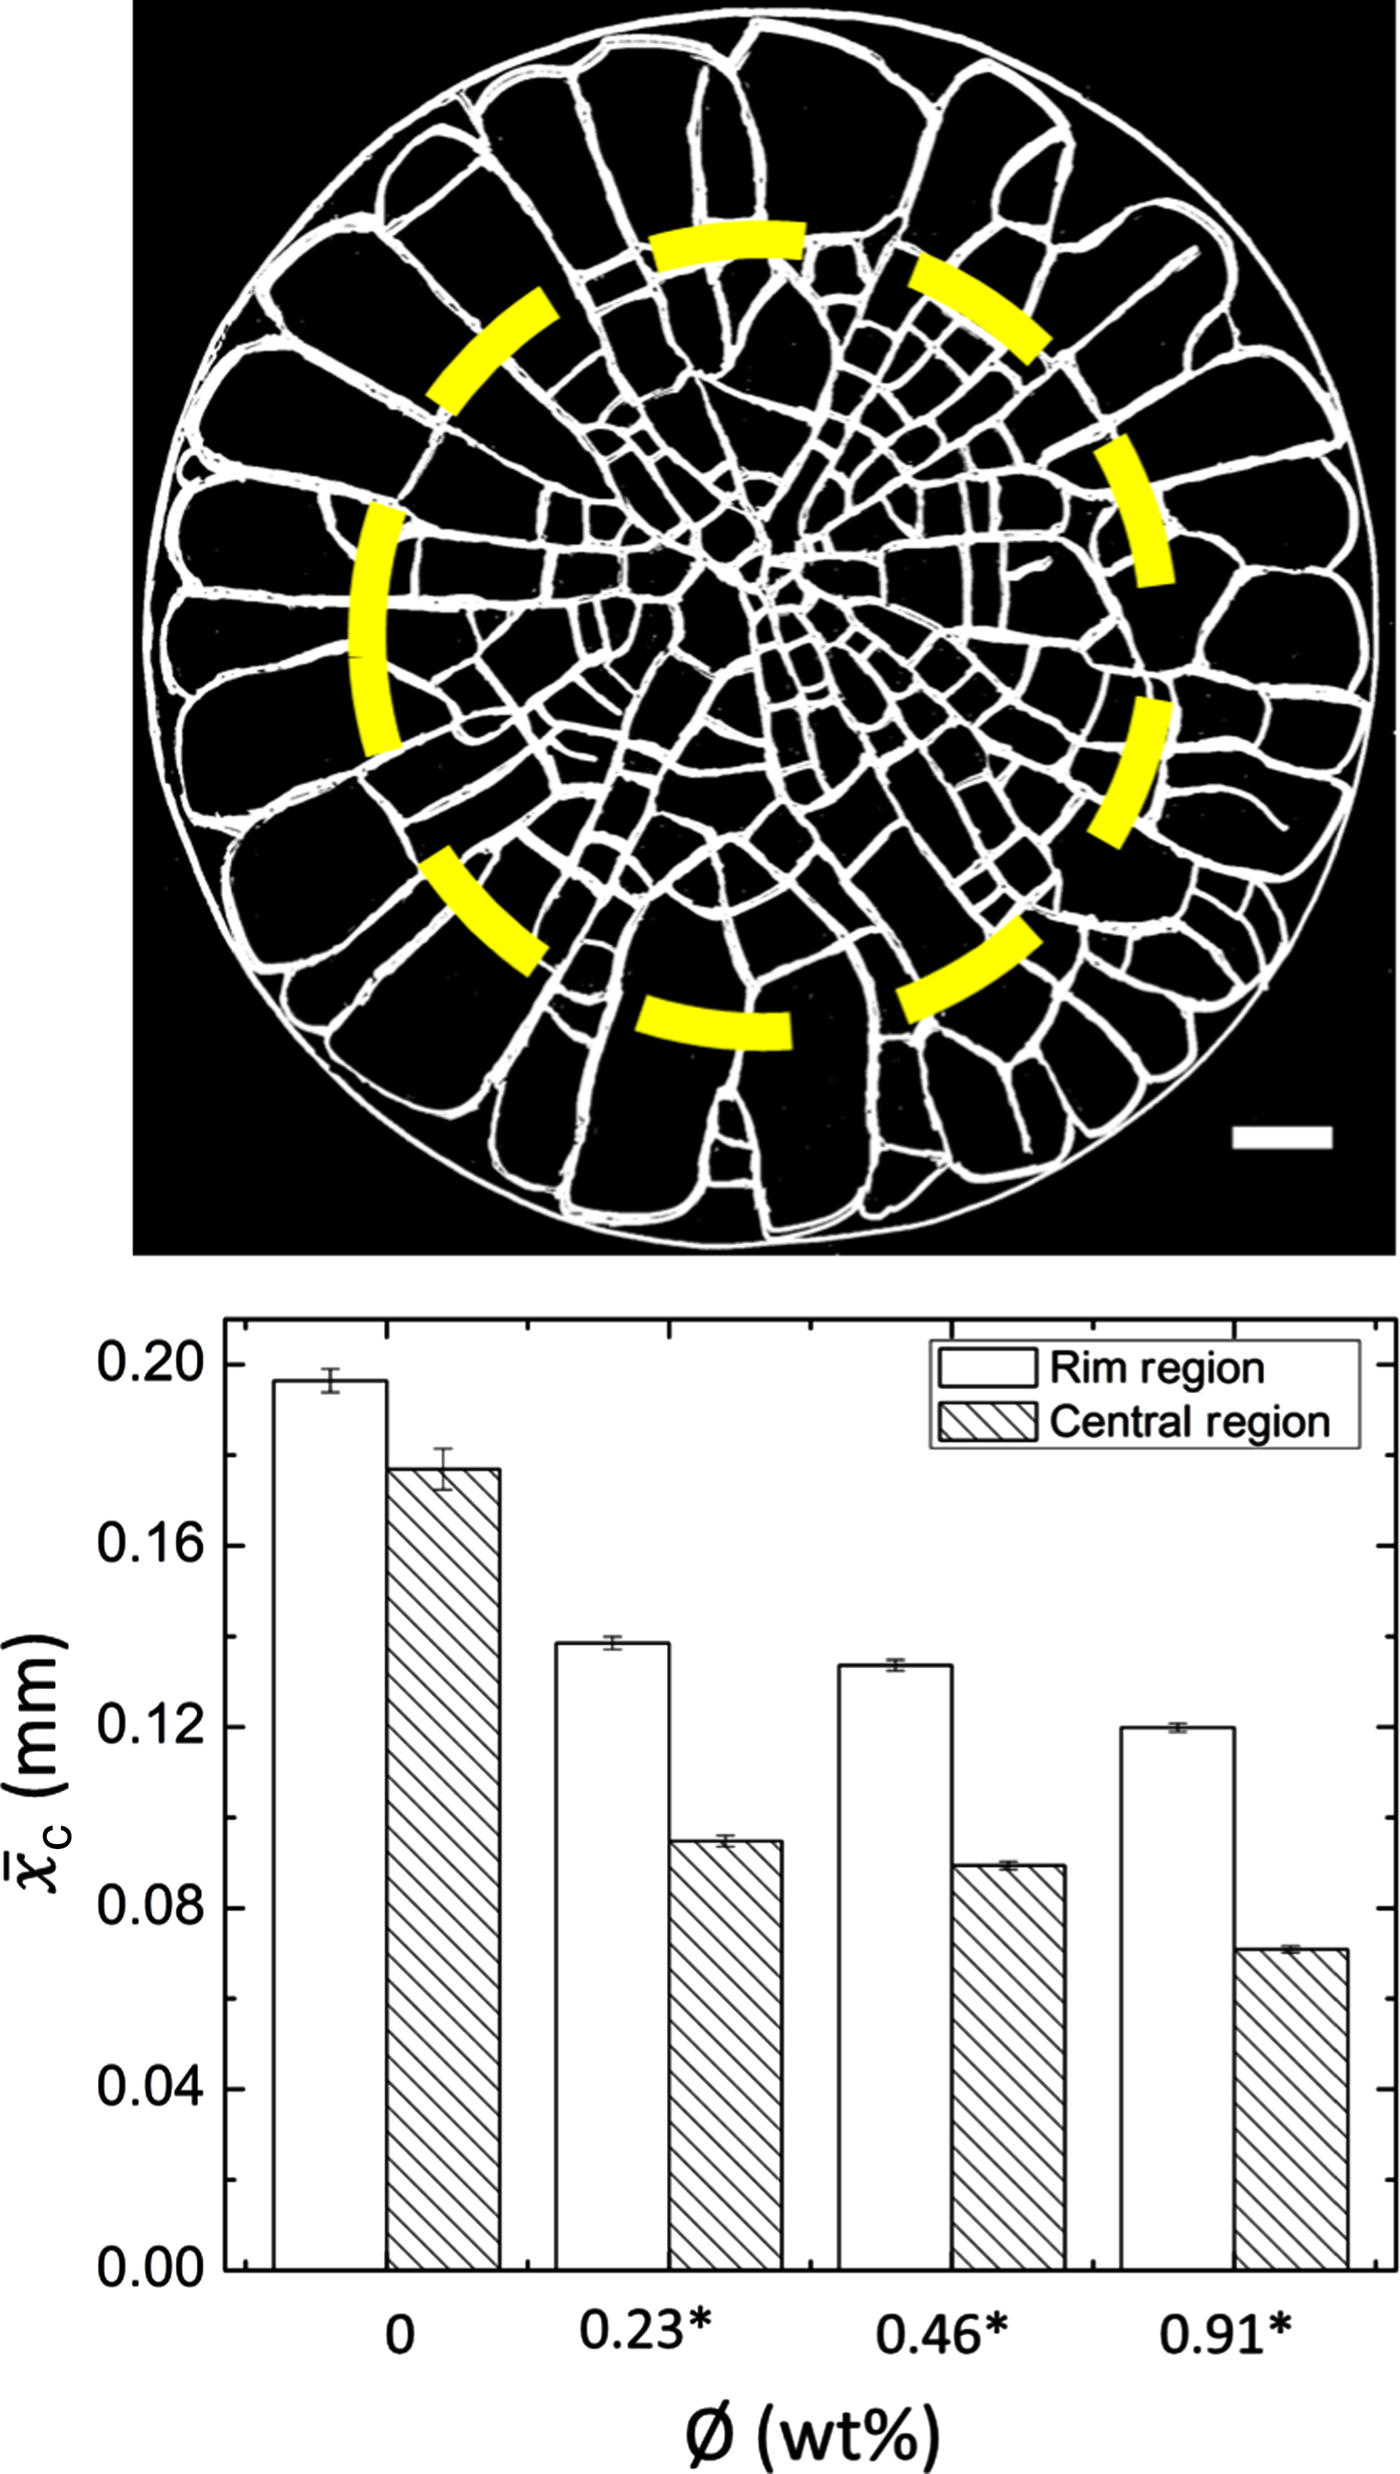
 $\emptyset $ was not normally distributed (positively skewed). Therefore, we conducted a non-parametric Mann–Whitney U test using SPSS (version 22.0). The difference is said to be statistically significant if P ≤ 0.05. The “region” was kept as the categorical factor (independent factor, with two levels: rim and central) and “x c” as the dependent variable. The yellow dashed line in the binary image depicts an example separating the drop into rim and central regions (top panel of Fig. 4). The comparison of
 $\bar{x}_{\rm c}$ between the regions at different
 $\emptyset $ is shown in the bottom panel of Fig. 4. The statistical test quantified the morphologic observations that
 $\bar{x}_{\rm c}$ in two regions were almost identical in the absence of LC droplets, but their presence made two regions significantly different.
 $\bar{x}_{\rm c}$ was not found to be significantly different, i.e., ~0.20 mm in the rim and ~0.18 mm in central regions at
 $\emptyset $ of 0 wt%. It significantly decreased from ~0.20 to ~0.12 mm in the rim and to ~0.07 mm in the central region as
 $\emptyset $ increased in the presence of LC droplets. The central region was found to contain small domains, resulting in a smaller value in
 $\bar{x}_{\rm c}$ when compared with that of the rim in the presence of LC droplets. The absence of LC droplets enabled the stress to act from all the directions resulting in similar cracks in both the regions. The “mound”-like structure further facilitated the crack to propagate from all the directions. The presence of LC droplets produced the uniform and radial cracks in the rim (big domains) resulting in larger
 $\bar{x}_{\rm c}$ values. Many radial and orthoradial cracks were observed leading to small domains in the central region of the drop. These were possibly due to the presence of the thin sheet of the protein film in the central region resulting in smaller
 $\bar{x}_{\rm c}$ values. The presence of LC droplets and their partial phase-separation facilitated the uniform crack formation in the rim region (the reason is explained in detail in the previous section). Moreover,
 $\bar{x}_c$ was decreased with the increase of
 $\emptyset $ in both the regions. It was because the number of LC droplets increased with the increase of
 $\emptyset $, resulting in more stress, more cracks, and subsequently resulted in a decrease in the mean crack spacing,
 $\bar{x}_{\rm c}$. The results of the statistical test were found to be consistent with the visual observations and the differences in
 $\bar{x}_{\rm c}$ between the regions of a drop were derived by varying the concentration of LC droplets.
Top panel: An example of a binary image of a dried drop at ∅ of 0.23 wt%. The scale bar corresponds to 0.15 mm. The yellow dashed line separates the drop into rim and central regions. Bottom panel: The histogram depicting the comparison of mean crack spacing between the regions at different ∅. Significant pairs are marked with an asterisk [*]. The error bars correspond to standard error.

Conclusions
This paper showed the evolution of the unique patterns of the self-assembling lysozyme in which each domain showed a central dark region surrounded by bright regions. The bright regions were randomly oriented LC droplets present underneath the lysozyme sheet. The major finding of this study is that, these patterns evolved through phase separation of bulk LC and self-assembly of protein (lysozyme) induced by evaporation of the solvent (de-ionized water) only. The presence of LC droplets did not affect the width of the rim (a “coffee-ring” effect)[Reference Deegan30] in the drop. The intensity study during the drying process revealed three regimes: a slow increase, a transition phase, and a saturation of the intensity in the presence of LC droplets, whereas no variation was observed when the LC droplets were absent. A simple exponential law was followed by FOS and GLCM analyses conducted on the final deposits. The crack spacing in the presence of LC droplets was statistically different in central (small but chaotic domains) and rim (large but highly ordered domains) regions, whereas no difference was found in the absence of LC droplets in the drop.
This work does not follow the conventional way of quantifying the LC textures, for example, birefringence study in the crossed polarizing configuration, and hence, provides a new way of extracting the information about the self-assembled structures. There are many important contributing factors affecting the drying process such as pH, contact angle, mass-loss, etc., and we intend to focus on those in our future work. A ternary phase diagram is required to understand the phase separation of LC droplets in the three-component mixture. The miscibility of these components is the key to determine how the inclusion of a small fraction of LC droplets into protein solution alters the crack patterns in the drying drops which is an interesting finding of this study.
Supplementary material
The supplementary material for this article can be found at https://doi.org/10.1557/mrc.2019.18.