
I. INTRODUCTION
Many mechanical components such as railway wheel sets and roller bearings of automobiles are cyclically loaded up to a very high number of loading cycles, even far beyond 10 million cycles. Moreover, during the last decades, it was shown for a number of metals that failure occurs even beyond the classical fatigue limit of 2 × 10⁶–107 cycles. Reference Murakami, Yokoyama and Nagata1–Reference Bathias, Drouillac and Le Francois3
At larger fatigue lives, the crack initiation phase gains importance and various reports in the literature suggest that localized cyclic plastic deformation on a microstructural scale and a subsequent crack initiation are the dominant life-controlling mechanisms. Reference Lukas and Kunz4 Depending on the material studied, localized plastic deformation can lead to surface as well as subsurface crack initiation. In this context, so-called dual or multistage fatigue life diagrams are being discussed. To distinguish between different damage mechanisms observed in the very high cycle fatigue (VHCF) range, Mughrabi Reference Mughrabi5 suggested the classification of metals in type I materials showing surface crack initiation, typically single phase ductile metals, and type II materials with inner defects such as inclusions, pores, etc. preferentially showing subsurface crack initiation.
Austenitic stainless steels are single phase materials in the annealed state and should be assigned to the category of type I materials regarding the VHCF behavior. In case of the metastable steel types, it is well-known that plastic deformation can lead to a deformation-induced transformation from the fcc austenite to the hexagonal closed-packed (hcp) ε martensite or body centred cubic (bcc) α′ martensite which enhances the strength of the material. It is commonly accepted that the tendency of austenitic steels to form deformation-induced martensite depends on its stacking fault energy (SFE) γSF. Low SFE promotes the formation of planar lattice defects, such as stacking faults, deformation twins, or ε martensite. Since these defects serve as nucleation sites for the formation of α′ martensite, there is a direct connection between the value of γSF and the tendency to form deformation-induced martensite. The SFE does not only influence the tendency toward phase transformation, but it also determines the slip character of dislocations from wavy- (high SFE) to more planar (low SFE)-type gliding, resulting in different dislocation arrangements and damage mechanisms.
Some reports about the VHCF behavior of austenitic stainless steels are available in the literature. Müller-Bollenhagen et al. Reference Müller-Bollenhagen, Zimmermann and Christ6 showed for an annealed metastable austenitic stainless steel that failure does not occur beyond 2 × 10⁶ cycles, provided the initial microstructure is fully austenitic. In case of stable austenitic stainless steels, Takahashi and Ogawa Reference Takahashi and Ogawa7 and Carstensen et al. Reference Carstensen, Mayer and Brondsted8 found fatigue failure beyond 107 and even 108 cycles. It should be mentioned that both steels were investigated under cold-worked conditions. However, these studies mainly concentrated on the phenomenological description of fatigue life and not so much on the investigation of the underlying microstructural damage evolution and its relation to the cyclic deformation and endurance limit.
The present work focuses on the questions, in which way and to which extent the stability of the austenite phase influences the dominant fatigue damage mechanisms. One of the major experimental approaches of this study is to monitor the characteristics of the resonant fatigue testing system, i.e., the resonant frequency, which can sensitively reflect even minor changes in the cyclic plastic deformation of the tested sample. The correlation of plastic strain amplitude and temperature with the resonant frequency of the ‘machine-specimen’ system was shown in Ref. Reference Müller-Bollenhagen, Zimmermann and Christ9. As a consequence, monitoring the resonant frequency during cyclic testing allows for gaining qualitative information about changes in the cyclic deformation behavior within a fatigue test. To determine the correlation between resonant behavior and damage evolution in detail, microstructural investigations were carried out at various stages of fatigue life. The results obtained were utilized for the identification of the relationship between the microstructural changes during cyclic loading in terms of dislocation arrangements and phase transformation and the cyclic deformation response of the investigated alloys in the VHCF regime.
Experimental studies represent the basic approach in the field of materials science. However, because of various measurement restrictions, experimental observations often cannot describe the deformation process to the last detail. Therefore, it is useful to supplement experimental investigations by modeling and simulation of the respective microstructural changes to achieve a more profound understanding of the fatigue damage. Atomistic simulations and discrete dislocation dynamics allow for a very precise description of the deformation of materials. Reference Needleman and Van der Giessen10,Reference Abraham, Walkup, Gao, Duchaineau, Diaz de la Rubia and Seager11 However, owing to the extensive demand of calculation capacity, these approaches are confined to very small volumes, and the simulation of the cyclic deformation is severely restricted. Therefore, in the present study, an alternative approach is used by representing the relevant microstructure of the material by applying a continuum mechanics approach, considering therein the relevant deformation mechanisms of austenitic stainless steels during cyclic loading. The cyclic plastic deformation in shear bands is represented by adopting and extending the model by Tanaka and Mura Reference Tanaka and Mura12 and the model by Lin et al., Reference Lin13 in which a shear band is modeled by two closely located layers and the irreversible accumulation of plastic sliding deformation is described (for a critical review of various models of early fatigue damage, reference is made to Ref. Reference Man, Obrtlík and Polák14). Inspired by the model of Bogers and Burgers Reference Bogers and Burgers15 and its extension by Olson and Cohen, Reference Olson and Cohen16 the martensitic transformation is modeled depending on the slide deformation in intersecting shear bands. 2-D microstructures consisting of several grains with elastic anisotropic properties are modeled and solved numerically by using the 2-D boundary element method (BEM). Simulation results are directly compared to the observed deformation evolution on real fatigue specimen surfaces and, in addition, a comparison is carried out on the basis of the resonant behavior of fatigue specimens and of modeled microstructures. The resonant behavior is characterized in simulations by means of the simulated hysteresis loops in combination with a damping model.
This paper is subdivided into two main parts. Firstly, the experimental investigations of the VHCF (and HCF) behavior of austenitic stainless steels considering experimental details and fatigue test results are presented. In the second part, modeling and simulation is dealt with by introducing the applied mesoscopic simulation model and describing simulation results of both investigated austenitic stainless steels. At the end, the findings from experiment and simulation are correlated and summarized.
II. EXPERIMENTAL STUDY
A. Experimental details
The materials investigated in this work are the austenitic stainless steels 304L (in wt% Ni 8.11, Cr 18.3, C 0.02, Si 0.43, Mn 1.43, Cu 0.14, Mo 0.038, and V 0.1, N 0.067) and 316L (in wt% Ni 12.99, Cr 17.5, C 0.04, Si 0.39, Mn 1.62, Cu 0.35, Mo 2.45, V 0.13, and N 0.053). The calculated SFEs Reference Schramm and Reed17 and Md30 temperatures Reference Nohara, Ono and Ohashi18 are 14.947 mJ/m2 and 2.8 °C for 304L and 67.757 mJ/m2 and −183 °C for 316L. The 316L steel was delivered as rods with a diameter of 20 mm, of which two different cylindrical sample geometries were machined for a resonance pulsating system and an ultrasonic fatigue system, respectively. In the case of the 304L steel, flat specimens with a thickness of 2 mm were tested by means of the resonance pulsating system. The materials were solution annealed without any additional mechanical processing. This treatment resulted in a microstructure with an average grain size of 30 µm and a relatively low dislocation density. The fatigue specimens were mechanically and subsequently electrochemically polished, resulting in a specimen surface free from preparation-induced surface effects. The stress-free condition of the surface grains was confirmed by X-ray and electron backscattered diffraction (EBSD) measurements in the surface layers.
Fatigue tests up to 109 cycles were carried out by means of an ultrasonic fatigue test system (BOKU, Vienna, Austria) working at a frequency of about 20 kHz. For the investigation of the transient behavior, samples were cycled in a fully reversed mode at constant values of the stress amplitude Δσ/2 up to 108 cycles by using a resonance pulsating high-frequency test system (Rumul Testronic, Russenberger Prüfmaschinen AG, Neuhausen am Rheinfall, Switzerland) operating at about 100 Hz. In this study, the resonant frequency of the system ‘machine-specimen’ is used to characterize the cyclic deformation behavior.
Quantitative analyses of the changes in the surface topography (slip band formation and growth) at various stages of fatigue life were performed by means of atomic force microscopy (AFM). For these measurements, the electrochemically prepared surface of some flat samples was additionally mechanically polished with diamond suspension followed by vibration polishing. Complementary observations of slip band morphology were carried out by cross-sectioning selected regions of the microstructure using a scanning electron microscope (SEM)/focused ion beam (FIB) system of type FEI Dual Beam Helios Nanolab (FEI Europe, Eindhoven, the Netherlands). This system was also used for the application of the electron channeling contrast imaging (ECCI) technique to visualize the dislocation arrangements in the surface grains. The local formation of α′-martensite was identified through EBSD technique, and the bulk volume fraction was measured by means of a magneto-inductive testing device (Fischer feritscope, Fischer Technology, Inc., Windsor, Connecticut).
B. Experimental results
1. Fatigue behavior of the 304L steel
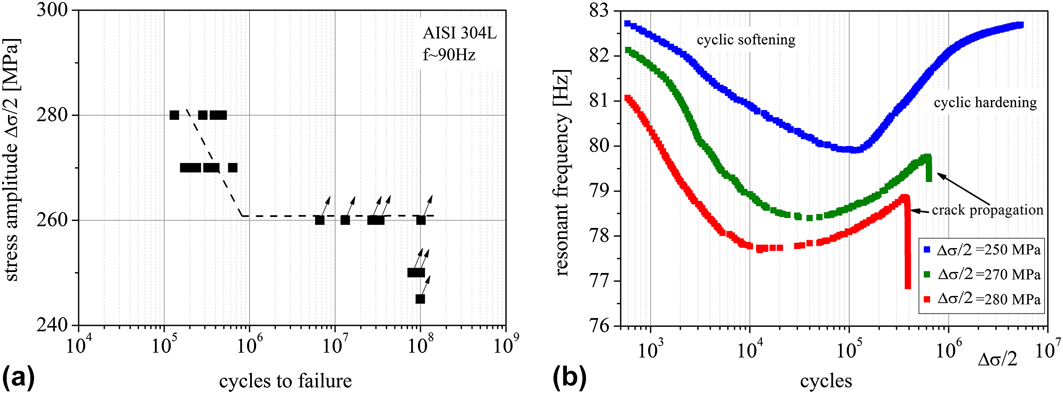
The metastable austenitic stainless steel 304L exhibits a true fatigue limit of 260 MPa [Fig. 1(a)]. No specimen failed beyond 106 cycles, even though remarkable surface roughening could be observed on the surface of run-out specimens.
(a) S–N curve for 304L tested at 90 Hz and (b) cyclic deformation behavior at different stress amplitudes represented by means of the change in resonant frequency.

The cyclic deformation behavior in the HCF and VHCF range was characterized on the basis of the resonant frequency, as described above. From a physical point of view, a decrease of resonant frequency corresponds to an increase of damping and thus results from cyclic softening, while an increase of resonant frequency corresponds to cyclic hardening. At all three stress amplitudes depicted in Fig. 1(b), the material exhibits a cyclic softening (decrease of f res) followed by cyclic hardening (increase of f res). By increasing the stress amplitude from 250 to 270 and 280 MPa, the curves move to lower values of f res. At the same time, the onset of cyclic hardening moves to lower numbers of cycles and indicates a dependency of the hardening process on the cumulated plastic strain during cyclic loading.
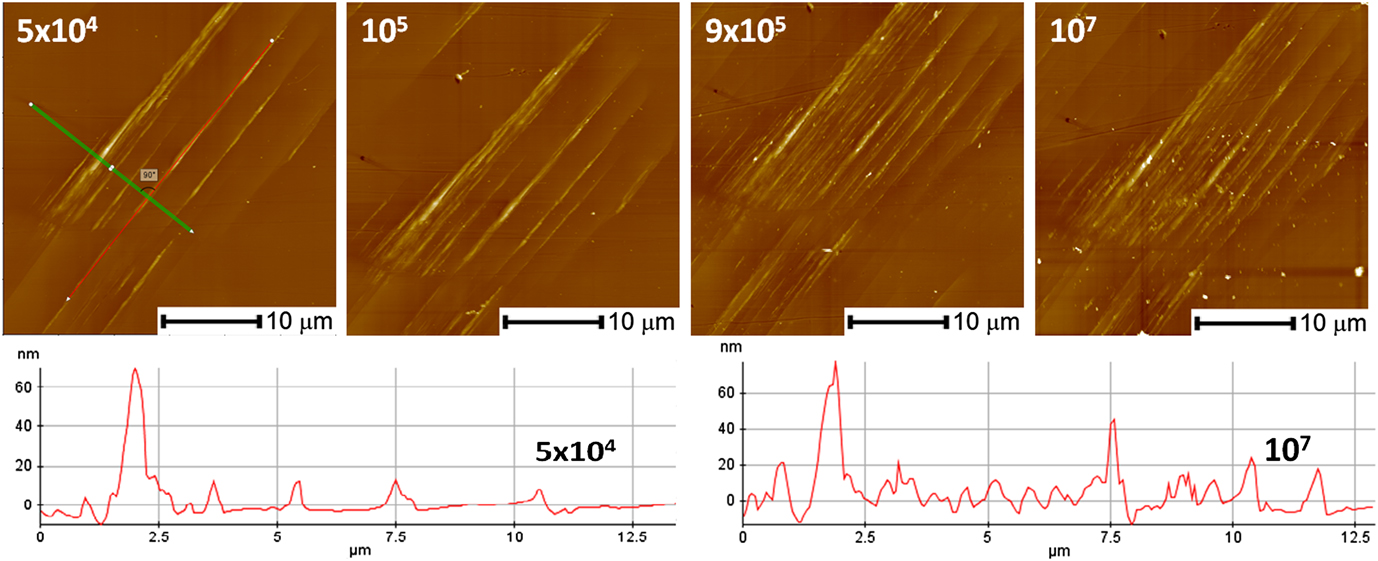
Microstructural characterizations were carried out to determine the microstructural changes that govern the cyclic deformation. Figure 2 reveals the formation of protrusions at a very low stress amplitude of 240 MPa in the softening phase followed by an increase in density of slip markings during the hardening phase. However, no significant intrusions were observed by AFM measurements. Additional observations made by confocal microscopy and FIB cross-sectioning confirmed the lack of pronounced intrusions in the surface grains.
Evolution of surface topography for 304L at 240 MPa (AFM micrograph and surface profile).

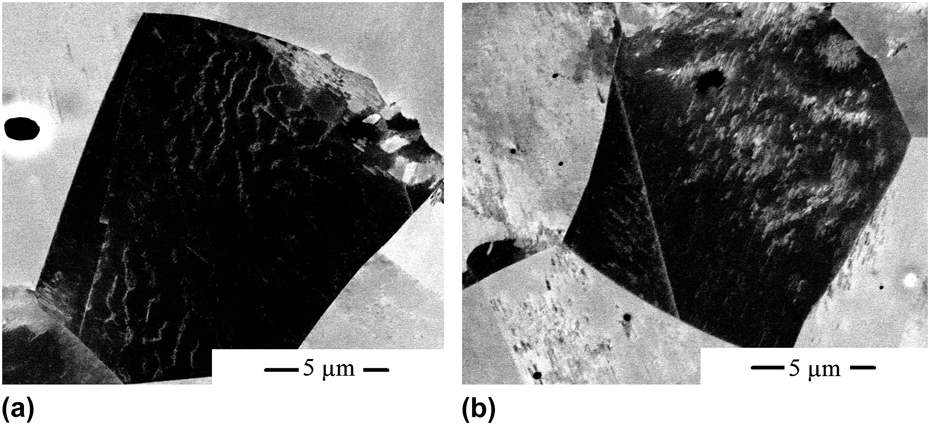
For a better understanding of the plastic deformation mechanisms in the VHCF regime, the evolution of dislocation arrangements and phase composition in some surface grains was investigated by means of ECCI technique. A fatigue test performed at 240 MPa was interrupted at 105 cycles (maximum softening), and a layer of less than 2 μm was removed by vibration polishing followed by electrolytic material removal. This method allows a perfect flat surface without additional artifacts induced by mechanical preparation, which is a mandatory requirement for ECCI measurements. After examination, the fatigue process was resumed and the specimen was tested up to 107 cycles. Subsequently, the sample was prepared using the procedure mentioned above and exactly the same grains were analyzed in the SEM. The results for one grain are presented in Fig. 3.
ECCI micrographs after 105 cycles (a) and after 107 cycles (b) for one surface grain from a sample tested at a stress amplitude of 240 MPa without failure.

The micrographs show the formation of wavy-type dislocation arrangements during the softening phase with low dislocation density regions in between, which can be explained by a high amplitude of the plastic strain, corresponding to a strong decrease of the resonant frequency at 105 cycles. During cyclic hardening, the microstructure changes and in the saturation stage the microstructure consists of a high number of narrow slip bands [Fig. 3(b)]. This is in reasonable agreement with the described changes in the morphology of the slip markings at the surface. These slip bands consist mainly of closely packed stacking faults. Martensite nuclei are formed at the intersection points and within the shear bands and impede the glide process. A more comprehensive description of the cyclic deformation mechanism of 304L in the VHCF range containing high resolution transmission electron microscopy (HRTEM) investigations and a detailed discussion can be found in Ref. Reference Grigorescu, Hilgendorff, Zimmermann, Fritzen and Christ19.
2. Fatigue behavior of the 316L steel
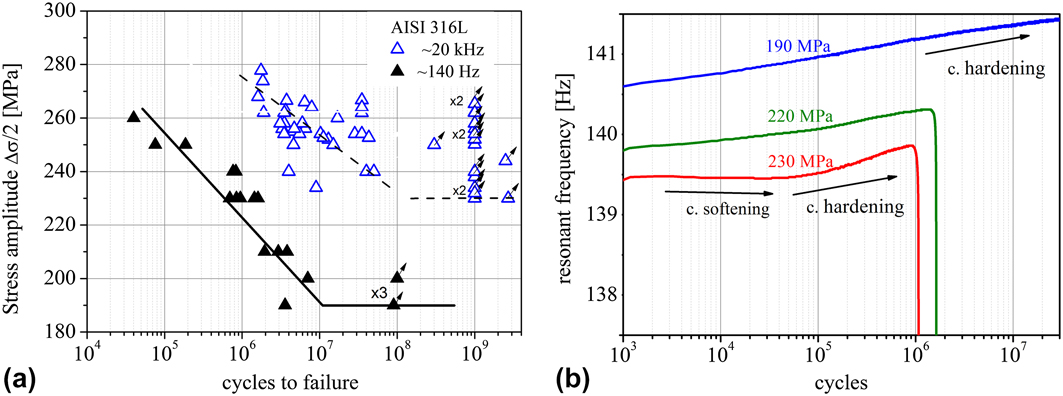
The results of fatigue tests carried out on the 316L steel under stress-controlled conditions are depicted in Fig. 4(a). This grade shows a decreasing fatigue strength (i.e., no true fatigue limit) in the VHCF regime with sample failure even above 107 cycles at testing frequency of about 20 kHz. It should be noted that the scatter of results from samples tested at 140 Hz with a larger critically loaded volume is significantly lower than the scatter of samples with a smaller volume tested at 20 kHz. In both cases, the S–N curves approach a horizontal asymptote with no failure occurring up to 109 cycles. While the material reaches a fatigue limit of 230 MPa during ultrasonic fatigue testing (at 20 kHz), the cyclic strength decreases by about 50 MPa when tested at 150 Hz. The frequency dependence of the fatigue life can be explained by the increase of Δεpl/2 at the lower frequency. Similar observations were made by Nikitin and Besel. Reference Nikitin and Besel20
(a) S–N curves for 316L at 140 Hz (black full symbols) and at 20 kHz (blue empty symbols) and (b) resonant frequency of specimens of 316L tested at different stress amplitudes.

The transient cyclic deformation behavior of the more stable austenitic stainless steel 316L in the HCF and VHCF regime is much less pronounced [Fig. 4(b)]. A measurable cyclic softening at the stress amplitude of 230 MPa followed by cyclic hardening can be observed. The reduction of the applied stress amplitude toward VHCF regime and fatigue limit (e.g., see curve for the stress amplitude of 190 MPa) results in a modification of the cyclic deformation behavior in the sense that cyclic hardening right from the beginning of the test dominates. A change in the trend of the natural frequency of fatigued samples from a decreasing to an increasing frequency beneath a critical stress amplitude was also observed by Straub. Reference Straub21
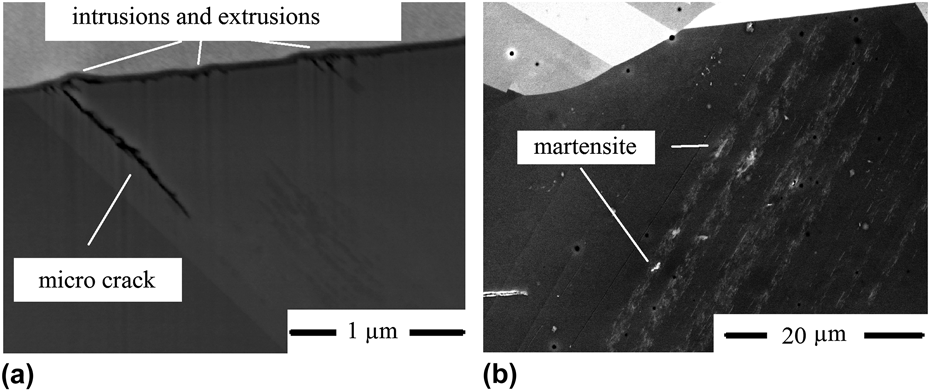
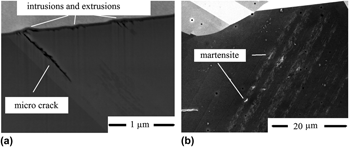
Investigation of the surface of run-out specimens (Δσ/2 = 240 MPa, N = 109 cycles, f = 20 kHz) revealed a strong localization of the cyclic plastic deformation in single isolated grains, which is in contrast to the earlier described findings for 304L. Figure 5(a) depicts an FIB cross-section in such a grain showing the formation of minor extrusions and deep intrusions followed by subsequent micro crack initiation. Similar cracks parallel to twin boundaries were observed in many samples; however, basically in all cases, these cracks were arrested within the first grain. It should be noted that this crack arrest could not be attributed to the barrier effect of grain boundaries. Rather, martensite formation within the slip bands was found to be the mechanism responsible for the arrest of the microcracks. Reference Grigorescu, Hilgendorff, Zimmermann, Fritzen and Christ19 An ECCI micrograph taken from a plastically deformed grain of a run-out sample is shown in Fig. 5(b). In comparison to 304L, the saturated microstructure is characterized by a planar dislocation arrangement with very few stacking faults. The martensite formation occurs within the slip bands, and the ECCI method did not provide evidence of a second active slip system involved in the phase transformation. More investigations using TEM technique should be carried out to explain the exact transformation mechanisms for these conditions.
(a) Surface topography showing extrusions, intrusions, and microcrack; (b) ECCI micrograph in a surface grain after 108 cycles.

The change in the deformation mechanism can be explained by a higher SFE of 316L. The higher tendency to wavy slip enhances the formation of wider slip bands without promoting the stacking fault formation between these bands as in the 304L steel. The developments of critical intrusions as well as martensite formation seem to be a consequence of this slip behavior.
In the following, the experimental results are used as basis for the model development and the corresponding numerical description of the relevant deformation mechanisms of austenitic stainless steels. By means of systematic parameter variations in the simulations, the previously presented assumptions drawn from the experiments shall be verified.
III. SIMULATION STUDY
A. Simulation model
A simulation model is proposed that considers the specific deformation mechanisms of austenitic stainless steels under VHCF loading conditions. As revealed by the experimental observations, both the cyclic plastic deformation in shear bands and the martensitic phase transformation must be represented in such a model.
The basic modeling strategy is to represent 2-D microstructures on the mesoscopic scale and consider relevant plastic deformation mechanisms within these microstructures during simulated cyclic loading. A microstructure is represented by modeling a number of grains by means of data taken from the EBSD analysis. The fatigue loading is applied by a quasi-static approach, in which the external loading is sampled and for each sample an elastostatic simulation with the help of a numerical method is carried out. During each sample, the mechanisms described in the following are incorporated into the simulation by iteratively adjusting the microstructure and its boundary conditions.
1. Shear band model
In the simulations, each shear band is directly represented by its slip marking in the 2-D surface plane. Shear band formation occurs once the simulated maximum resolved shear stress τMRSS in the most critical slip system within the microstructure exceeds a critical shear stress τc for shear band formation. Following the models of Tanaka and Mura Reference Tanaka and Mura12 and Lin et al., Reference Lin13 a shear band is approximated by two closely located parallel layers in the 2-D plane.
In alloys such as austenitic stainless steels, the so-called ‘short range order effect’ has to be taken into account. Reference Gerold and Karnthaler22 This effect is related to a local shear plane softening once an obstacle has been penetrated by dislocations in the same shear plane (for more details, see Ref. Reference Hilgendorff, Grigorescu, Zimmermann, Fritzen and Christ23). It is assumed that the 304L steel due to its more planar slip character (low SFE) and therefore its reduced tendency to easily bypass obstacles by spatial dislocation motion (e.g., cross slip) is subjected to the ‘short range order effect’, whereas 316L with its less planar slip character (higher SFE) is not. The mechanism of ‘short range order effect’ is transferred into the model by assuming that the critical resolved shear stress τc for shear band formation is higher than the flow stress τF once sliding in an already formed shear band occurs.
Plastic deformation in a shear band is directly represented by slide deformation within the layers in the relevant fcc slip system. Ideal plastic sliding occurs in a layer once the shear stress in the corresponding slip system exceeds the flow stress τF. In accordance with the models of Tanaka and Mura Reference Tanaka and Mura12 and Lin et al. Reference Lin13 during forward loading, the sliding is allowed to appear on one of the layers only and during reverse loading sliding is confined to the other layer. By doing so, an irreversible fraction p of the previous sliding can be considered on the layer which is inactive during the respective loading half cycle (for more details, see Ref. Reference Hilgendorff, Grigorescu, Zimmermann, Fritzen and Christ24). In addition, dislocation hardening is considered in the model by increasing the flow stress τF depending on the sliding deformation. The relation is defined in a cyclic hardening law, Reference Hilgendorff, Grigorescu, Zimmermann, Fritzen and Christ23 which depends among other parameters on a hardening parameter α that is determined in simulations.
The model parameters mentioned in this study were mostly referred to experimentally determined data or were estimated on the basis of semi-quantitative evaluations. For the metastable 304L steel, the parameters τc = 70 MPa, τF = 50 MPa, and p = 2 × 10⁻⁶ and for the stable 316L steel the parameters τc = τF = 110 MPa (without ‘short range order effect’) and p = 2 × 10⁻⁵ (higher because of the increased SFE) were chosen. The parameter p of 316L was estimated based on the evaluation of the surface roughening of fatigued specimens, and for 304L the value was chosen relatively smaller due to lower SFE. It is assumed that the shear band model incorporates the microstructural changes due to dislocations, stacking-faults, and ε martensite because they all presumably lead to a shear deformation along a shear band. The influence of twin or grain boundary shearing is not considered in the model.
2. Martensitic transformation model
The 304L steel undergoes a deformation-induced martensitic transformation (from γ to α′) in the VHCF regime. The ε martensite is not explicitly considered in the transformation model. The experimental results shown in Sec. II confirm that the deformation-induced α′ martensite is preferentially generated at the intersection of shear bands. In the following, the mechanisms of martensite nucleation and growth are assumed to obey the model of Bogers and Burgers Reference Bogers and Burgers15 and its enhancement by Olson and Cohen. Reference Olson and Cohen16 According to their model, a bcc structure can be generated from fcc structure by two specific shears acting at a shear band intersection. Reference Hilgendorff, Grigorescu, Zimmermann, Fritzen and Christ23 As a criterion for martensitic transformation, it is stated that martensite is emerging in the microstructure, once plastic shear deformation occurs simultaneously in two slip systems that are compatible according to the two Bogers and Burgers shears. One of the shear deformations is known from the previously described shear band model. Due to the restriction to single slip in the shear band model, the sliding value in the second slip system is calculated in a purely analytical computation based on the theory of continuously distributed dislocations (for more details, see Ref. Reference Hilgendorff, Grigorescu, Zimmermann, Fritzen and Christ23). With the knowledge of the sliding deformation in both relevant slip systems, the size of a generated martensite domain can be assessed.
Furthermore, an important aspect of the martensitic transformation is the volume expansion around a generated martensite phase. The shape deformation due to martensitic transformation is assessed by computing the deformation gradient tensor of both relevant Bogers and Burgers shears and deriving one corresponding transformation-induced strain εM (for more details, see Ref. Reference Hilgendorff, Grigorescu, Zimmermann, Fritzen and Christ25).
The numerical method adopted is the 2-D boundary element method which was applied to compute stresses and displacements within modeled 2-D microstructures taken from real fatigue samples. Details about the used boundary element method can be found in Ref. Reference Hilgendorff, Grigorescu, Zimmermann, Fritzen and Christ23. It should only be noted that by using the general plane stress condition in the modeled 2-D surface plane the plastic sliding deformation of shear bands could be simulated in the true spatial slip directions of each grain.
B. Simulation of cyclic plastic deformation of austenitic stainless steels
The combination of the boundary element method with the simulation model allows for simulating the cyclic deformation of austenitic stainless steels at low stress amplitudes within 2-D microstructures. In the following, simulations are carried out for both austenitic stainless steels (304L and 316L). The simulation results are shown in terms of the distribution of calculated maximum resolved shear stresses τMRSS in the mostly stressed slip systems of modeled microstructures and in terms of the resonant frequency ratio characterizing the resonant behavior.
1. Cyclic plastic deformation of the metastable austenitic stainless steel 304L
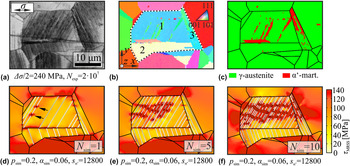
Figures 6(a)–6(c) show a SEM image, the corresponding EBSD map, and the phase map, respectively, representing an examined microstructure on the specimen surface of 304L steel (fully austenitic condition), which was fatigued for 2 × 10⁷ loading cycles below the VHCF strength of Δσ/2 = 240 MPa. Simulation of plastic deformation was only considered within the grains labeled 1, 2, and 3 in Fig. 6(b) (enclosed by the white dashed lines). This restriction intends not only to rule out boundary influences but also to reduce the computational effort. The microstructure was captured by means of the EBSD map and the modeling parameters of 304L were applied. Figures 6(d)–6(f) show the calculated shear stresses τMRSS in each case at the maximum external load (240 MPa) after the respective simulated loading cycles N sim. Modeled shear bands are emphasized by thin lines. The martensitic transformation is appreciable by distinctive shear stress peaks around the generated martensite nuclei [e.g., marked with black arrows in Fig. 6(d)].
(a) SEM image, (b) EBSD map, and (c) phase map of the examined real surface area of 304L steel (Δσ/2 = 240 MPa, number of cycles N exp = 2 × 10⁷); distributions of simulated shear stresses τMRSS at certain simulated loading cycles N sim (d–f) (304L, loading amplitude Δσ/2 = 240 MPa, cyclic slip irreversibility p sim, hardening parameter αsim, and martensite scaling parameter s α′). Reference Hilgendorff, Grigorescu, Zimmermann, Fritzen and Christ23

Below each illustration in Figs. 6(d)–6(f), the values for the cyclic slip irreversibility p sim, the hardening parameter αsim, and a parameter s α′ are given. The parameters p sim and αsim have the same physical meanings as the original parameters p and α from the shear band model (see Sec. III.A.1), but in the simulations these parameters were increased (and stored to p sim and αsim) to satisfy the true cyclic deformation of many experimental cycles within a significantly lower number of simulated cycles due to computational effort (for more details, see Ref. Reference Hilgendorff, Grigorescu, Zimmermann, Fritzen and Christ23). The parameter s α′ was used to scale the martensitic transformation in the simulation by multiplying the change of martensite domain size with this parameter. In supposing a linear relationship between cycles and irreversibility, the chosen cyclic slip irreversibility p sim = 0.2 for N sim = 10 would correspond to N exp = 106 experimental cycles with p = 2 × 10⁻⁶. Cycles beyond 107 cycles were not considered in simulations.
A comparison of the surface slip markings found in the SEM image [Fig. 6(a)] with the modeled shear band layers [Figs. 6(d)–6(f)] illustrates that shear band formation in designated slip systems was correctly reflected in the simulation model. Also, the sites of generated martensite domains in the simulation are in good agreement with the distribution of the martensite phase presented in Fig. 6(c).
The simulated plastic sliding deformation in the shear band layers led to a decrease of maximum shear stresses inside the relevant grains, while shear stress peaks arose at the grain boundaries where plastic sliding deformation was piled up. Around generated martensite nuclei, distinctive shear stress peaks appeared because of the transformation-induced volume expansion, but also due to the blocking of plastic sliding deformation at martensite domains. With increasing loading cycles, the number of modeled shear bands increased. This was due to the gradual and renewed increase of shear stresses around existing shear bands owing to the decrease of cyclic plastic sliding amplitudes in shear band layers. This decrease is a consequence of the individual cyclic hardening and cyclic slip irreversibility of each shear band and the ongoing blocking of shear bands by martensite domains. Reference Hilgendorff, Grigorescu, Zimmermann, Fritzen and Christ23
2. Cyclic plastic deformation of the stable austenitic stainless steel
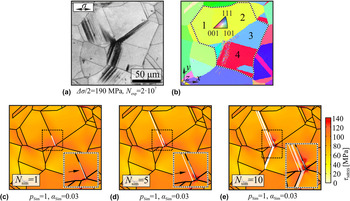
Figures 7(a) and 7(b) show the SEM image and the EBSD map, respectively, representing an examined real surface area of the stable austenitic stainless steel 316L fatigued at the VHCF strength of Δσ/2 = 190 MPa (reduced compared to 304L) up to 2 × 10⁷ loading cycles. Again, the microstructure was modeled based on the EBSD map and the modeling parameters of 316L were applied. The simulation of cyclic plastic deformation was confined to the grains labeled 1, 2, 3, and 4 as indicated in Fig. 7(b) (enclosed by the white dashed lines). Figures 7(c)–7(e) show the calculation results obtained for the simulated shear stresses τMRSS after selected cycles N sim at the maximum external load (here 190 MPa). As shown in Fig. 6, modeled shear bands are emphasized by thin lines. The martensitic transformation model was disabled due to the stable condition of AISI 316 L. The represented number of experimental cycles after 10 simulated cycles can be assessed to be N exp = 0.5 × 10⁶ by comparing the parameters of 304L and 316L.
(a) SEM image and (b) EBSD map of the examined real surface area of 316L steel (Δσ/2 = 190 MPa, number of cycles N exp = 2 × 10⁷); distributions of simulated shear stresses τMRSS at certain simulated loading cycles N sim (c–e) (316L, loading amplitude Δσ/2 = 190 MPa, cyclic slip irreversibility p sim, and hardening parameter αsim).

The simulation result shown in Fig. 7(c) indicates that after the first simulated loading cycle only one shear band next to the grain boundary between grain no. 1 and 2 was generated [see arrow in Fig. 7(c)]. It confirms the reduced tendency of the stable austenitic alloy to undergo plastic deformation in shear bands. This observation can be referred to the higher values for the critical resolved shear stress τc for shear band formation and flow stress τF, along with a smaller external loading (VHCF strength). Figures 7(d) and 7(e) indicate a further shear band formation with increasing simulated loading cycles. In this case, the strong accumulation of cyclic plastic deformation in shear bands led to a gradual increase of the shear stress peak at the grain boundary causing the generation of new shear bands. A comparison of the surface slip markings found in the SEM image [Fig. 7(a)] with the simulated shear band layers [Fig. 7(e)] illustrated that shear bands were formed in the correct slip systems.
The high shear stress peak evolving at the grain boundary in Figs. 7(d) and 7(e) indicates a critical site regarding crack initiation, thus leading to the experimentally identified microcracks in 316L (see Fig. 5). By contrast, the martensitic transformation in the metastable austenitic stainless steel 304L led to a stagnating increase of plastic deformation due to the blocking of shear bands by martensite domains. Thus, it seems reasonable to suppose that this barrier to plastic deformation provides an explanation for the higher VHCF strength of AISI 304 compared to AISI 316 L. In the following, a comparison based on the resonant behavior is carried out.
3. Influence of cyclic plastic deformation on the resonant behavior
In simulations, the force displacement hysteresis loops were used to determine the resonant frequency ratio ηres = f res/f 0 for each simulated cycle. This was done by applying a hysteretic and viscous damping model (for more details, see Ref. Reference Hilgendorff, Grigorescu, Zimmermann, Fritzen and Christ23). From experiment, the resonant frequency ratio ηres was also evaluated by using the monitored resonant frequencies f res divided by the additionally determined natural frequencies f 0 of the individual specimen.
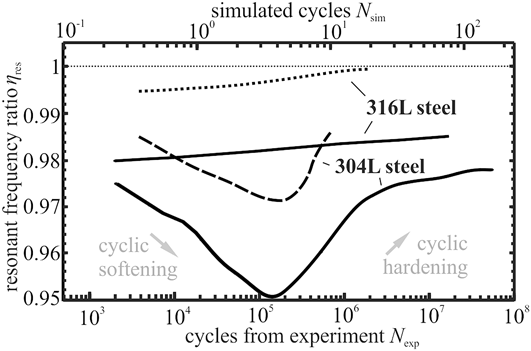
Figure 8 shows a qualitative comparison of resonant frequency ratio ηres from simulation and experiment. The simulated cycles N sim are shown at the top and the cycles from experiment N exp at the bottom. The solid black curves represent the results of ηres from experiment for the metastable and the stable austenitic stainless steel (304L and 316L). A decrease of ηres corresponds to cyclic softening and an increase to cyclic hardening. The results from simulations are indicated for 316L and 304L by a dotted and a dashed curve, respectively. The evaluated ratio ηres for the simulation of 316L (see Fig. 7) showed no appreciable change (ηres ≈ 1) owing to low simulated cyclic plastic deformation. Therefore, the value of the critical resolved shear stress was reduced from 110 to 90 MPa, leading to the calculated results for ηres depicted in Fig. 8.
Qualitative comparison of resonant frequency ratio ηres from simulations (dashed and dotted curves with scale of simulated cycles at the top) and experiment (solid curves for 304L and 316L with scale of cycles from experiment at the bottom). Reference Hilgendorff, Grigorescu, Zimmermann, Fritzen and Christ23

The dashed curve in Fig. 8 indicates that the simulation of cyclic plastic deformation of 304L at RT results in a cyclic softening (decrease of ηres) at the beginning and a subsequent cyclic hardening (increase of ηres), which is qualitatively consistent with the experimental results [also shown in Fig. 1(b) in terms of the resonant frequency]. The cyclic softening can be attributed to the continuous formation of new shear bands in combination with the ‘short range order effect’. Reference Hilgendorff, Grigorescu, Zimmermann, Fritzen and Christ23 Once shear bands are reaching a minimum critical distance, further formation is prevented in the simulation. Subsequently, the local cyclic hardening and irreversibility in each shear band and the blocking of shear bands by martensite domains lead to global cyclic hardening.
In case of the simulated stable austenitic stainless steel (but with reduced τc and τF), the dotted curve in Fig. 8 shows a constant increase of the ratio ηres and thus continuous cyclic hardening. This is in good agreement with the experimental results obtained for 316L. In particular, the reduced tendency to form shear bands and the absence of ‘short range order effect’ and martensitic phase transformation prevent cyclic softening and reduce cyclic hardening. The necessity to increase the tendency to form shear bands in the simulation to visualize the expected moderate cyclic hardening is referred to local plastic deformation in the matrix between shear bands which was not considered.
IV. CONCLUSIONS
The fatigue properties of austenitic Cr–Ni stainless steels at very low stress amplitudes were investigated by experimental examination supplemented by modeling and simulation. The results of fatigue tests performed using high frequency equipment (at about 100 Hz and 20 kHz) together with detailed microstructural investigations and resonant frequency analysis reveal the dominant fatigue damage mechanisms. It was shown that the stability of the austenite phase has a major influence on the fatigue failure mechanisms.
In simulation studies, 2-D morphologies of microstructures were represented and localization of plastic deformation in shear bands and deformation-induced martensitic phase transformation were considered by means of specific mechanisms. The resonant behavior was characterized by calculation of the resonant frequency ratio. Finally, assumptions drawn from experiments were supported and substantiated by simulation. The following conclusions can be drawn from the presented studies (E: resulting from experiment, S: resulting from modeling and simulation).
-
(1) The range of the number of cycles until failure in the S–N diagram increases for a higher stability of the austenite phase (E). That means no classical fatigue limit exists in 316L.
-
(2) The 304L steel, which possesses a high propensity to a deformation-induced phase transformation, exhibits a true fatigue limit without failure beyond 106 cycles (E).
-
(3) The more stable grade (316L) shows much less pronounced cyclic deformation (E + S), and fatigue failure still occurs in the range of 107 cycles. However, the material shows a true endurance limit (without failure) above 108 (E).
-
(4) Microcracks initiate at intrusions due to accumulation of microplasticity in the surface grains (E).
-
(5) The very locally formed α′-martensite acts as a barrier against plastic deformation (E + S) and microcrack growth. This mechanism is most likely responsible for the true endurance limit of 316L steel (E) at high cycle numbers.
-
(6) The cyclic plastic deformation of the 316L was found to be strongly dependent on the frequency. As a consequence, the fatigue strength at 20 kHz is higher than the strength at 140 Hz (E).
-
(7) The cyclic softening of 304L in the first stage of VHCF loading could be referred to the continuous formation of new shear bands (E + S) in combination with the ‘short range order effect’ being present because of the low SFE (S). Subsequent global cyclic hardening results from cyclic hardening in shear bands supported by the formation of α′-martensite (E + S).
-
(8) 316L steel undergoes a continuous and moderate cyclic hardening during VHCF (E) resulting from a reduced tendency to form shear bands (E + S), the absence of ‘short range order effect’ (S), and a reduced martensitic phase transformation (E + S).
ACKNOWLEDGMENT
The authors thank Deutsche Forschungsgemeinschaft for financial support of this study in the framework of the priority program “Life∞” (SPP 1466).