In psychopathology research, developmental behavioral genetic studies quantify relative contributions of heritable and environmental factors to phenotypic variation but tend to remain agnostic to underlying causal processes. The great majority of longitudinal twin studies show that heritable factors account for stability of phenotypes, such as traits, behaviors, and emotions, whereas environmental factors account for change (Bartels et al., Reference Bartels, van den Oord, Hudziak, Rietveld, van Beijsterveldt and Boomsma2004; Bartels, Rietveld, Van Baal, & Boomsma, Reference Bartels, Rietveld, Van Baal and Boomsma2002; Briley et al., Reference Briley, Livengood, Derringer, Tucker-Drob, Fraley and Roberts2019; Bronfenbrenner & Ceci, Reference Bronfenbrenner and Ceci1994; Eaves, Long & Health, Reference Eaves and Long1986). These studies are largely descriptive, and do not address causal processes that explain accrual of differences in phenotypic outcomes over time (for exceptions, see Dolan, De Kort, Van Beijsterveldt, Bartels, & Boomsma, Reference Dolan, De Kort, Van Beijsterveldt, Bartels and Boomsma2014; Neale & McArdle, Reference Neale and McArdle2000; van den Berg, Beem, & Boomsma, Reference van den Berg, Beem and Boomsma2006). One limitation of the often-used additive genetic models is that they rely on the assumption that genetic and environmental factors are uncorrelated (Polderman et al., Reference Polderman, Benyamin, De Leeuw, Sullivan, Van Bochoven, Visscher and Posthuma2015). As, in reality, genes and environments do correlate and interact with one another, developmental behavioral genetic models should incorporate this interdependence. While gene–environment interplay is accounted for in models that assume independence of unmeasured genetic and environmental components (e.g., Johnson, Reference Johnson2007; Neale & Cardon, Reference Neale and Cardon1992; Scarr & McCartney, Reference Scarr and McCartney1983), the covariance between latent genetic and environmental factors is seldom incorporated into developmental behavioral genetic models. Doing so would improve our ability to investigate the processes that contribute to variability in human complex traits.
The present study is not the first call to address this limitation. In Reference Anastasi1958, Anastasi commented, “as we proceed along the continuum of indirectness, the range of variation of possible outcomes of hereditary factors expands rapidly. At each step in the causal chain, there is fresh opportunity for interaction with other hereditary factors as well as with environmental factors” (Anastasi, Reference Anastasi1958, p. 199). The conventional assumption that genetic and environmental factors are uncorrelated breaks an important link in the causal chain of Anastasi's continuum of indirectness: how people interface with their environments. Individuals receive, select, and evoke responses from their environments in systematic ways. Known as gene–environment correlation (rGE), nonrandom exposure to environments based on genetically influenced characteristics is part of what it means to be a person embedded within continuously changing social environments (Eaves, Krystyna, Martin, & Jinks, Reference Eaves, Krystyna, Martin and Jinks1977; Plomin, DeFries, & Loehlin, Reference Plomin, DeFries and Loehlin1977; Scarr & McCartney, Reference Scarr and McCartney1983). This phenomenon arises from various processes (Plomin et al., Reference Plomin, DeFries and Loehlin1977). Passive rGE occurs when both genes and environments are provided to individuals (e.g., parents pass along genes for affective dysregulation and provide chaotic home environments). Active (or selective) rGE occurs when individuals nonrandomly select environments syntonic with their genetically influenced characteristics (e.g., persons with high risk of affective dysregulation select affectively dysregulated peers). Evocative rGE occurs when environments nonrandomly reinforce genetically influenced characteristics (e.g., persons with high risk of affective dysregulation elicit greater interpersonal conflict from their environments). Nonetheless, rGE is conventionally unaccounted for in developmental and, more generally, longitudinal twin studies. We note that longitudinal co-twin control studies, however, do adjust for rGE while examining how nonshared environmental factors contribute to development (McGue, Osler, & Christensen, Reference McGue, Osler and Christensen2010; Røysamb & Tambs, Reference Røysamb and Tambs2016). The current aim is to modify longitudinal twin models to incorporate rGE processes that represent real-time processes (Briley et al., Reference Briley, Livengood, Derringer, Tucker-Drob, Fraley and Roberts2019). By doing so, we improve our understanding of the role of rGE in accounting for various phenotypic processes over time.
Longitudinal twin models miss an important feature of the causal chain between genotype and environments: namely, persons. As argued by Scarr and McCartney, “some genotypes are more likely to receive and select certain environments than others” (Reference Scarr and McCartney1983, p. 426). Yet genotypes do not receive and select environments; people do (Turkheimer & Waldron, Reference Turkheimer and Waldron2000). Numerous intermediate and bidirectional processes connect genetic and environmental predispositions with complex traits (Cole, Reference Cole2009; Gottlieb, Reference Gottlieb2003). Intermediary pathways that connect genetic factors to environments include, among others, cognition, personality, and affect (Cole, Reference Cole2009; Gottlieb, Reference Gottlieb2003). In particular, genetic influences underlying affective dysregulation are mediated by processes “external” to individuals, such as changes in social environments, as well as by processes “internal” to individuals, such as hormones (e.g., cortisol) and other molecular processes (e.g., methylation activity affecting RNA transcription). Consequently, individuals are a critical node in the processes underlying rGE.
Reciprocal Effects Models
Among the processes that best exemplify Phenotype-Environment (P→E) associations is within-family diversification, or “sibling drift”. Several efforts have been made to study this phenomenon by incorporating rGE in longitudinal twin models (e.g., Beam & Turkheimer, Reference Beam and Turkheimer2013; de Kort, Dolan, & Boomsma, Reference de Kort, Dolan and Boomsma2012; Dolan et al., Reference Dolan, De Kort, Van Beijsterveldt, Bartels and Boomsma2014; Neale & Cardon, Reference Neale and Cardon1992). In particular, reciprocal effects models (REMs) have guided our thinking about change processes (Bell, Reference Bell1968; Scarr, Reference Scarr1992; Winship & Korenman, Reference Winship, Korenman, Mayer and Peterson1999; Beam & Turkheimer, Reference Beam, Turkheimer, Tolan and Leventhal2017). REMs summarize how small phenotypic advantages (e.g., calm demeanor) translate into superior abilities (e.g., affective stability). Individuals are initially provided with supportive environments (e.g., quiet vs. chaotic household), which in turn predispose them to seek out novel correlated environments (e.g., organized vs. disorganized peers). Further reinforcement of phenotypic advantages in these novel environments may then lead to the provision of additional support for affective stability (e.g., adults are more likely to mentor and model coping strategies). Over time, phenotypes become increasingly correlated with environments via iterative person–environment matching. To the extent that phenotypes are genetically influenced, genetic influences will themselves become increasingly correlated with environments with time.
In previous work, Dickens and Flynn's (Reference Dickens and Flynn2001) version of REMs has been invoked to explain how fleeting exogenous environmental experiences could explain time-limited rank order differences in cognitive ability between genetically related individuals (Dickens, Turkheimer, & Beam, Reference Dickens, Turkheimer, Beam, Kendler, Jaffee and Romer2011). REMs subsequently were adapted to explain how P→E matching processes might cause genetically related individuals to drift apart over time (Beam & Turkheimer, Reference Beam and Turkheimer2013; Beam et al., Reference Beam, Turkheimer, Dickens and Davis2015, Reference Beam, Emery, Reynolds, Gatz, Turkheimer and Pedersen2016). Importantly, we showed that the degree of genetic relatedness between individuals influences the degree of similarity and difference between their environments, which then underlies how different individuals eventually become. In other words, the smaller the genetic relatedness between individuals, the greater they will drift apart over time.
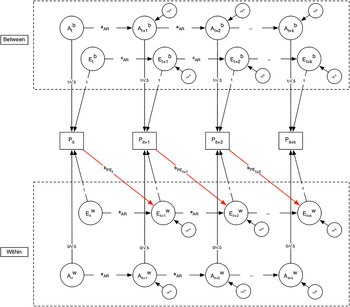
Figure 1 shows a multilevel REM, referred to here as the P→E model, in which total genetic effects are divided into genetic and environmental effects shared by twins in the same family (Ab and Eb, respectively) and genetic and environmental effects unshared by twins in the same family (Aw and Ew, respectively). At the within-level only, there is an autoregressive parameter (bPE) projecting from individuals’ phenotypic scores at time t (Pt) to individuals’ unshared (nonshared) environments at time t+1 (Et+1w). Although similar to a modified genetic simplex model, where genetic and environmental factors unidirectionally influence phenotypes across repeated measurements (Boomsma & Molenaar, Reference Boomsma and Molenaar1987; Eaves et al., Reference Eaves and Long1986), this autoregressive parameter represents the influence individuals have on their future environments. The autoregressive parameter generates within-family rGE, that is, person–specific correlations between genotype and environments. Adding this parameter produces different model expectations for monozygotic (MZ) twins and dizygotic (DZ) twins. Moreover, it more accurately models how nongenetically identical siblings differentiate over time compared to MZ twins. According to path tracing rules (Boker & McArdle, Reference Boker and McArdle2014), the autoregressive parameter necessarily induces accumulation of rGE across time as well as correlations among nonshared environmental components (de Kort et al., Reference de Kort, Dolan and Boomsma2012; Eaves et al., Reference Eaves, Krystyna, Martin and Jinks1977).
Phenotype–environment (P→E) model. Biometric components of phenotypic scores for Twin i at Time t, P it, are estimated between- and within-families; $A_t^b$ = between-family genetic effect at time t; $E_t^b$
 = between-family (common) environmental effect at time t; $A_t^w$
 = within-family genetic effect at time t; $E_t^w$
 = within-family (nonshared) environmental effect at time t; $uA_t^b$
 = unique between-family genetic effect at time t; $uE_t^b$
 = unique between-family environmental effect at time t; $uA_t^w$
 = unique within-family genetic effect at time t; $uE_t^w$
 = unique within-family environmental effect at time t; a ar, c ar, and e ar = autoregressive coefficient between adjacent components. The between-family and within-family genetic loadings for the monozygotic (MZ) twins are 1 and 0, respectively, to meet the assumption that MZ twins share 100% of their genes. The between-family and within-family genetic loadings for the dizygotic (DZ) twins are both √.5 to meet the assumption that and DZ twins share 50%, on average, of their segregating genes. The red line represents the P→E parameter, b PE, which was only estimated at the within-family level in the DZ group.

Traditional longitudinal twin models adhere to the assumption of independence between genetic and environmental factors. As a result, they generate upwardly biased genetic variance estimates (Beam & Turkheimer, Reference Beam and Turkheimer2013). In other words, such models might erroneously conclude that heritability increases when it does not (Purcell, Reference Purcell2002). At the same time, accumulation of unmodeled rGE in genetic variance components might lead to downwardly biased longitudinal correlations among nonshared environmental components. Traditional longitudinal twin studies tend to report uncorrelated structures of nonshared environmental factors over time, that is, age-specific influences on phenotypic outcomes (for examples, see Bartels et al., Reference Bartels, van den Oord, Hudziak, Rietveld, van Beijsterveldt and Boomsma2004 [developmental psychopathology]; Klump, Burt, Mcgue, & Iacono, Reference Klump, Burt, Mcgue and Iacono2007 [eating disorders]; Nivard et al., Reference Nivard, Dolan, Kendler, Kan, Willemsen, Van Beijsterveldt and Boomsma2015 [depressive symptomatology]; Petrill et al., Reference Petrill, Lipton, Hewitt, Plomin, Cherny, Corley and DeFries2004 [cognitive ability]). This is justified with the notion that, within families, there is no rank-order stability between twins over time, so that twins are re-sorted randomly as time passes. However, since individuals are nonrandomly exposed to environments due to genetic and environmental reasons (Plomin et al., Reference Plomin, DeFries and Loehlin1977; Scarr & McCartney, Reference Scarr and McCartney1983), this notion appears unrealistic. It is unlikely, for instance, that the more temperamental of two siblings would suddenly become the steadier sibling, without ongoing selection and reinforcement of environments that stabilize affect. As life plods along, environmental influences stabilize, suggesting that twins’ environments actually become canalized (Dickens et al., Reference Dickens, Turkheimer, Beam, Kendler, Jaffee and Romer2011). Given that genes and environments do correlate, P→E models might provide a more accurate representation of longitudinal processes. Accordingly, the P→E model depicted in Figure 1 accommodates violations of the independence assumption, thereby permitting rGE to accumulate over time.
As an example, affect is genetically and environmentally influenced (Montag et al., Reference Montag, Hahn, Reuter, Spinath, Davis and Panksepp2016), and this has implications for how individuals engage with their social environments. Two siblings – one more affectively labile than the other – are likely to select and evoke different environmental milieus. Compared to the less affectively labile sibling, the more labile sibling may be drawn to individuals who are more emotionally expressive and engage in more argumentative and baiting behaviors. As a result, this more affectively labile sibling may experience and contribute to a social environment characterized by more conflict, leading to still greater labile affect over time. However, while we have already demonstrated that small within-family phenotypic differences put genetically related siblings onto different cognitive (Beam et al., Reference Beam, Turkheimer, Dickens and Davis2015) and personality (Beam & Sharp, Reference Beam and Sharp2020) trajectories, no previous study has applied P→E models to affect.
One consequence of model estimated rGE is that the interpretation of nonshared environmental components changes (Beam, Turkheimer, Dickens, & Davis, Reference Beam, Turkheimer, Dickens and Davis2015; de Kort et al., Reference de Kort, Dolan and Boomsma2012). In P→E models, each nonshared environmental component consists of two components: a part that correlates with genotype (i.e., it differs due to genotypic differences) and a part that is uncorrelated with genotype (i.e., occasion-specific residuals). In the former, genetic factors indirectly influence nonshared environmental factors, by definition, and are therefore confounded with genotype. Comparisons of the longitudinal structure of nonshared environmental components between models that accommodate rGE and models that assume independence between genetic and environmental factors provide a straightforward empirical approach to determining whether accommodating rGE alters the meaning of the nonshared environment. In one previous report, we have shown that differences in nonshared environmental structures between models that accommodate rGE and models that do not are greater in DZ groups than MZ groups, suggesting that accommodation of rGE helps to explain why environmental factors might be more correlated over time (Beam et al., Reference Beam, Turkheimer, Dickens and Davis2015).
Quality of Environments and Measurement Density
Two conditions affect estimation of within-family rGE but have not yet been considered: the assumption that individuals have a wide range of environments available to them and the intervals of time between measurements (e.g., days vs. weeks vs. years). First, as posited by Fuller and Thompson (Reference Fuller and Thompson1960), enriched environments allow individuals to utilize environments freely, which support genetic expression of traits and allow individuals to adapt differently from one another (Bronfenbrenner & Ceci, Reference Bronfenbrenner and Ceci1994; Fischbein, Reference Fischbein1978). In contrast, restricted environments minimize behavioral options, leading individuals to behave more similarly, irrespective of genotypic differences. Therefore, siblings who are less genetically related (e.g., fraternal twins, full siblings, half-siblings, and so forth), and who have the resources to select from a range of environments, are expected to become less similar to each other over time. Instead, genetically identical individuals are more likely to select similar environments and, in turn, to become more similar over time. Statistically, this would imply that heritability increases over time, owing to the fact that within-pair MZ correlations are predicted to remain stable over time while non-MZ correlations are expected to decline. One implication of these expectations is that within-family rGE ought to increase over time, as genetically dissimilar sibling pairs develop. As within-family rGE can be tested statistically, these competing hypotheses can be evaluated directly.
Second, intervals of time between measurements can affect estimates of within-family rGE. As intervals of time between measurements increase, estimated autocorrelation between measurement occasions will decrease, as long as the process is stationary and noncyclic. Because longitudinal twin studies are laborious and expensive, dense measurement schedules of phenotypes are rare, and the temporal dynamics of rGE remain poorly understood. Shorter intervals between measurements, such as daily measurement schedules, could lead to greater estimates of the magnitude of the within-family rGE compared to longer intervals between measurements, such as annual measurement schedules. Developmentally, however, shorter divisions of time might not allow enough time for persons to receive, select, and evoke environments critical enough to make a difference for certain phenotypes, especially in view of evidence that effects of twins’ unique measured environments on behavior are small (Turkheimer & Waldron, Reference Turkheimer and Waldron2000). Thus, to best understand how environments guide change in genetically influenced characteristics, intervals of measurement should be suitably matched to expected change in phenotypes of interest.
The Current Study
In the present study, we explored the temporal dynamics of rGE using daily measurements of affect in a young all-female sample of twin pairs aged 16–25. Specifically, we investigated how nonrandom matching between these participants and their environments accounted for within-family differences in affect over 30 days. While some traits change slowly over a long period of time (e.g., personality, see Roberts & Mroczek, Reference Roberts and Mroczek2008), affect has been shown to fluctuate daily (Röcke, Li, & Smith, Reference Röcke, Li and Smith2009). As a result, genetic and environmental influences may, too, fluctuate. Therefore, the 30-day study window is a circumscribed period of time in which we can explore whether genetic and environmental influences underlying affect fluctuate. Using a P→E model, we tested two hypotheses: (a) heritability tends to be over-estimated for daily affect when rGE is unmodeled; and (b) within-family rGE will generate greater correlations among nonshared environmental factors over time. With respect to the latter hypothesis, we further expected environmental factors more proximally situated in time to be more correlated than environmental factors less proximally situated in time. Both hypotheses would suggest that the extent to which individuals engage with their environments on a daily basis, based on genotypically influenced characteristics, affects their nonrandom selection of environments, causing them to gravitate toward more like environments from day-to-day.
Of note, as the sample consists only of young women, changes across the menstrual cycle in the levels of two ovarian steroid hormones in the female body, estrogen and progesterone, may also account for differences in daily affect. Whereas estrogen is the predominant hormone produced in the first, proliferative half of the cycle (follicular phase), progesterone predominates in the secretory half of the cycle following ovulation (luteal phase), albeit estrogen also remains somewhat elevated (Poromaa & Gingnell, Reference Poromaa and Gingnell2014). This cyclical fluctuation in neuroendocrine levels has consequences including variation in affect (Farage, Neill, & MacLean, Reference Farage, Neill and MacLean2009; Romans, Clarkson, Einstein, Petrovic, & Stewart, Reference Romans, Clarkson, Einstein, Petrovic and Stewart2012). The luteal phase, for example, may engender a high-risk phase for increased negative and depressed affect as a result of higher progesterone levels (Bäckström et al., Reference Bäckström, Haage, Löfgren, Johansson, Strömberg, Nyberg and Bengtsson2011; Halbreich et al., Reference Halbreich, Freeman, Rapkin, Cohen, Grubb, Bergeron and Constantine2012). Although changes in affect across the menstrual cycle are not the primary focus of the current study, data collected over the menstrual cycle raise two pertinent issues. First, the cyclic nature of estrogen and progesterone implies that the correlation between individuals and environments is non-stationary and may vary in an oscillatory manner. Second, estrogen and progesterone direct genomic actions (e.g., gene transcription) and have been found to moderate genetic influences underlying behavioral phenotypes, such as binge eating, independent of genetic influences underlying ovarian hormones (Klump et al., Reference Klump, Hildebrandt, O’Connor, Keel, Neale, Sisk and Burt2015). Estrogen and progesterone, thus, may interact with genotype causing heritability to fluctuate, possibly in addition to effects of rGE via hypothesized person–environment matching. Therefore, to the extent that ovarian hormones act upon genetic components that differ within twins, they constitute an additional “environmental” source of variance in the P→E system (Purcell, Reference Purcell2002), as our model cannot distinguish between endogenous and exogenous environmental factors that vary within twins.
Method
Participants
Participants were 441 individual same-sex female twins (age range 16–25 years) who participated in the Twin Study of Hormones and Behavior across the Menstrual Cycle (HBMC) project (Klump et al., Reference Klump, Keel, Racine, Burt, Neale, Sisk and Hu2013, Reference Klump, Racine, Hildebrandt, Burt, Neale, Sisk and Keel2014) within the Michigan State University Twin Registry (MSUTR; Burt & Klump, Reference Burt and Klump2013; Klump & Burt, Reference Klump and Burt2006). There are 265 families in the current study, of which there were 176 (66.42%) complete pairs (MZ = 105, DZ = 71) and 89 (33.58%) incomplete pairs (MZ = 40, DZ = 49). Study inclusion/exclusion criteria were: (a) menarche before the age of 15; (b) regular menstrual cycles every 22–32 days for the past 6 months; (c) no hormonal contraceptive use within the past 3 months; (d) no psychotropic or steroid medications within the past 4 weeks; (e) no pregnancy or lactation within the past 6 months; and (f) no history of genetic or medical conditions known to influence hormone functioning or appetite/weight. Although twins could have provided up to 45 days of affect data, data coverage beyond 30 days was low. All twins thus provided at least 17 consecutive days of data and a maximum of 30 consecutive days. The mean number of days of data contributed was 27.31 (SD = 2.76). Approximately three-quarters of the sample (75.28%) had one complete cycle within the 30 days. MZ twins contributed 0.72 days more than DZ twins (t = 2.64, df = 439, p = .009). Sample demographics are provided in Supplementary Table S1. Twins, on average, were in late adolescence (M = 17.62, SD = 1.75) and born to college-educated parents (modal category was bachelor's degree for both twins’ mother and father) who combined make greater than $60,000 per year (59.80%). The ethnic composition of the sample was White (84.09%), African American (10.69%), Asian (0.24%), American Indian/Alaskan Native (0.48%), and mixed ethnicity (4.51%).
Procedures
All study measures and procedures were approved by the Michigan State University Institutional Review Board (IRB) and the University of Southern California IRB (UP-19-00623). Questionnaires were completed each evening (after 5:00 p.m.) using an online data system or pre-printed Scantron cards. Twins were instructed to submit their daily questionnaire responses online and to use Scantrons only in the event that they had issues with their computer or Internet connectivity. If twins used Scantrons, they were asked to bring them to the lab at their next in-person assessment so study staff could account for the daily data. There were 315 twins who completed their daily assessments on a Scantron card at least once during the study and 126 who completed all of their assessments online. Thus, 71.43% of the sample provided Positive and Negative Affect Schedule (PANAS) scores via Scantron at least once during the study. On days in which Scantrons were completed, negative affect scores were 0.81 units greater than on days in which ratings were submitted electronically (SE = 0.14, t = 5.62, p < .001). For positive affect, scores were 1.02 units greater on days in which Scantrons were used instead of electronic submission (SE = 0.19, t = 5.29, p < .001).
Measures
Positive and Negative Affect Schedule
The PANAS (Watson, Clark, & Tellegen, Reference Watson, Clark and Tellegen1988) was used to assess daily levels of positive and negative affect. The positive affect scale includes 10 items that assess a range of positive emotions (e.g., interested, excited, alert, inspired), while the negative affect scale consists of 10 items that assess a range of negative emotions (e.g., distress, nervousness, irritability, fear). The degree to which each emotion was experienced on each day of data collection was rated on a 5-point scale, ranging from 1 = very slightly/not at all to 5 = extremely. The positive and negative affect scales have exhibited excellent internal consistency. McDonald's omega ranged from .85 to .90 for the 10 positive affect items over the 30 days (M = .89) and .80 to .85 (M = .83) for the 10 negative affect items. For each day, the sums of the 10 positive and 10 negative affect items were used.
Time scale
Selecting a time metric common to all twins was restricted to aligning twins by a common day in the menstrual cycle. Twins’ PANAS scores were sorted so that all twins’ scores on Day 1 were the first day of the follicular phase (the day following the final day of bleeding in twins’ previous menstrual cycle). Menstrual cycle phase was coded using daily reports and daily hormone values from saliva samples. The first day of bleeding served as the graph anchor, and subsequent days were coded based on this anchor, as well as the overall length of each cycle (Klump et al., 2015).
Data analysis
We first estimated univariate MZ and DZ twin correlations of positive and negative affect and plotted heritability and environmental estimates based on these twin correlations across the 30 days. Conventional univariate twin modeling assumptions were made in estimating heritability and environmental estimates (Neale & Cardon, Reference Neale and Cardon1992). Additive genetic (A) components are the cumulative additive effect of genotype and are estimated by virtue of the fact that MZ twins share 100% of their genes and DZ twins share 50% of their genes, on average. Shared environmental (C) components are the cumulative effect of any environment that makes twins reared in the same family more similar to one another and estimated under the assumption that shared environmental influences affect twins similarly regardless of genetic relatedness. Nonshared environmental (E) components are any environmental factor that makes twins different from one another, including measurement error. Conventional twin models make further assumptions that A, C, and E components are uncorrelated with one another, that they do not interact with one another, and that genetic relatedness is the product of parents’ random mating strategies. To illustrate how the heritability of positive and negative affect fluctuates across days, we estimated the proportion of variability attributable to heritability (h 2), shared environments (c 2), and nonshared environments (e 2) for each of the 30 days.
Longitudinal structural models were then fit to the data using a multilevel structural equation modeling approach, which is equivalent to traditional structural equation modeling approaches (ML-SEM; McArdle & Prescott, Reference McArdle and Prescott2005). We structured the data so that days were wide formatted while twin pairs remained in long format and nested within each family. We estimated a genetic simplex model (baseline model) and compared this model to a P→E model (research model). In the genetic simplex model, twins’ affect scores on each day were decomposed into random variance components (subscript 1 for Twin 1 and subscript 2 for Twin 2):

The phenotypic scores, P, of Twin 1 and Twin 2 in family, f, at day, t, are decomposed into between-family and within-family genetic and environmental factors. All biometric variables (A and E), have a mean of zero so that the expectation of the phenotypic mean E[P]ft,i equals the intercept, b0t. At the between-family level, phenotypic scores are decomposed into a genetic factor (Ab) and an environmental factor (Eb) shared by both twins. At the within-family level, twins’ scores are decomposed into a genetic factor (Aw) and an environmental factor (Ew) unique to twins raised in the same family. The total genetic effect, A, for each twin is equal to:

The variances of the Ab and Aw factors are constrained to be equal. The weights, w, are fixed values that indicate the proportion of genetic information shared by each twin pair. In MZ pairs, wab equals 1 and waw equals 0 to satisfy the assumption that identical twins share all of their genes. In DZ pairs, wab equals 0.5 and waw equals 0.5 to satisfy the assumption that fraternal pairs of twins share only half of their segregating genes, on average; the other half varies between them. The weights of the genetic factors between- and within-families were scaled so that $w_{ab}^2 + w_{aw}^2 = 1$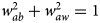 , with the expectation that Ab and Aw are uncorrelated, $E\lsqb {A_{ft}^b \comma \;A_{ft\comma i}^w } \rsqb = 0$
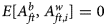 .
In order to present the P→E model, we begin by presenting the conventional genetic simplex model (Eaves et al., Reference Eaves and Long1986). Between- and within-family genetic and environmental factors are correlated via first-order autoregressions (t > 1) as follows:

The autoregressive coefficients (a ARt,t−1, c ARt,t−1 and e ARt,t−1) of the genetic and environmental variables and their corresponding disturbances $\lpar uA_{ft}^b \comma \;uE_{ft}^b \comma \;uA_{ft\comma i}^w \,{\rm and}\,uE_{ft\comma i}^w \rpar$ were freely estimated. The first-order autoregressive processes between the genetic and environmental factors meet the independence assumption in conventional twin models. Graphically, this model is identical to Figure 1 without the bolded red pathways projecting from the phenotypic scores to the nonshared environmental variables. Pre-analysis demonstrated that the longitudinal genetic and shared environmental structures could each be reduced to a single common factor; in all of our models the a ARt,t−1 and c ARt,t−1 were not estimated. Reduced models that included single common genetic and shared environmental latent variables fit the data better than the full genetic simplex model (positive affect: ΔLL = 85.10, df = 117, p = .988; negative affect: ΔLL = 85.10, df = 117, p > .999).
In the P→E model, the autoregressive correlations of the Ew components are re-specified as regressions of $E_{ft\comma i}^w$ at Day t > 1 on the phenotype at Day t−1:

The nonshared environmental variables, $E_{ft\comma i}^w$ , at Day t>1, are regressed on the phenotype at Day t−1. The autoregressive coefficients (b PEt,t−1) and disturbances $\lpar uE_{ft\comma i}^w \rpar$
 were freely estimated. By path tracing rules, in the DZ group the b PEt,t−1 parameters necessarily transmit effects of the within-family genetic factor $\lpar A_{ft-1\comma i}^w \ast b_{PEt\comma t-1}\rpar$
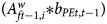 and the nonshared environmental factor $\lpar E_{ft-1\comma i}^w \ast b_{PEt\comma t-1}\rpar$
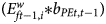 at Day t−1 via the phenotype at Day t−1. As there is no within-family genetic variation, Aw variables are fixed to zero in the MZ group, thus making b PEt,t−1 effects equal to the autoregressive effects of the nonshared environment, e ARt,t−1 in the MZ group. The baseline model, therefore, assumes that b PEt,t−1 effects are different in the MZ group than the DZ group, as the source variables for b PEt,t−1 effects include within-family genetic differences in the DZ twins but not the MZ twins. In the DZ group, significant b PEt,t−1 effects support the hypothesis that pair differences in affect on previous days systematically expose twins to unique environments on subsequent days, which causes unique environments to become correlated with genetic factors and unique environments on previous days. In the MZ group, significant b PEt,t−1 effects suggest that unique environments at Day t correlate with unique environments at t−1.
The baseline model was compared to a restricted model that constrains all b PEt,t−1 parameters to be equal between MZ and DZ twins. If the more restricted model fits equally as well as the baseline model, this means that b PEt,t−1 parameters cannot be distinguished from the e ARt,t−1. Under this more parsimonious model, the null hypothesis is that environmental effects over time are equivalent to person–environment effects over time.
The P→E parameter, b PEt,t−1, has three consequences in the DZ group. First, it necessarily induces accumulating within-family rGE over days. Second, b PEt,t−1 parameters change the meaning of the nonshared environmental effects when t > 1 because the parameters give rise to the correlations between $E_{ft\comma i}^w$ and $A_{ft-1\comma i}^w$
 (Dolan et al., Reference Dolan, De Kort, Van Beijsterveldt, Bartels and Boomsma2014). Third, b PEt,t−1 parameters increase the stability of nonshared environment over days as twins are matched to temporally similar environments.
Since bPE parameters necessarily change the meaning of the nonshared environment at all days but the first day via indirect correlations between genetic and environmental components (Beam et al., Reference Beam, Turkheimer, Dickens and Davis2015), we empirically test the longitudinal structure of the nonshared environment by statistically comparing model implied nonshared environmental variances and covariances in the DZ group against the MZ group.
Models were fit in Mplus 8.2 (Muthén & Muthén, Reference Muthén and Muthén1998–2017) using full information maximum likelihood (FIML) estimation with robust standard errors to handle missing data, violations of multivariate normality, and modest sample sizes. Missing data analysis consisted of comparing participants who did not provide affect scores for all 30 days to participants who did on the following measures: first day of affect scores provided, Day 15 of affect scores, final day of affect scores provided, age, body mass index, highest education achieved, parental income, and ethnicity. No significant group differences were observed, which lends support for retaining the assumption that the missing data mechanism was missing completely at random (Enders, Reference Enders2010). Model comparisons were made with the Satorra–Bentler scaled chi-square difference test of nested models (S-Bχ2), which corrects the chi-square distributed test statistic in cases of multivariate normality assumption violations (Satorra & Bentler, Reference Satorra and Bentler2001). Model fit also was evaluated using the Akaike information criterion (AIC) and the Bayesian information criterion (BIC) (Burnham & Anderson, Reference Burnham and Anderson2004). We also employed the sample size adjusted Bayesian information criterion (SSABIC), which adjusts the sample size penalty of the BIC to provide better model fit performance than the BIC when sample sizes are small or there are a large number of parameters (Enders & Tofighi, Reference Enders and Tofighi2007; Sclove, Reference Sclove1987). Models with lower AIC, BIC, and SSABIC values indicate better model fit, because these indices take into account the trade-off between model parsimony and model complexity.
Results
The means and standard deviations of positive and negative affect across the 30 days were stable, with greater variance in positive affect (range: 21.95–24.75) than negative affect (range: 14.55–15.56).
Figure 2 presents the twin correlations for positive affect and negative affect on each day with locally estimated scatterplot smoothing (LOESS) lines overlaid to illustrate trends in twin similarity over days. Beginning at Day 1, MZ and DZ twin correlations for positive affect (top panel) gradually diverge until about Day 10, remain constant from Day 11 through Day 18, diverge again from Day 18 through about Day 28, and then converge the final two days. For negative affect (bottom panel), twin correlations generally converge from Day 1 through Day 11, then diverge until about Day 28, after which the correlations tend to converge with DZ twins more similar than MZ twins in the final days. Within-pair differences in person–environment match, the basis for generating within-family rGE, are expected to account for divergence of MZ and DZ twin correlations.
Daily twin correlations of positive and negative affect scores. LOESS lines (in blue) are overlaid to illustrate general trends in twin similarity for each phenotype. On average, differences between monozygotic (MZ) and dizygotic (DZ) twin correlations are statistically significant across the 30 days (positive affect: t = 6.10, df = 58, p < .001; negative affect: t = 4.04, df = 58, p < .001).

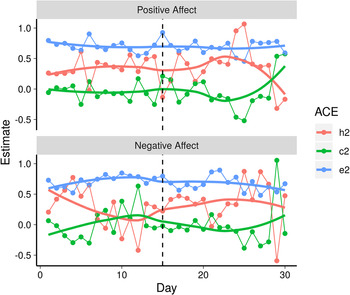
The above twin correlations were used to estimate the daily heritability and environment estimates (Figure 3). Both MZ and DZ correlations demonstrated variability in twin similarity in positive affect scores over the 30 days. Heritability estimates (red lines) tended to increase slightly until about Day 14, were variable from Day 15 through Day 19, increased dramatically from Day 19 through Day 25, and then declined. Shared environmental estimates were generally around zero (or negative), although on days where heritability declined, shared environmental estimates tended to increase above zero (e.g., Days 6, 14, 29, and 30). Nonshared environmental estimates over days were stable.
Heritability and environment estimates of positive affect (top panel) and negative affect (bottom panel) by day. h 2 = heritability, which is the proportion of total variance in daily affect scores attributed to genetic variance; c 2 = shared environment, which is the proportion of total variance in daily affect scores attributed to shared environmental variance; e 2 = nonshared environment, which is the proportion of total variance in daily affect scores attributed to nonshared (unique) environmental variance. All estimates are based on classical univariate ACE models (genetic [A], shared environmental [C], and nonshared environmental [E]).

Twin correlations for negative affect also tended to vary across days, suggesting variability in genetic and environmental estimates. Heritability estimates generally declined from Day 1 through Day 12, increased through Day 25, and then slightly declined. Shared environmental estimates tended to increase across days where heritability declined and decreased on days when heritability increased. Nonshared environmental estimates slightly increased for the first 15 days and slightly declined for the last 15 days. As increases in heritability suggest that DZ twin similarity diverges from MZ twin similarity, we next tested whether rGE accounts for daily fluctuations in heritability, particularly across days where heritability of positive and negative affect increases.
Person→environment model results
Model fitting results (Table 1) indicate that the P→E model provided better fit to the data than a model that equates P→E and nonshared environmental parameters for both positive affect (likelihood ratio test (LRT) = 86.61, df = 29, p < .001) and negative affect (LRT = 53.49, df = 29, p < .005). Further, AIC and SSABIC values were lower for models that distinguish P→E parameters than models that do not, further indicating better fit to the data. Person–environment matching parameters (bPE), thus, significantly improved model fit for both positive affect and negative affect. Results did not change when ethnicity and age were included in the models.
Model fitting results

Notes. Model 1 is the P→E model, which is the less restricted model that distinguishes between person–environment match via bPE parameters and nonshared environmental effects over days. Model 2 restricts bPE effects to be equal to nonshared environmental effects. LL = log likelihood value; ΔLL = likelihood ratio value; Δdf = differences in in degrees of freedom between models 1 and 2; AIC = Akaike information criterion; BIC = Bayesian information criterion; SSABIC = sample size adjusted Bayesian information criterion. P→E models fit better than ACE (genetic [A], shared environmental [C], and nonshared environmental [E]) Cholesky decomposition models. ACE Cholesky decomposition model fit for positive affect was: LL = −7,884.16 (df = 505), AIC = 18,618.33, BIC = 24,445.22, SSABIC = 19,922.94. For negative affect, model fit was: LL = −4,671.80 (df = 505), AIC = 12,193.61, BIC = 18,020.49, SSABIC = 13,498.22.
Figure 4 presents the line plots of model estimated within-family rGE for positive affect and negative affect from the P→E models. Within-family rGE was small and tended to fluctuate from Day 1 through Day 15. From Day 15 through Day 25, rGE increased but began to decline again from Day 26 through Day 30.
Model estimated within-family rGE over 30 days for positive affect (PA) and negative affect (NA). rGE was re-estimated in P→E models where days were randomly ordered within twins to illustrate that rGE systematically changes across the 30 days.

In order to evaluate whether rGE fluctuated systematically as a function of daily effects of affect scores on subsequent environmental exposure, we randomly ordered days within each twin and fit the P→E model. This analysis, known as surrogate data generation or “time scrambling” (Moulder, Boker, Ramseyer, & Tschacher, Reference Moulder, Boker, Ramseyer and Tschacher2018), tests dependency between time series and is important for showing that the model-generated rGE depends on the temporal ordering of P→E effects. Thus, the expectation is that rGE would be essentially zero across the 30 days when days were randomly ordered within twin. Within-family rGE did not vary significantly from zero when days were randomly ordered within twins (lines labeled "PA Random Days" and "NA Random Days", respectively).
The P→E parameters affected heritability of daily affect scores attributed to genetic effects alone, that is, estimates excluding rGE generated via bPE paths (Figure 5). Heritability estimates under the independence assumption (blue lines) for positive affect and for negative affect are compared to heritability estimates under accommodation of rGE (red lines). For both positive and negative affect, estimating P→E effects in the DZ group reduced heritability estimates by approximately 3% across days, on average, with reductions as great as 7–8%. Heritability estimates, thus, were attenuated when rGE was included in the model.
Heritability estimates of positive affect (top) and negative affect (bottom) from phenotype–environment (P→E) model (red) and genetic simplex model (blue) across the 30 days.

Finally, P→E effects that accommodate rGE also affected the longitudinal correlations between nonshared environmental components across the 30 days. Figure 6 presents the nonshared environmental correlations in the MZ group (left column) and the DZ group (right column) for positive affect (top row) and negative affect (bottom row). As a reminder, longitudinal correlations between nonshared environmental components in the MZ group do not include rGE (because there are no within-family genetic effects) whereas in the DZ group rGE is accommodated. In the MZ group, longitudinal nonshared environmental correlations persist up to 5 days, declining from a moderate correlation of .40–.50 between adjacent days (e.g., Day 1 and Day 2) to essentially zero 5 days later (e.g., between Day 1 and Day 6). Nonshared environmental correlations decayed more rapidly when accommodating rGE by about 1–1.5 days earlier, but are systematically correlated across days, although the correlations are small. Differences in longitudinal correlations estimated with and without accommodation of rGE are similar, suggesting that the interpretation of nonshared environmental components may have been affected minimally by allowing genetic and environmental components to correlate. Differences in lag-1 correlations were the largest (r range: .00–.20) while correlations among components with greater lags never exceeded .10.
Longitudinal correlations among nonshared environmental correlations across 30 days for positive affect (PA) and negative affect (NA). Model estimated MZ and DZ correlations are taken from phenotype–environment (P→E) models.

Post-hoc power analysis
Given the small total sample size (N Families = 265), we estimated power to detect significant P→E parameters, b PEt,t−1, across the 30 days. Power was estimated using the Markov Chain Monte Carlo feature in in Mplus 8.2 (Muthén & Muthén, Reference Muthén and Muthén1998–2017) using the final values from the P→E models for positive and negative affect. Two thousand replications were specified for each analysis. For positive affect, power to detect significant b PEt,t−1 parameters ranged from .39–1.00 (M = .86, SD = .16; Mdn = .94). For negative affect, power to detect significant b PEt,t−1 parameters ranged from .26–1.00 (M = .70, SD = .30, Mdn = .90).
Discussion
Plomin et al. (Reference Plomin, DeFries and Loehlin1977) recognized that “environmental and genetic threads in the fabric of behavior are so tightly interwoven that they are indistinguishable’’ (p. 309). The twin data presented here and elsewhere (Beam et al., Reference Beam, Turkheimer, Dickens and Davis2015; Dolan et al., Reference Dolan, De Kort, Van Beijsterveldt, Bartels and Boomsma2014) suggest that genetic and environmental influences covary across time (i.e., days and years) to support differentiation in psychological traits and abilities over time. As matching between individuals and their environments ebbs and flows, so does rGE. These results, thus, address one process through which environments might come to be correlated with outcomes and genotype (Plomin, Reference Plomin1986).
Modeling approaches for accommodating and testing rGE (Beam & Turkheimer, Reference Beam and Turkheimer2013; de Kort et al., Reference de Kort, Dolan and Boomsma2012; Dolan, Huijskens, Minică, Neale, & Boomsma, Reference Dolan, Huijskens, Minică, Neale and Boomsma2019; Moscati, Verhulst, McKee, Silberg, & Eaves, Reference Moscati, Verhulst, McKee, Silberg and Eaves2018) are finally catching up to discussions over how genetic and environmental influences reciprocally influence one another (Anastasi, Reference Anastasi1958; Briley et al., Reference Briley, Livengood, Derringer, Tucker-Drob, Fraley and Roberts2019; Eaves et al., Reference Eaves, Krystyna, Martin and Jinks1977; Wachs, Reference Wachs1983). The REM approach taken in the current study places the individual at the center of change processes that drive observed phenotypic differences in positive and negative affect. Individuals are not passive recipients of their genotype and environments, as is implied in conventional twin models through specification of unidirectional pathways from genetic and environmental variance components to phenotypic outcomes. In this way, phenotypic stability not only depends on the degree of genetic and environmental relatedness but also on the consistency of similarity and differences of individuals' environmental systems (Lickliter & Harshaw, Reference Lickliter, Harshaw, Hood, Halpern, Greenberg and Lerner2010; West & King, Reference West and King1987). Siblings, for example, could increasingly differ if they are exposed to different learning activities and environments (e.g., one child is read to daily while the other is not) yet converge if their environments are highly similar (e.g., whatever one child gets, so does the other). By including person–environment effects in the current model that quantify the strength of the relation between twins’ affective outcomes and unique environments, we have shown real time selection and evocation of environments that contribute to daily differences in twins’ affect.
Person–environment effects that induce within-family rGE have implications for heritability estimates and longitudinal correlations of nonshared environments. In the present study, we found lower heritability estimates when allowing indirect relations between twins’ unique genotype and their unique environments, compared to models in which independence between genotype and environment was assumed. Adaptation to one's unique environmental context, thus, might account for why affect scores appeared to be highly heritable at first glance. Lower heritability estimates when rGE is modeled are a well-known statistical consequence due to rGE inflating genetic variance (Briley et al., Reference Briley, Livengood, Derringer, Tucker-Drob, Fraley and Roberts2019; Purcell, Reference Purcell2002) and possibly heritability, at least under the assumption of constant genetic variance across a range of environments.
We found support for the hypothesis that genetic influences on affect come to be correlated with environments because of the correlation between phenotypes and subsequent environmental influences contributing to their phenotypes (Gottlieb, Reference Gottlieb2003). Female twins in the sample may not have been selecting and reacting to environments randomly; rather, the data are consistent with our supposition that individuals select some environments and react to others based on the suitability of those environments. Further, given twins’ relatively stable affect scores across the 30 days, one possibility is that person–environment matching processes rise and fall over time with the ultimate purpose of stabilizing positive and negative affect responses over time.
Nonshared environments are expected to correlate across days, as environmental systems are not randomly distributed over time, although they tend to decay quickly over time (Burt, Khlar, & Klump, Reference Burt, Klahr and Klump2015). The content of environmental systems is worthy of comment. As nonshared environmental components in twin models comprise any nongenetic feature that contributes to within pair differences, including measurement error, identification of specific environmental factors that correlate with twins’ affect scores is beyond the scope of this study. Environmental systems probably comprise twins’ different interpretations of their shared relationships (e.g., parents) or neighborhoods, their unique peer networks, hormone levels (both stress and sex hormones), and molecular environments such as differences in DNA methylation and RNA transcription (Gottlieb, Reference Gottlieb2003). Twins who prefer quiet solitude compared to their co-twins, for example, probably avoid loud and crowded venues no matter the situation, but especially if they are perceived as engendering stress that might increase negative affect or lower positive affect. As Scarr (Reference Scarr1992) put it, environments are “largely the construction of individual family members in the ways they evoke responses from others, actively select or ignore opportunities, and construct their own experiences” (p.14). Construction of and reaction to experiences, broadly construed, should correlate with genotype, as genotype is responsive to environmental experiences (Kendler & Baker, Reference Kendler and Baker2007). Modeled rGE, thus, showed that twins’ total unique environments are temporally linked for longer than expected under models that assume genetic and environmental covariation.
Of note, rGE estimates fluctuated systematically over time, particularly between Days 15 and 30 – the latter “half” of the menstrual cycle. As the current study is observational, we cannot rule out these and other third variable confounds that account for P→E effects (e.g., coping skills, distress, physical illness/disability). Although we could not identify specific biological or environmental factors in twins’ lives that determine increases in rGE underlying positive and negative affect, we can only speculate about the reasons why. Stress vulnerability to daily hassles, possibly because of hormonal factors, social environmental factors, or both, might be greater in latter days of the cycle. Previous findings suggest that the luteal phase – and particularly the late luteal period – may represent a period of intensified daily hassles compared to the follicular phase (Kiesner, Mendle, Eisenlohr-Moul, & Pastore, Reference Kiesner, Mendle, Eisenlohr-Moul and Pastore2016). Women may be more prone to select environments for stress management, as environmental factors such as perceived stress and social support might exacerbate cycle-related changes in affect (Romans et al., Reference Romans, Clarkson, Einstein, Petrovic and Stewart2012). Accordingly, environmental context has been identified as an important contributor to daily mood ratings (Stone, Marco, Cruise, Cox, & Neale, Reference Stone, Marco, Cruise, Cox and Neale1996). A successful match between persons and environments, thus, might be especially relevant during high-stress vulnerability phases relative to low-stress vulnerability phases.
Environmental components in the within-family rGE estimates likely consist of the correlation between genotype and hormones. Estrogen and progesterone trigger changes in gene expression (Cole, Reference Cole2009; Östlund, Keller, & Hurd, Reference Östlund, Keller and Hurd2003), and genetic factors account for individual physiological and behavioral responses to estrogen and progesterone levels (Klump et al., Reference Klump, Burt, Mcgue and Iacono2007; Wall et al., Reference Wall, Hewitt, Case, Lin, Korach and Teuscher2014). Under this explanation, any influence ovarian hormones have on genotype would not make much of a difference for hypothesized P→E matching. Hormones, rather, are a source variance that accounts for genetic variability that ultimately correlates with nonshared environmental factors downstream. Within-pair differences in estrogen and progesterone levels during the luteal phase, however, might moderate (or mediate) within-pair genetic effects on differences in affect, as was found for binge eating in the same sample (Klump, Fowler, Mayhall, Sisk, Culbert, & Burt, Reference Klump, Fowler, Mayhall, Sisk, Culbert and Burt2018). Significant P→E effects, thus, may reflect Gene×Environment interaction (GxE) rather than rGE. P→E models cannot rule out GxE processes as the P→E generating mechanism or whether the GxE processes are exogenous or endogenous to individuals. In reality, we expect rGE and GxE processes to contribute to observed P→E effects. In general, indirect and bidirectional associations among molecular factors, like ovarian and stress hormones, genotype, and environment are more likely than direct genetic effects on affect, similar to most, if not all, human complex traits (Anastasi, Reference Anastasi1958; Gottlieb, Reference Gottlieb2003).
Future research implementing P→E parameters, thus, would benefit from specifying measured biological (e.g., mRNA and hormones) and environmental (e.g., peer relationships) factors, in addition to nonspecific environmental factors (Wachs, Reference Wachs1983). Future longitudinal twin modeling would also benefit from incorporating GxE in the presence of rGE (Johnson, Reference Johnson2007). P→E models that include intermediate variables in the causal chain and GxE processes need to be developed.
Although accommodating rGE in longitudinal behavioral genetic models has the advantage of explicating how environments come to be correlated with psychological traits and heredity, P→E parameters change the meaning of nonshared environmental components (Dolan et al., Reference Dolan, De Kort, Van Beijsterveldt, Bartels and Boomsma2014). Our empirical test compared nonshared environmental components with and without rGE and suggested that including P→E may do so only minimally. While the theoretical meaning of the nonshared environment does change by virtue of genetic components indirectly predicting environmental components, the model-estimated nonshared environment correlations did not differ appreciably, suggesting overall similarity in the interpretation of the nonshared environment. While twin studies do not clarify specific environmental factors that contribute to any phenotype (Wachs, Reference Wachs1983), the implication that differences in environmental exposure matter for maintaining stability of affect seem to be preserved when genetic and environmental components are allowed to correlate.
Accommodating rGE in longitudinal twin models explicitly demonstrates how the mutual exchange between people and their environments might cause highly heritable traits to increase over time, as originally proposed by Dickens and Flynn (Reference Dickens and Flynn2001). Meta-analyses of longitudinal findings have drawn on Dickens and Flynn's version of the REM to understand age trends in genetic and environmental variance components, but only indirectly (Briley & Tucker-Drob, Reference Briley and Tucker-Drob2013, Reference Briley and Tucker-Drob2014; Tucker-Drob & Briley, Reference Tucker-Drob and Briley2014). These studies must assume the same independence assumption and so postulate that twin correlations decrease with age in DZ twins compared to MZ twins (see also McCartney, Harris, & Bernieri, Reference McCartney, Harris and Bernieri1990), but never address the developmental systems that explain how DZ twins diverge in similarity over time.
The temporal dynamics of phenotype–environment matching might differ across traits and abilities. For traits that tend to be highly stable and evolve slowly over time, like personality (Roberts & Mroczek, Reference Roberts and Mroczek2008), within-family rGE is expected to rise precipitously and to level off when persons are more or less canalized into their adult environments. Research designs probably can include long intervals of time between measurements for such phenotypes and still detect within-family rGE, as environments that support these traits are unlikely to change over short intervals of time and are expected to be highly correlated and decline slowly (e.g., jobs tend to consist of similar environmental demands over long periods). For phenotypes that fluctuate daily, such as affect, perceived stress, and psychiatric symptoms (e.g., depressive symptomatology), within-family rGE is expected to increase and decrease over relatively short intervals of time because of state dependence. Further, nonshared environmental correlations would be expected to persist, but decline quickly with the passage of time. Individuals prone to depression, for example, are not continuously depressed nor do individuals prone to seeing their world as stressful always feel stressed. Minor arguments with a friend that influence depression and stress symptoms one day may have short-term effects on environments the next day or the following day (e.g., distancing oneself to calm down), but generally do not persist over many days (e.g., interpersonal differences are mended after a few days).
Consistent with the above expectations, etiological influences on positive and negative affect, including rGE, fluctuated across days rather than increased linearly. Detection of within-family rGE for state-dependent phenotypes, thus, requires shorter divisions of time that can capture day-to-day variability in rGE. This is the first study to test rGE of a phenotype over days, and demonstrates that the rGE underlying state-dependent phenotypes are observed when lags between measurements are short. In one previous study with depressive symptom measurements separated by years, person–environment effects that generate within-family rGE were not found (Beam et al., Reference Beam, Emery, Reynolds, Gatz, Turkheimer and Pedersen2016), possibly because the intervals of time between measurements (approximately three years) were too long to capture meaningful person–environment correlations underlying the temporal dynamics of depressive symptoms. By comparison, in studies of phenotypes that are relatively stable over years, like cognitive ability (Beam et al., Reference Beam, Turkheimer, Dickens and Davis2015; de Kort et al., Reference de Kort, Dolan, Kan, van Beijsterveldt, Bartels and Boomsma2014) and personality (Beam & Sharp, Reference Beam and Sharp2020), within-family rGE was observed and tended to increase monotonically and stabilize over time.
Limitations & future directions
The most notable limitation in the current study is that processes other than rGE (e.g., GxE interaction) might account for stability of pair differences in affect over the 30 days of the menstrual cycle studied here. Along this same theme, a second limitation is that other biological processes that factor into pair differences remain unaccounted for in the current study. Molecular environments, like polygenic scores (Dolan et al., Reference Dolan, Huijskens, Minică, Neale and Boomsma2019), RNA transcription and protein transcription, responsible for genetic expression have a great deal to do with phenotypic expression (Cole, Reference Cole2009; Gottlieb, Reference Gottlieb2003). Intermediary pathways that lie between genotype, behavior, and environments may help to clarify how heritability changes over time.
A third limitation of the current study is the assumption that all twins experienced functionally equivalent environments across the 30 days, such that the roles of specific environments cannot be made (Wachs, Reference Wachs1983). In other words, it remains unclear whether one twin experienced a more extreme environment (e.g., trauma exposure) compared to her co-twin. Likewise, nonshared environmental variance and measurement error were not differentiated, so we cannot conclude definitively that genetic variance correlates with nonshared environmental sources of variance alone.
A fourth limitation is that we did not account for the possibility that genetic variance underlying affect at Day t might also correlate with shared environmental variance underlying affect at Day t+1. While it is possible to model between-family rGE using a similar approach as the one taken in the current study, such modeling is useful for testing how between-family rGE causes both twins in a family to diverge from both twins in another family. As our focus was on whether within-family rGE partially explains how individuals diverge, modeling between-family rGE fell outside our study goals.
A fifth limitation is that the P→E model assumes that the autocorrelation structure between measurement occasions are stationary and that the process under scrutiny is noncyclic. The time metric used in the current study, the menstrual cycle, however, is nonstationary and cyclic. The P→E parameterization, thus, may oversimplify the person–environment matching process hypothesized to occur over time in these data. As there are no other daily twin studies with as many repeated measurements as in the MSUTR, this study offers a rare glimpse into person–environment processes that account for differences in daily affect scores.
A final limitation concerns the study design. First, the sample size was relatively small with only 265 families. Yet, the repeated measurement design increases measurement precision, which in turn reduces the necessary sample size to achieve a given level of power (Allison et al., Reference Allison, Thiel, St. Jean, Elston, Infante and Schork1998; Evans, Reference Evans2002). This was reflected in the adequate power to detect P→E effects, on average, observed in our post-hoc power analysis. Second, we observed significant within-person differences in positive and negative affect scores between days in which affect scores were supplied online versus supplied on Scantron cards, with slightly higher scores reported on days using Scantron cards. This limitation, however, is offset by the advantage of recording twins’ scores rather than not on days when twins did not have online access.
There are a number of directions for future research that would benefit the field of developmental behavioral genetics, both of which are oriented toward understanding how heritability changes with time and become correlated with nonshared environments. First, daily twin studies with time scales that are both stationary and noncyclic should be a priority, as this study design would satisfy the P→E model assumptions. Second, the inclusion of measured genotypic differences, like polygenic scores, would permit tests of whether nonshared environmental differences correlate with differences in measured causal variants. Work in this area is underway (Dolan et al., Reference Dolan, Huijskens, Minică, Neale and Boomsma2019). A third direction involves cohort sequential designs in longitudinal twin studies. This approach would help clarify when P→E effects are greatest across different developmental periods. Certain periods of development might be more critical for person–environment matching than others (e.g., looking for a first job vs. a lateral career move in midlife). The fourth direction we hope to see in future studies is the integration of experimental designs with behavioral genetic approaches, like the one recently taken by Burt, Plaisance, and Hambrick (Reference Burt, Plaisance and Hambrick2019). Randomly assigning twins within pairs to different environmental exposures may offer insight into the ways in which twins’ construction and reaction to initial random environmental exposure influences developmental trajectories and rGE. Random assignment to different environments may induce twins to differentiate within brief windows of time because of within-family rGE processes, provided that the trait, like affect, can be manipulated over short periods of time. Although P→E effect sizes might be small (see also Dolan et al., Reference Dolan, De Kort, Van Beijsterveldt, Bartels and Boomsma2014), they can have meaningful consequences for developmental outcomes when repeated consistently over time (Funder & Ozer, Reference Funder and Ozer2019).
Supplementary Material
The supplementary material for this article can be found at https://doi.org/10.1017/S0954579420001017.
Acknoweledgement
We thank Eric Turkheimer for providing helpful comments on an early draft of this manuscript.
Funding Statement
This work was supported by the National Institute of Mental Health (R01 MH082054) and the National Institute on Aging (T32 AG000037-37).
Conflicts of Interest
None