I. Introduction
Climate change is anticipated to drive geographic shifts in the optimal climates for many important agricultural commodities as well as many plant and animal species. Humans, who have an ability to anticipate and proactively respond to expected changes, are likely to realign agricultural production at a rate that outpaces species' ability to adjust to changing climate. This may place the interests of continued agricultural productivity in potential conflict with the interests of conserving remaining natural lands and imperiled species. A growing body of literature is rapidly assessing the potential impacts of climate change on the global food supply and agricultural productivity (e.g., Diffenbaugh et al., Reference Diffenbaugh, Hertel, Scherer and Verma2012; Leemans and Solomon, Reference Leemans and Solomon1993; Lobell et al., Reference Lobell, Schlenker and Costa-Roberts2011). A parallel body of literature has examined the possible fate of natural communities and ecosystems under climate change (e.g., Kelly and Goulden, Reference Kelly and Goulden2008; Parmesan, Reference Parmesan2006; Parmesan et al., Reference Parmesan1999; Root et al., Reference Root, Price, Hall, Schneider, Rosenzweig and Pounds2003; Rosenzweig et al., Reference Rosenzweig, Karoly, Vicarelli, Neofotis, Wu, Casassa, Menzel, Root, Estrella, Seguin, Tryjanowski, Liu, Rawlins and Imeson2008). However, comparatively few studies to date have assessed how and where these two issues intersect (though see Hannah et al., Reference Hannah, Roehrdanz, Shepard, Ikegami, Shaw, Tabor, Zhui, Marquet and Hijmans2013a). The cultivation of grapes for wine production, with the industry's emphasis on capturing ideal climates to support the craft of winemaking and their coincidence with global biodiversity hotspots within Mediterranean climates, provides an excellent opportunity for examining the tradeoffs between agricultural production and conservation that are likely to unfold under climate change.
The practice of premium viticulture has long been tied to a combination of climate, geography, and culture, often referred to as terroir (Vaudour, Reference Vaudour2002; White et al., Reference White, Whalen and Jones2009). The world's most famous winegrowing regions are romanticized for the climatic attributes that contribute to each region's particular style of wine, as well as for the assemblage of varietals that thrive in the setting. Individual vintages are heralded as the precise combination and timing of climatic events within a particular growing season. Furthermore, there is historical evidence that the spatial distribution of viticulture in Europe has tracked broad trends in global climate; expanding northward during the Medieval warm period of the thirteenth and fourteenth centuries and retracting to the south during subsequent cooler Little Ice Age of the nineteenth century (Le Roy-Ladurie, Reference Le Roy-Ladurie1967; Pfister, Reference Pfister, Wanner and Siegenthaler1988). Given the importance of climate in determining the global distribution of winegrowing regions and the sensitivity of wine quality to the local-scale climate events of a given growing season, it is anticipated that twenty-first century climate change has the potential to have significant impact on the wine industry in many established viticulture regions and in many areas becoming newly suitable for growing wine grapes (Ashenfelter and Storchmann, Reference Ashenfelter and Storchmann2010; Diffenbaugh et al., Reference Diffenbaugh, White, Jones and Ashfaq2011; Hannah et al., Reference Hannah, Roehrdanz, Shepard, Ikegami, Shaw, Tabor, Zhui, Marquet and Hijmans2013a; Jones et al., Reference Jones, White, Cooper and Storchmann2005; Mancino, Reference Mancino2012; Moriondo et al., Reference Moriondo, Jones, Bois, Dibari, Ferrise, Trombi and Bindi2013; Vink et al., Reference Vink, Deloire., Bonnardot and Ewer2012; Webb et al., Reference Webb, Whetton and Barlow2007; White et al., Reference White, Diffenbaugh, Jones, Pal and Giorgi2006).
Conservationists are increasingly aware that there are likely to be both direct and indirect impacts on natural systems resulting from the same climatic changes that are affecting agriculture. The past two decades of study have focused on the direct impacts on species and ecosystems (Heller and Zavaleta, Reference Heller and Zavaleta2009; Mawdsley et al., Reference Mawdsley, O'Malley and Ojima2009). However, more recent literature has begun to focus on indirect impacts from human translocation and shifts in agriculture due to climate change (Turner et al., Reference Turner, Bradley, Estes, Hole, Oppenheimer and Wilcove2010; Wetzel et al., Reference Wetzel, Kissling, Beissmann and Penn2012). As climate change causes shifts in crop suitability, previously marginal areas of production that are in natural habitat may come under pressure for production. At the same time, species ranges will be shifting to track suitable climates, resulting in a “race” to new lands for wildlife and crops.
California provides an ideal testbed for examining these issues. It is one of the world's leading wine-producing regions and a global biodiversity hotspot. The wine industry in California is very sensitive to environmental concerns. The state covers a range of latitudes and has great topographic relief over which the impacts of climate change will play out.
A. Previous Work on Climate Change and Viticulture in California
Several studies have assessed California viticulture suitability in terms of mean annual temperature and heat summation under climate change (e.g., Diffenbaugh and Scherer, Reference Diffenbaugh and Scherer2013; Haeger and Storchmann, Reference Haeger and Storchmann2006; Hayhoe et al., Reference Hayhoe, Cayan, Field, Frumhoff, Maurer, Miller, Moser, Schneider, Cahill, Cleland, Dale, Drapek, Hanemann, Kalkstein, Lenihan, Lunch, Neilson, Sheridan and Verville2004; Jones et al., Reference Jones, White, Cooper and Storchmann2005; Nemani et al., Reference Nemani, White, Cayan, Jones, Running, Coughlan and Peterson2001; White et al., Reference White, Diffenbaugh, Jones, Pal and Giorgi2006). In addition to studies of long-term average climate, other authors have examined the impact of the changing frequency of extreme events (heat or cold) on long-term viability of viticulture under climate change (e.g., Diffenbaugh et al., Reference Diffenbaugh, White, Jones and Ashfaq2011; White et al., Reference White, Diffenbaugh, Jones, Pal and Giorgi2006). Yet others have fine-tuned suitability models to link the effects that yearly climate has on yields (Lobell et al., Reference Lobell, Cahill and Field2007) or quality (Jones et al., Reference Jones, White, Cooper and Storchmann2005; Nemani et al., Reference Nemani, White, Cayan, Jones, Running, Coughlan and Peterson2001) of wine produced in a given location. For California, a majority of recent studies project a redistribution of optimal viticulture climate in the coming decades that will likely engender adaptive responses from the viticulture industry (Nicholas and Durham, Reference Nicholas and Durham2012).
B. Global Context
This paper is a companion to a global-level study of climate change impacts on viticulture and conservation. Global context is important in an assessment of local and regional impacts, as demonstrated in previous assessments of climate change effects on productive sectors in California (e.g., Hannah et al., Reference Hannah, Costello, Guo, Ries, Kolstad, Panitz and Snider2011). Climate change-driven shifts in global production can alter prices in ways that can overwhelm local changes in production. For this reason, we have conducted both a global and a statewide assessment of changes in viticulture suitability and the possible resulting consequences for conservation.
The same processes that will affect viticulture within California under climate change will also affect viticulture worldwide. To fully understand the impact of climate change on California viticulture, the global context of projected climate impacts on winegrape production needs to be considered. For instance, projected redistribution of viticulture climates in other prominent wine-producing regions could influence global supply. To place California in relative global context, we compare the impact of climate change on California viticulture to the change projected in other regions (Hannah et al., Reference Hannah, Roehrdanz, Shepard, Ikegami, Shaw, Tabor, Zhui, Marquet and Hijmans2013a). Additionally, we build an alternate model of viticulture suitability within California that incorporates global viticulture occurrence points to better capture the full spectrum of climates where viticulture is currently practiced worldwide.
C. Novel Aspects of This Study
This is the first study that explicitly assesses the potential intersection of shifting viticulture climates with conservation interests in California. This study utilizes recently produced fine-scale climate data (Flint and Flint, Reference Flint and Flint2012) to model optimal climates for viticulture within California at 270 m horizontal resolution. Modeling at this resolution has the potential to better capture local-scale processes that control climatic suitability and to better represent the fine-scale effects of topography. Our analysis is the first to look at statewide impacts on conservation issues as they pertain to shifting suitability of viticulture.
II. Approach and Methods
We model the distribution of optimal climates for premium viticulture in California for the present and in two future time periods (2040–2070, 2070–2100). The future projections were conducted with two global climate models that sketch the possible climate futures for California. The Geophysical Fluid Dynamics Laboratory (GFDL) model offers a hot-dry future whereas the Parallel Climate Model (PCM) model shows comparatively muted warming, along with projected increases in precipitation statewide (Cayan et al., Reference Cayan, Maurer, Dettinger, Tyree and Hayhoe2008). Future projections were conducted in two emissions scenarios: A2, which is the best approximation of the current emissions trajectory, and B1, which would require international action to abate emissions by the mid-twenty-first century.
To assess the extent to which the distribution of optimal viticulture climates in the future intersects with natural lands of conservation value, the future distributions were mapped against a national landcover dataset (Homer et al., Reference Homer, Huang, Yang, Wylie and Coan2004) that identifies land that is currently undeveloped. Protected areas were assumed to retain their protection status and were thus excluded from the analysis.
A. Viticulture Suitability Models
We used three viticulture suitability models, representing each of three broad classes of suitability models that have been proposed based on (1) average or extreme growing season temperatures, (2) phenology, and (3) multiple variables. For the temperature approach, we chose average temperature during the growing season—the most commonly applied temperature model. From the phenological approaches previously published, we selected growing degree day accumulation, the most often utilized of this category. We used Maxent, a widely used climate-distribution model to represent multiple variable models, because of its broad acceptance and ease of application. Our implementation of each of these three models is described below.
Optimal average growing season temperatures for twenty-one common varietals of wine-producing V. vinifera were approximated from global distributions and viticulture regional climates in Jones et al. (Reference Jones, White, Cooper and Storchmann2005). Taken together, the optimal range for common wine varietals spans average growing-season temperatures from 13.1 °C–20.9 °C. In modeling current and projected suitability with average growing season, areas falling within this optimal range were considered suitable. Growing season was defined as April 1–October 31 in the Northern Hemisphere and October 1–April 30 in the Southern Hemisphere.
The phenological method is adapted from Hayhoe et al. (Reference Hayhoe, Cayan, Field, Frumhoff, Maurer, Miller, Moser, Schneider, Cahill, Cleland, Dale, Drapek, Hanemann, Kalkstein, Lenihan, Lunch, Neilson, Sheridan and Verville2004), in which viticulture suitability in California is determined by biophysical response of grapevines as ripening progresses. Gladstones (Reference Gladstones1992) assembled common winegrape varietals into eight distinct maturity groupings, depending on the heat summation required for fruit maturity and ripening. The timing of ripening for each grouping is determined by summing the biologically active growing degree days (GDD) above 10 °C. For example, cooler weather varietals such as Pinot Gris require 1,100 GDD for ripening, whereas Grenache ripens after 1,350 accumulated GDD. In this analysis, the month in which the required GDD summation is reached is used to determine suitability for viticulture. Average ripening month temperatures in the range 15 °C–22 °C are considered optimal, 22 °C–24 °C is marginal, and >24 °C impaired (after Gladstones, Reference Gladstones1992; Hayhoe et al., Reference Hayhoe, Cayan, Field, Frumhoff, Maurer, Miller, Moser, Schneider, Cahill, Cleland, Dale, Drapek, Hanemann, Kalkstein, Lenihan, Lunch, Neilson, Sheridan and Verville2004). A location was deemed suitable for viticulture if average ripening month temperature is optimal for any of the eight maturity groupings. Some authors have suggested that GDD heat accumulation should be capped at 19 °C—that is, temperatures above 19 °C do not contribute to the summed GDD of the ripening period (van Leeuwen et al., Reference Van Leeuwen, Schultz, de Cortazar-Atauri, Duchene, Ollat, Pieri, Bois, Goutouly, Qenol, Touzard, Malheiro, Bavaresco and Delrot2013). Here we have elected to use uncapped GDD summation as it has been judged more suitable for climate change analyses (Hall and Jones, Reference Hall and Jones2010; Hannah et al., Reference Hannah, Roehrdanz, Shepard, Ikegami, Shaw, Tabor, Zhui, Marquet and Hijmans2013b) and better reflects observed phenological shifts coincident with long-term increases in average temperatures (Webb et al., Reference Webb, Whetton and Barlow2011).
The Maxent climate-distribution model takes as input a set of layers or environmental variables (e.g., temperature, precipitation), as well as a set of occurrence locations, and produces a model of climatic suitability for a species (Phillips and Dudik, Reference Phillips and Dudik2008). We used this approach to model suitable climate space for cultivation of V. vinifera. The bioclimatic predictor variables used in Maxent modeling were:
• Average temperature in growing season
• Total precipitation in growing season
• Precipitation seasonality (coefficient of variation)
• Total GDD in growing season
• Mean maximum temperature of the warmest month during the growing season
• Mean minimum temperature of the coldest month during the growing season
• Mean diurnal range (mean monthly maximum-minimum)
• Mean minimum temperature of the coldest month
• Annual precipitation
• Aridity Index (annual precipitation/potential evapotranspiration)
Additional constraints were added for minimum temperature and precipitation. At the northern boundaries of wine-growing regions, chilling stress during growing season, and overwinter minimum temperatures are limiting factors in determining viticulture suitability. Overwinter cold hardiness of V. vinifera varies according to age of the vine, varietal, and seasonal timing of annual minimum temperatures. However, temperatures below –12 °C begin to cause tissue damage that can impair production, and temperatures below –25 °C are lethal to most varietals. To create a conservative threshold for excess risk of frost damage, areas with mean minimum temperature of the coldest month less than –15 °C were classified as unsuitable for viticulture.
Annual precipitation data for global wine regions (n = 135) were compiled from Gladstones (Reference Gladstones1992) and Johnson and Robinson (Reference Johnson and Robinson2007). The range of reported annual precipitation in these regions plus or minus two standard deviations was used to define the upper and lower bounds wine-growing suitability. As such, areas with more than 1,226 mm and less than 200 mm of precipitation were used as constraints defining areas as unsuitable for viticulture.
Minimum temperature and precipitation constraints were applied to the average temperature and phenology models. The constraints were not applied to Maxent multifactor modeling results, as minimum annual temperature and annual precipitation were included as predictor variables.
B. Climate Data
Climate data used to model the distribution of viticulture climates within the state of California was downscaled to 270 m using the methodology described in Flint and Flint (Reference Flint and Flint2012). In all cases, viticulture suitability models in California were built on 30-year averages of the relevant parameters. Viticulture suitability was modeled for current climate and future climates covering the time periods 2040–2070 and 2070–2100. For the California domain, GFDL and PCM projections were modeled individually.
C. Viticulture Occurrence Points
A dataset of occurrence points for viticulture within California was built for the multifactor Maxent modeling component of this analysis. Occurrence points in the dataset (n = 225) represent a sampling of vineyards within California American Viticulture Areas (AVAs) that were visually identifiable in 2010 aerial photography. Vineyards were selected for the dataset so as to represent the geographic extent and topographical diversity of each primary AVA. The strategy of surveying vineyards within each AVA was used to focus the search for visually identifiable vineyards. Also, as AVAs are established by vintner petition partly on the premise of distinct growing conditions, this strategy captures the full range of climates and soil types currently under vine in California. As petitioning for the designation of an AVA may be motivated by marketing strategy or product differentiation, AVAs—and thus occurrence points—are in greater density within regions internationally recognized for consistently producing high-quality wines. The density of occurrence points therefore does not necessarily correlate with county statistics of vineyard acreage (NASS, 2010), and prolific grape-producing counties in the comparatively large Central Valley AVA are not as well represented as the more topographically diverse Napa, Sonoma, and Mendocino Counties.
D. Natural Lands
To identify natural areas that potentially intersect with areas of optimal viticulture suitability, we used the National Landcover Dataset (NLCD) 2001 (Homer et al., Reference Homer, Huang, Yang, Wylie and Coan2004). Areas that were not categorized as any of the “developed” classifications (developed, open space; developed, low intensity; developed, medium intensity; developed, high intensity) or either agriculture/grazing classification (pasture/hay; cultivated crops) were considered natural lands. The area where optimal viticulture climate overlaps with these natural lands was tabulated for each of the three modeled time periods (see Figure 3; Table 3). This area of intersection can be interpreted as areas that are potentially at risk of ecological degradation due to vineyard relocation.
E. Protected Areas
Protected area locations and extents are taken from the 2011 California Protected Area Database (CPAD, 2011). Polygons of the CPAD were rasterized to match the 270 m grid cell size of the viticulture suitability layers. A grid cell was classified as “protected” if more than 50 percent intersected with a protected area polygon. Protected areas of all International Union for Conservation of Nature (IUCN) categories I–VI (offering a range of protection from strict wilderness to multiuse reserves) were then removed from the viticulture suitability maps and analysis for both current and future climates, under the assumption that viticulture will continue to be an excluded activity on protected lands. As such, all results presented here have omitted any current or future climatic suitability that occurs in existing protected areas.
III. Results
A. Geographical Redistribution of Optimal Viticulture Climates
Our models show a significant spatial relocation and an overall reduction of optimal viticulture climates within California (Figure 1). The general trend is for viticulture climates to shift northward, coastward, and upslope as mean growing season temperatures increase and heat summation is achieved earlier in the year. The degree of shift varies by GCM projections and emissions scenario, with the comparatively hotter and drier GFDL resulting in a more pronounced shift and steeper decline of optimal climates than PCM projections over the same period. Likewise, the business-as-usual A2 emissions scenario has greater impact than the B1 scenario, particularly for end-of-century projections.
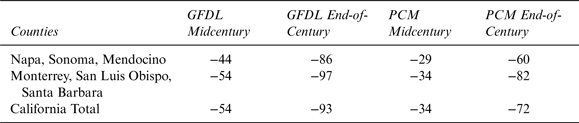
The ratio of modeled suitable acreage in future scenarios to current modeled suitability is shown in Table 1 for counties with the most currently suitable acreage. Viticulture areas in counties on the eastern and southern edges of the band of modeled current suitability (e.g., Napa, San Benito, Ventura Counties) show appreciable declines in total suitable acreage by midcentury and, in some cases, total displacement of optimal climates by the end of the century. More coastal or northerly counties (e.g., Marin, Mendocino, Monterey) show marginal increases in total suitable acreage by midcentury and lesser net declines in end-of-century projections.
B. Global Viticulture Climates Projected onto California
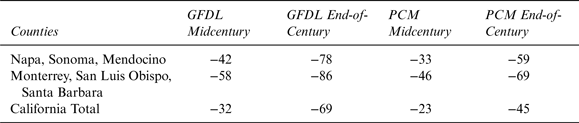
When the Maxent distribution model that was constructed with a global dataset of viticulture occurrence points is projected for California, the broader spectrum of optimal viticulture climates (encompassing both warmer and cooler climates than those associated with existing California viticulture) opens substantially more potentially suitable area than viticulture models built with California occurrence points alone—nearly double the modeled current area (Figure 2). Declines in total optimal area within California are muted compared to projections based on California-only viticulture occurrence points. Additionally, significantly more novel suitability is projected for northern coastal areas and unconventional areas of the northern interior (Figure 2, Table 2).
C. Conservation Impacts of Viticulture Adaptation in California
The expansion of viticulture over the past two decades has resulted in conversion and fragmentation of oak woodland habitats (Merenlender, Reference Merenlender2000), the displacement of native carnivore (e.g., mountain lions [Felis concolor]; bobcats [Lynx rufus]) ranges and the degradation of in-stream spawning sites for anadramous fish species (e.g., Central California Coast steelhead [Oncorhynchus mykiss]; Central California Coast coho [Oncorhynchus kisutch]) due to altered runoff and sediment loading (Hilty and Merenlender, Reference Hilty and Merenlender2004; Hilty et al., Reference Hilty, Brooks, Heaton and Merenlender2006; Lohse et al., Reference Lohse, Newburn, Opperman and Merenlender2008). Even short-distance relocation of vineyards locally upslope adjacent to major viticulture areas has the potential to develop or degrade remaining natural areas surrounding vineyards. In novel areas, the pressure to convert remaining natural lands will increase if global markets continue to grow. Although many vintners in California incorporate principles of sustainability into their vineyard management, the conversion of natural lands to vineyards has the potential to result in additional fragmentation and degradation of remaining habitat (Merenlender, Reference Merenlender2000).
In areas of existing viticulture that are experiencing declining suitability (red regions in Figures 1–3; counties with greater declines in suitability in Tables 1–2), adaptation measures such as cooling vines through overhead sprinklers or additional irrigation may add further strain to already stressed water resources and associated freshwater ecosystems. Freshwater withdrawals for frost abatement within viticulture areas have been shown to result in up to 96 percent reduction of in-stream flows during cold-weather events (Dietch et al., Reference Deitch, Kondolf and Merenlender2009). An increase of withdrawals for extreme heat mitigation during dry summer months would also affect regional water resource management and planning.
Modeled Distributions of Suitable Climates for Viticulture Under the A2 Emissions Scenario for Three Time Periods: 1971–2000 (Red); 2040–2070 (Orange); 2070–2100 (Blue)

Modeled Distributions of Suitable Climates for Viticulture Under the A2 Emissions Scenario for Three Time Periods Using Global Viticulture Occurrence Points: 1971–2000 (Red); 2040–2070 (Orange); 2070–2100 (Blue)
Change in Climates Currently Associated with Viticulture in California (% change)
Negative values of change can be interpreted as the percent of currently suitable land that will require adaptation measures for continued viticulture.
Change in Climates Currently Associated with Viticulture by County Using Global Viticulture Occurrence Points and A2 Emissions Scenario (% change)
Negative values of change can be interpreted as the percent of currently suitable land that will require adaptation measures for continued viticulture.
The issues of shifting suitability for viticulture climates and the possible competition with conservation interests become amplified in the context of climate change—with both freshwater ecosystems and important areas for accommodating species range shifts potentially at odds with viticulture relocation or in situ adaptation measures. Unprotected natural areas with suitable climates for viticulture in future projections are at potential risk of conversion (regions shown in black in Figure 3), especially considering the decline in suitability within many existing prime viticulture areas in California. Much of the area that is at potential risk of conversion occurs in the coastal ranges of northern and central California, a region noted for focal points of endemism of plant species within the larger California Floristic Province biodiversity hotspot (Raven and Axelrod, Reference Raven and Axelrod1978). Localized endemic regions that are potentially affected include Napa/Lake, Tamalpais, Pitkin Bodega, Santa Cruz, and Monterey (Raven and Axelrod, Reference Raven and Axelrod1978).
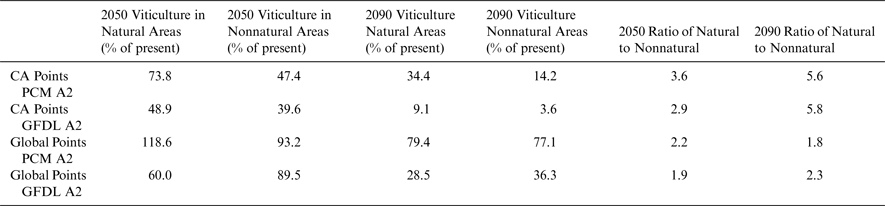
As optimal climates for viticulture shift under climate change, the total area that is climatically suitable within developed or nonnatural lands (i.e., area with minimal conservation conflict) diminishes over time (Table 3). For projections constructed on California-only occurrence points, the ratio of total optimal climate space that intersects with natural lands to climate space in nonnatural lands more than doubles from 2.3 in current climates to 5.8 by the end of the century in the hotter-drier GFDL climate model (Table 3). When global occurrence points are considered, a greater proportion of viticulture areas are retained through both periods, which results in a moderated impact on natural lands (Table 3). It should be noted that the inclusion of global viticulture occurrence points would represent many varietals and growing conditions that are not currently commonplace in California and thus would also require some form of adaptation by winegrowers. Visible regions in orange in Figure 3 are areas of existing agricultural development that retain suitability or become suitable in future periods. As they are within areas currently used for agriculture, these lands can be interpreted as minimal conservation impact options for vineyard relocation.
Potential Conflict of Natural Areas and Optimal Viticulture Climates
Summary of Climate Change Effects on the Total Optimal Viticulture Area in Nonnatural Lands and the Ratio of Viticulture Climates in Natural to Nonnatural Lands
IV. Discussion
A. Impacts of Climate Change and Adaptive Grower Responses
It is important to view these results as a representation of impacts on viticulture as it is currently practiced and without any adaptive responses available to winegrowers. Areas that show projected declines in optimal climates for viticulture are best interpreted as areas that will require some adaptive response on the part of wine growers or consumers to continue the practice of viticulture in that location—not as areas where it will be impossible to grow winegrapes. The results presented above are consistent with those presented in Diffenbaugh et al. (Reference Diffenbaugh, White, Jones and Ashfaq2011) and White et al. (Reference White, Diffenbaugh, Jones, Pal and Giorgi2006) in that total area optimal for viticulture in California is expected to decline substantially with a shift toward marginal and impaired growing conditions under twenty-first-century warming. It is possible that projected warming may result in short-term gains in either yield or quality for select growing regions, as suggested by Nemani et al. (Reference Nemani, White, Cayan, Jones, Running, Coughlan and Peterson2001), but the overall redistribution of optimal viticulture climates indicates the necessity of adaptation by the California viticulture industry in the coming decades.
Adaptation measures available to winegrowers include enhanced water development for irrigation or vine cooling, adoption of more heat-tolerant varietals, and vine orientation or trellising techniques to manage shading of the grape clusters vineyard, or relocation to more suitable climates. These adaptation measures vary in their economic feasibility and barriers to implementation. (For a discussion of the relative merits and ease of implementation among adaptation measures, see Diffenbaugh et al., Reference Diffenbaugh, White, Jones and Ashfaq2011; Nicholas and Durham, Reference Nicholas and Durham2012.) Nicholas and Durham (Reference Nicholas and Durham2012), in particular, offer a quantification of the likely order of adaptation measures implemented based on a survey of northern California vintners. As might be expected, measures that are least disruptive to the existing vineyard layout (e.g., in situ shading or installation of sprinklers for excess heat abatement) are likely first to be implemented and comparatively extreme measures such as vineyard relocation are options of last resort. We expect that the precise order of economic feasibility (and grower preference) will vary geographically but that this general pattern will hold from the perspective of small landholders. However, one might suppose that conglomerate beverage companies with multinational landholding portfolios may be less inclined to invest to preserve production on increasingly marginal lands and more receptive to novel locations that are experiencing enhanced climatic suitability.
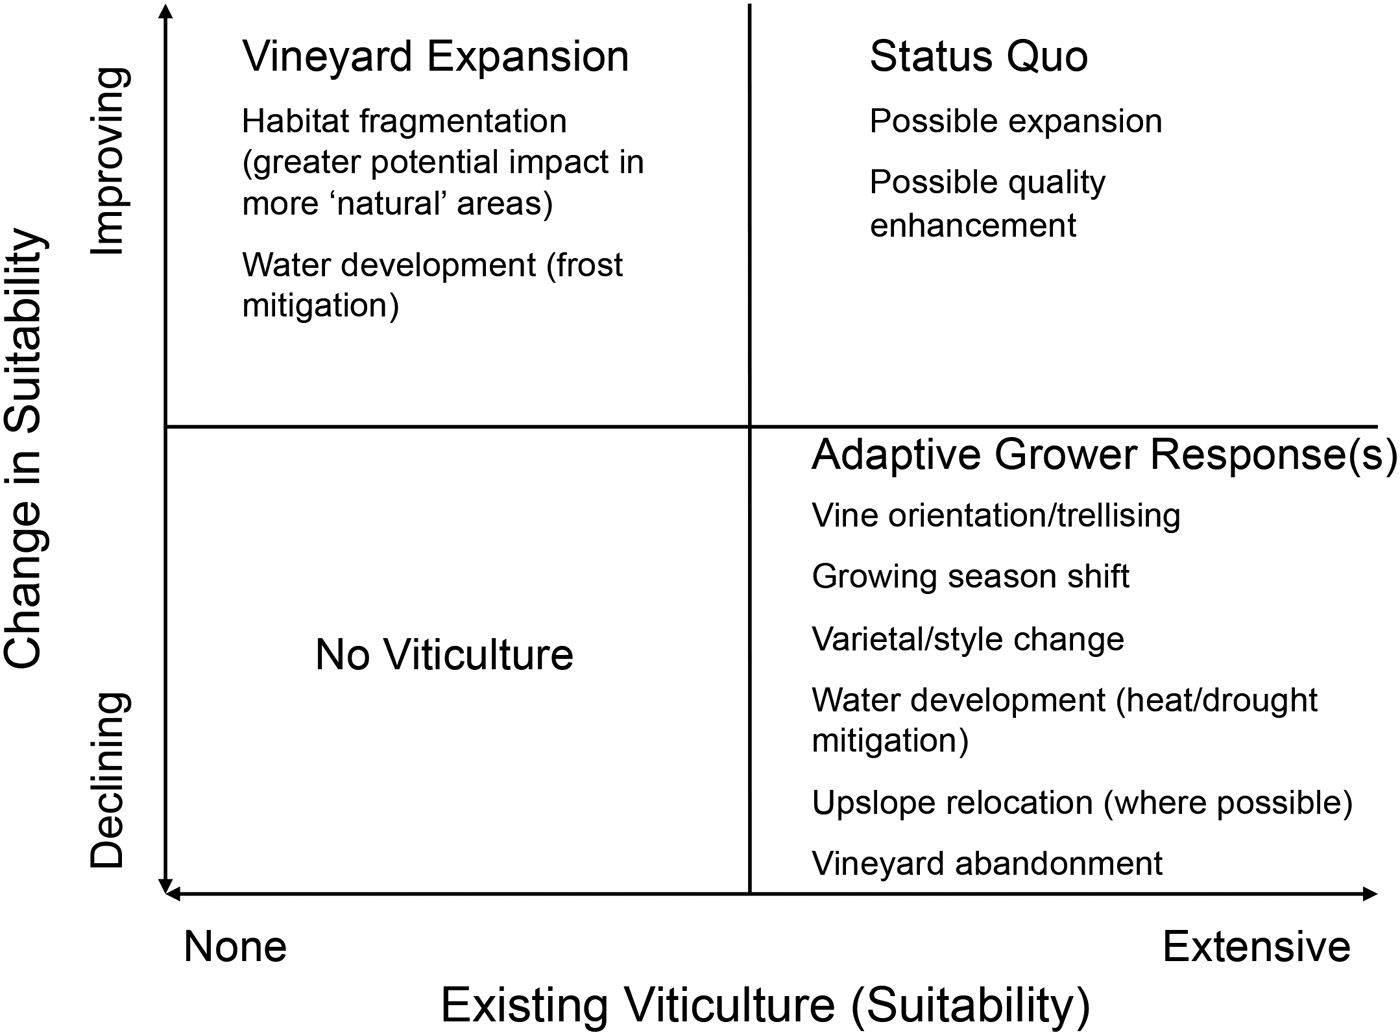
A conceptual model of the potential industry responses under a matrix of location-specific change scenarios is illustrated in Figure 4. The change scenarios and associated adaptation measures that will potentially have the most direct impacts on conservation are the relocation of vineyards of declining suitability to more advantageous climates on currently undeveloped land (lower-right quadrant to upper-left quadrant under most pronounced conditions) and augmented water development in watersheds that are already stressed by withdrawals for domestic or agricultural use (lower-right quadrant). Varying geographic or economic conditions that may influence the preferred mode of adaptation or the speed with which particular adaptation measures are adopted are worthy of additional study.
Conceptual Diagram of Aggregate Industry Responses to Scenarios of Shifting Climatic Conditions
Although California does experience a significant translocation and decline of existing optimal climates, when the balance of total suitable area is considered, California is in a favorable position relative to several other wine-producing regions in midcentury projections (Hannah et al., Reference Hannah, Roehrdanz, Shepard, Ikegami, Shaw, Tabor, Zhui, Marquet and Hijmans2013a). Many prominent existing winegrowing regions in California retain their suitability through midcentury due in part to the moderating influence of the cold Pacific waters on the California coast. Therefore, although California viticulture will certainly be affected by twenty-first-century climate change, the impacts are likely to be muted compared to those in many other global wine-producing regions. However, the potential strain on existing freshwater resources in areas of declining viticulture suitability (with attendant impacts on freshwater ecosystems) as well as the appreciable quantity of natural lands that are potentially affected by shifting viticulture climates accentuates the importance of joint planning by the viticulture industry and conservation groups.
V. Conclusions
With significant areas of potential conflict between natural lands and the future distribution of optimal climates for viticulture, focused application of adaptation measures that limit additional water development and vineyard relocation will be important in mitigating stress on remaining natural lands. Several of these adaptation measures, such as vine orientation, and trellising strategies to alter grape cluster insolation are already being implemented. Furthermore, planning and management that recognizes this potential resource conflict under climate change will be essential to maximize the continued vitality of both California viticulture and natural ecosystems.
The analysis presented here and the examination of the potential future tradeoffs as agriculture and species ranges shift under climate change could be replicated for any other major global commodity. The viticulture industry can, in fact, be recognized as a leader in terms of its willingness to implement management practices aimed at minimizing ecological impact. This is illustrated by several emerging industry-conservation coalitions such as the Biodiversity and Wine Initiative (South Africa), Entwine (Australia), Chile Climate Change Wine Coalition (Chile), and the Vinecology Group (U.S.–Global) that are dedicated to identifying sustainable solutions for the viticulture industry under climate change (Viers et al., Reference Viers, Williams, Nicholas, Barbosa, Kotze, Spence, Webb, Merenlender and Reynolds2013).
Additional regional studies with fine-scale climate data to capture the topographic complexity and microclimates available to viticulture (as was performed here) are warranted to enrich the global context of the issue. Analyses that are focused on the climate tolerances of dominant varietals within a region or that incorporate prevailing modes of viticulture (e.g., irrigated vs. non-irrigated) that dictate the likely adaptive responses among winegrowers will be particularly valuable in advancing the discussion and will help to provide detailed accounting of where potential conflicts between viticulture and conservation may arise.