Carbon can form many different allotropes due to the flexibility of its valence. Two well-known allotropes of carbon that naturally exist are diamond and graphite. In the past decades, increased research has focused on carbon balls such as buckminsterfullerene, carbon sheets such as graphene, and other larger-scale structures of carbon such as nanotubes, nanobuds, and nanoribbons.[Reference Arentt1–Reference Nasibulin, Pikhitsa, Jiang, Brown, Krasheninnikov, Anisimov, Queipo, Moisala, Gonzalez, Lientschnig, Hassanien, Shandakov, Lolli, Resasco, Choi, Tománek and Kauppinen6] So far, over 200 different allotropes of carbon have been reported.[Reference Hoffmann, Kabanov, Golov and Proserpio5] Recently, a new class of material known as “covetics” has emerged.[Reference Forrest, Jasiuk, Brown, Joyce, Mansour and Salamanca-Riba7–Reference Balachandran, Ma, Dorris, Koritala and Forrest9] Covetics are prepared by incorporating carbon nanostructures into metal matrices through melting and electrical infusion.[Reference Balachandran, Ma, Dorris, Koritala and Forrest9] This new class of materials is potentially a game changer for materials scientists and engineers who have long sought to combine light-weight and high-conductivity carbon with metal to enhance material performance. Enhanced electrical and thermal conductivities were reported for base metal covetics.[Reference Balachandran, Ma, Dorris, Koritala and Forrest9–Reference Jaim, Isaacs, Rashkeeva, Kuklja, Cole, LeMieux, Jasiuk, Nilufar and Salamanca-Riba11] In particular, Salamanca-Riba et al.[Reference Salamanca-Riba, Isaacs, LeMieux, Wan, Gaskell, Jiang, Wuttig, Mansour, Rashkeev, Kuklja, Zavalij, Santiago and Hu10] and Jaim et al.[Reference Jaim, Isaacs, Rashkeeva, Kuklja, Cole, LeMieux, Jasiuk, Nilufar and Salamanca-Riba11] reported carbon-nanostructure-infused silver and aluminum materials that exhibit high electrical and thermal conductivities. Balachandran et al.[Reference Balachandran, Ma, Dorris, Koritala and Forrest9, Reference Balachandran, Ma and Dorris12] reported the enhanced electrical and thermal properties of copper covetic materials and thin films.
Incorporation of a carbon nanostructure into base metal alloys not only promotes their electrical and thermal conductivities but also improves their mechanical properties.[Reference Bakir and Jasiuk13, Reference Ma, Wang, Lee, Dorris, Wen and Balachandran14] However, the performance of the resulting materials strongly depends on processing conditions. In this letter, we report synthesis, microstructure characterization, and electrical conductivity of copper covetics (CuCv) that were produced by electron-beam (e-beam) melting. Our results suggest that carbon nanostructures (including nanoparticles, nanobuds, and nanoribbons) dispersed in the matrix of host metals play a critical role in the enhancement of electrical and thermal properties.
Precursor powders were prepared by mixing an appropriate amount of copper powder (99.9% pure metal basis) and carbon powder (>99% purity) through ball milling. Precautions were taken to minimize copper oxidation by using a nitrogen-filled glovebox for processing, mixing the powders in organic solvent, and drying them in a vacuum oven. The resulting powders were loaded into an e-beam melting hearth with vitreous carbon-coated liner inside an e-beam melting system. A vacuum chamber base pressure of ≈1 × 10⁻⁷ torr was achieved before e-beam melting using an 8.0 kV accelerating voltage and a beam current up to a few hundred milliamps. The position of the electron beam was controlled by a pair of low inductance x- and y-coils with dynamic defocusing capability. This allows independent motion in the x- and y-directions, which permits electromagnetic stirring of the molten liquid inside the liner crucible. After melting, samples were rapidly cooled under a vacuum. Because the e-beam hearth was water cooled, the processed material solidified almost instantly after turning off the power to the hearth. After the melted nugget in the hearth reached room temperature, the vacuum chamber was backfilled with nitrogen to ambient pressure, the chamber door was opened, and the produced sample was retrieved. Details of the operation conditions for making covetic materials by e-beam melting were reported elsewhere.[Reference Balachandran, Ma and Dorris12, Reference Ma, Balachandran, Wang, Wen, Dorris, Lee and Rondinone15]
X-ray diffraction (XRD) study was conducted with a Bruker AXS D8 Discover diffraction system equipped with a Cu x-ray tube and a VÅNTEC-500 2D area detector. Scanning electron microscopy (SEM) was carried out with a Hitachi S-4700-II that is available at the Center for Nanoscale Materials (CNM), Argonne National Laboratory. Helium ion microscopy (HIM) was performed with a Zeiss Orion Nanofab that is available at the Center for Nanophase Materials Sciences (CNMS), Oak Ridge National Laboratory. The ion-polished specimen was prepared using a dual-ion beams Gatan precision ion polishing system (PIPS II) operated with argon ions. Electrical conductivity measurements were conducted by using thin bar specimens prepared from the melted nuggets made by e-beam melting. The bar specimens were polished using a South Bay Technology model 155 lapping fixture with 600 grit sandpaper. To eliminate any potential effect from surface stress due to cutting and polishing, specimens were annealed in a vacuum annealing system at 500 °C for 1 h before being tested. The actual temperature of the specimen during testing was monitored with a thermocouple affixed to a sapphire wafer covered sample holder on a Signatone probe station. Current and voltage leads were connected to a specimen through pressure contacts. Pulse delta current–voltage (I–V) measurements were accomplished with a combination of Keithley 6221 current source and Keithley 2182A nanovoltmeter driven by a LabVIEW program. Apparent resistance was determined from the slope of the measured I–V curve. For accurate and easy comparison of different types of samples, the electrical resistivity at 20 °C was calculated in accord with the ASTM B193 standard.[16]
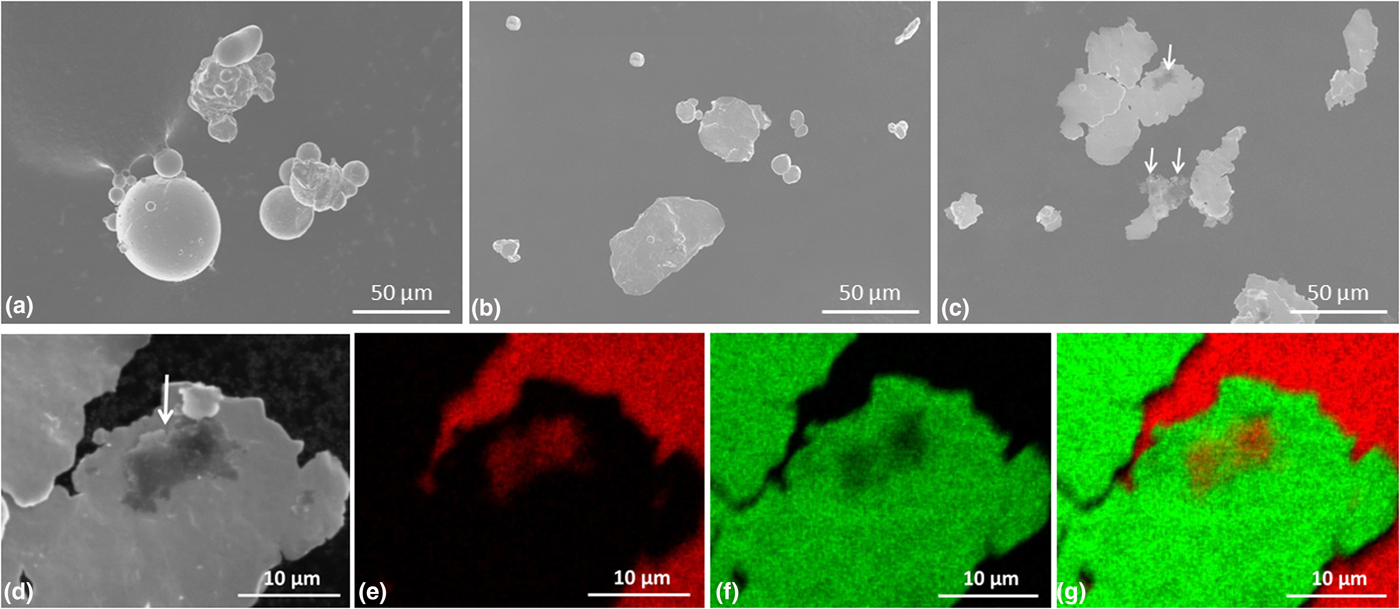
Figures 1(a)–1(c) show SEM micrographs of as-received 99.9% pure copper (3N Cu) powder [Fig. 1(a)], 3N Cu powder after ball milling [Fig. 1(b)], and the precursor powder mixture of 3N Cu with 0.4 wt% carbon after ball milling [Fig. 1(c)] that was used for the e-beam melting. To prepare specimens for SEM observation, all powders under investigation were sprinkled on a fresh surface of SEM carbon tape affixed to a sample holder. Copper particles in the 3N Cu powder are mostly spherical with particle sizes no more than 50 µm. Most of the smaller Cu particles are agglomerated to form larger ones, as shown in Fig. 1(a). After ball milling, some of these agglomerates broke up, and the spherical copper particles transformed into thin plate-shaped ones, as shown in Fig. 1(b). For the ball-milled precursor mixture of 3N Cu powder with 0.4 wt% carbon, it is evident that the graphitic carbon flakes were affixed to these thin flattened-out copper plates, as highlighted by the arrows shown in Fig. 1(c).
SEM micrographs of (a) 3N Cu powder before ball milling, (b) 3N Cu powder after ball milling, (c) precursor powder mixture after bill milling, (d) high magnification SEM micrograph, (e) carbon mapping image, (f) copper mapping image, and (g) carbon and copper superimposed mapping image of precursor powder of 3N Cu with 0.4 wt% graphitic carbon input after ball milling.

Figures 1(d)–1(g) show higher magnification SEM micrograph and associated energy-dispersive x-ray spectroscopy (EDS) elemental mappings of the precursor powder mixture of 3N Cu with 0.4 wt% carbon after ball milling. The SEM micrograph shown in Fig. 1(d) is a portion of the image shown in Fig. 1(c) only at higher magnifications where a graphitic carbon flake was marked by a single white arrow. The dark gray flaky feature (as marked by a white arrow) at the center of the image [Fig. 1(d)] is carbon-rich according to EDS elemental analysis. Elemental mapping microimages of carbon (red color) and copper (green color) are displayed in Figs. 1(e) and 1(f), respectively. The large bright red colored regions (near the right-hand side) shown in Fig. 1(e) correspond to the carbon tape that the precursor powder was sprinkled on. The same regions showed up as black regions in Figs. 1(d) and 1(f). The small dull feature shown at near the center of the image [Fig. 1(e)] is related to the graphitic carbon flake. It appeared as a dull red color spot in Fig. 1(e) due to its thin thickness. A superimposed elemental mapping microimage is shown in Fig. 1(g). The EDS elemental mapping results indicate that the feature at the center of the SEM micrograph is indeed a carbon flake affixed to the flattened copper piece.
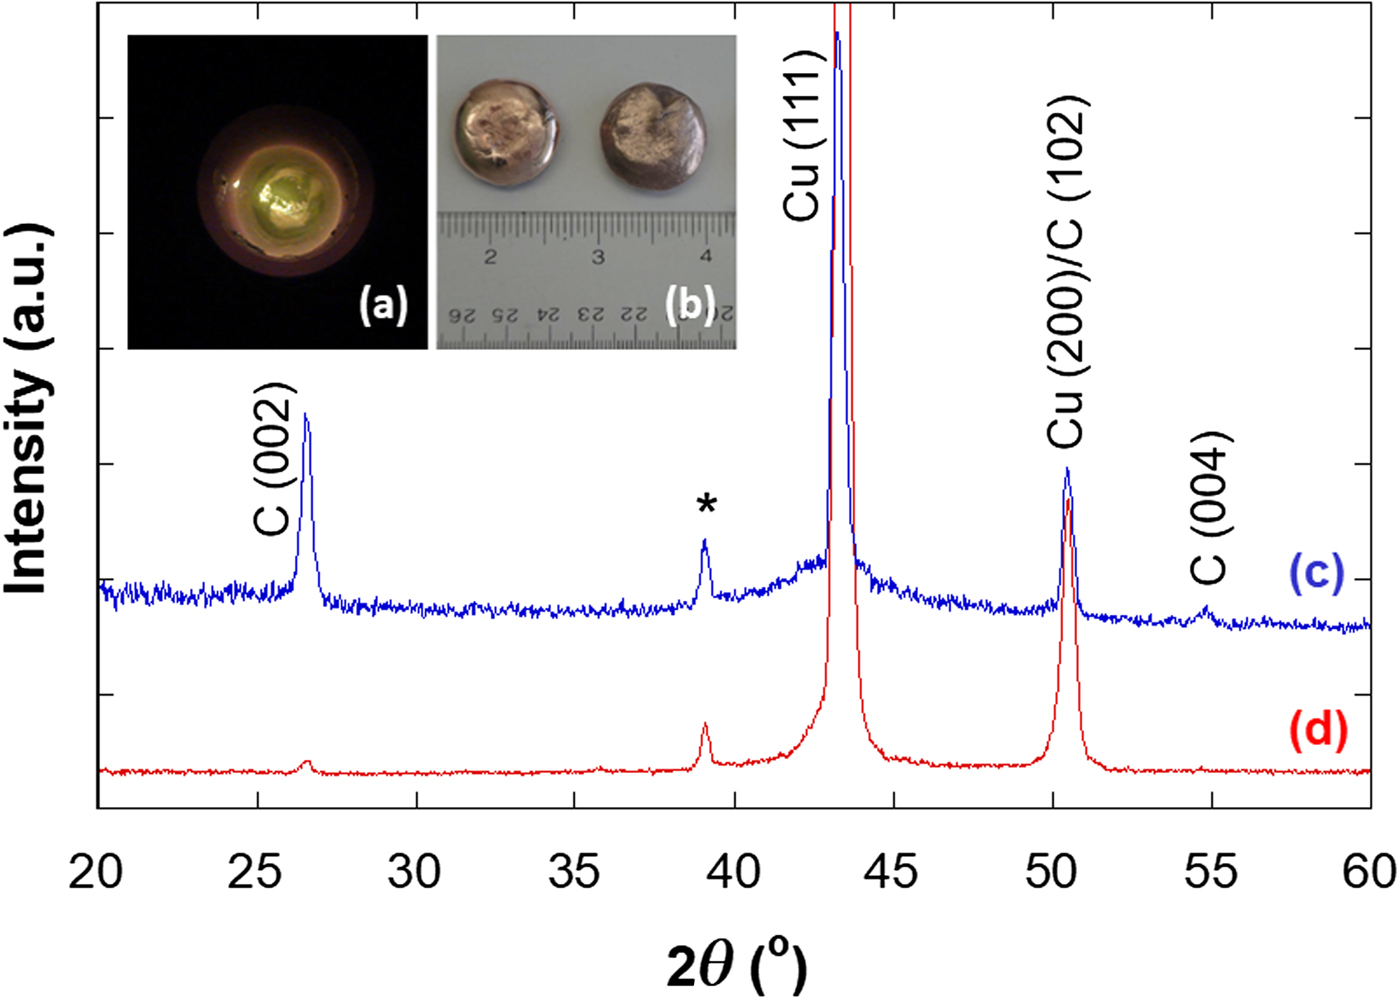
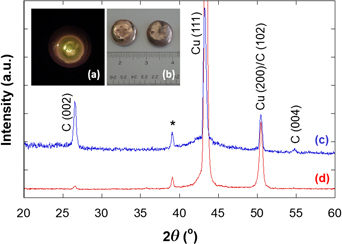
Figure 2(a) shows a photograph of the molten copper covetic (CuCv) sample inside an e-beam melting hearth with a graphite liner. The dark spots showing on the top surface of the molten fluid are likely associated with the yet has infused graphitic carbon. Figure 2(b) shows photograph of the melted 3N Cu without addition of carbon (CuCv0, on the left) and the 3N Cu with 0.4 wt% carbon input (CuCv4, on the right). The CuCv0 nugget is a little bit glossier than the CuCv4 nugget which has a thin layer of carbon covering the as-solidified surface. Rubbing a white cotton Q-tip against the CuCv4 nugget surface made the rubbed region on the CuCv4 shinier and stained the Q-tip cotton with a dark color residue. This suggests that loosely bonded graphitic carbon exists on the as-solidified surface of the e-beam melted nugget of CuCv4.
Photographs of (a) molten CuCv inside an e-beam hearth during melting, (b) melted CuCv0 (left) and CuCv4 (right) nuggets, and XRD patterns of (c) as-solidified surface and (d) polished surface of CuCv4 made by e-beam melting.

XRD patterns of an as-solidified surface and a polished surface of e-beam melted CuCv4 are shown in Figs. 2(c) and 2(d), respectively. All peaks in the measured diffraction patterns can be indexed according to JCPDS cards for copper (JCPDS 03-065-9743) and for graphite carbon (JCPDS 03-065-6212). The diffraction peak at 2θ = 39.1° (as marked by a “*” sign) is associated with the Cu Kβ radiation for Cu (111) peak. Diffraction peaks associated with the graphite (002) and (004) peaks are clearly visible in the XRD pattern of the as-solidified surface [Fig. 2(c)]. This has once again revealed the existence of graphitic carbon on the as-solidified surface of the CuCv4 made by e-beam melting. Whereas for XRD pattern of the polished surface of CuCv4 [Fig. 2(d)], the diffraction peak associated with graphite (002) at 2θ = 26.5° is unambiguously visible; but the peak associate with graphite (004) at 2θ = 54.7° is immersed within the background. This finding indicates that graphitic carbon has infused into copper matrix in the CuCv4 sample through e-beam melting process. These affixed to the as-solidified surface of CuCv4 are the excess graphitic carbons that were floating on the surface of the molten CuCv4 surface. It is likely that more and more graphitic carbon on the surface can be incorporated in the molten CuCv4 material after prolonged e-beam melting and electromagnetic stirring processing.
The densities as measured by Archimedes’ principle using laboratory-grade isopropyl alcohol (density = 0.7855 g/cm3) as the immersing medium were 8.86 and 8.53 g/cm3, respectively, for the CuCv0 and the CuCv4 samples. These values correspond to 98.9% and 96.4% of the respective theoretical densities, as listed in Table I. We used pure copper's density of 8.96 g/cm3[17] for calculating the theoretical density of CuCv0. To calculate the theoretical density of CuCv4, we applied the rule of mixtures based on the volume fraction of each component and a density of 2.266 g/cm3 for carbon. This leads to a theoretical density of 8.85 g/cm3 for CuCv4. It is worth noting that the measured densities for both CuCv0 and CuCv4 made by e-beam melting are close to but <100% of their theoretical values. Isolated small closed pores were observed in CuCv0 and CuCv4 samples by SEM and HIM microstructure analysis. Metalworking process such as hot rolling and wire drawing may reduce the porosity and enhance the mechanical properties of the resulting materials.
Bulk density of CuCv0 and CuCv4 samples determined by Archimedes’ principle.

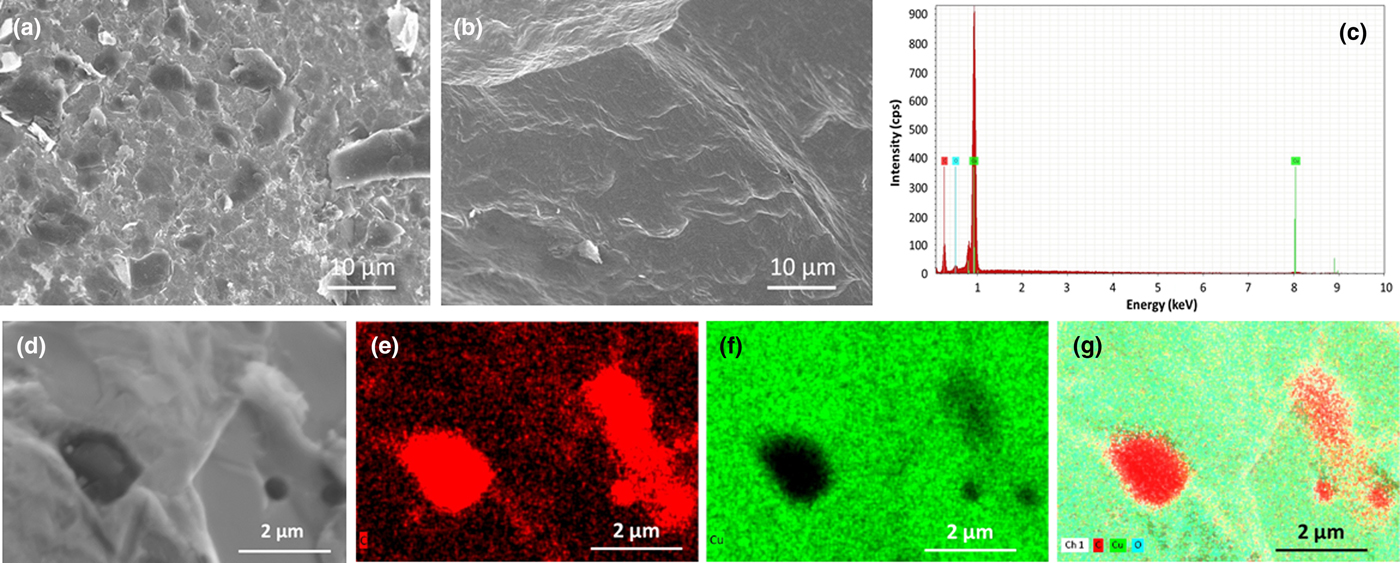
Figures 3(a) and 3(b) show the as-solidified surface and the tensile fracture surface SEM micrographs of CuCv4 made by e-beam melting. The as-solidified surface is relatively dense [as shown in Fig. 3(a)]. It is evident that carbon flakes of a few micrometers in size are present on the surface of the as-solidified CuCv4 nugget. These carbon flakes may consist of multilayer graphitic carbon sheets. The aforementioned Q-tip rubbing test indicates that these carbon particles are loosely bonded to the copper surface—likely a result of surface floating carbon due to the difference in densities between carbon and copper in the molten state. SEM micrographs of the tensile fracture surface of CuCv4 produced by e-beam melting are shown in Fig. 3(b). It revealed a relatively dense structure with some isolated carbon flakes and a few submicrometer-size closed pores. This microstructural finding for the CuCv4 sample is in agreement with the ≈3.6% porosity determined by Archimedes’ principle and listed in Table I.
SEM micrographs of (a) as-solidified surface and (b) tensile fracture surface of CuCv4, (c) SEM EDS spectrum of the mapping area, (d) secondary electron image, (e) carbon mapping image, (f) copper mapping image, and (g) superimposed image of as-solidified surface of CuCv4.

We conducted SEM/EDS elemental analysis to verify the existence of carbon flakes on the as-solidified surface of CuCv4 nuggets produced by e-beam melting. Figure 3(d) shows a SEM micrograph of as-solidified surface of CuCv4 nugget at higher magnification. Once again it revealed that the surface is covered with a thin layer of fish scale-like substance—graphitic carbon. In addition to the thin layer of carbon, there are three circular-shaped inclusions and an irregular-shaped thick carbon piece in this image. The EDS spectrum of the imaged area is shown in Fig. 3(c). It is evident that this area exhibits high carbon content. EDS mappings for the carbon and copper are shown in Figs. 3(e) and 3(f), respectively. A superimposed EDS mapping image is shown in Fig. 3(g). It is likely that the thin layer of carbon was floating on the surface of the molten CuCv4 because of its low density compared with copper, and the carbon flakes of micrometer sizes continued to affix to the surface of the solidified nugget during cooling. It is worth noting that the EDS elemental mapping for carbon [as shown in Fig. 3(e)] does not vibrantly reveal the structural details of this relatively uniform thin layer of carbon when compared with the circular-shaped carbon-rich inclusions and the irregular-shaped thick carbon piece. Nevertheless, based on the results of EDS surface analysis and the Q-tip testing, we can confidently conclude that a thin layer of graphitic carbon is indeed presented on the as-solidified surface of the CuCv4 nugget made by e-beam melting. However, carbon in the thin surface layer accounts for only a small fraction of the carbon source material that was added into the precursor powder mixture and subsequently infused in the CuCv4 samples through e-beam melting process. LECO carbon analysis conducted on specimens without the as-solidified surface layer indicates that carbon inside the resulting CuCv4 is very close to 0.4 wt%.
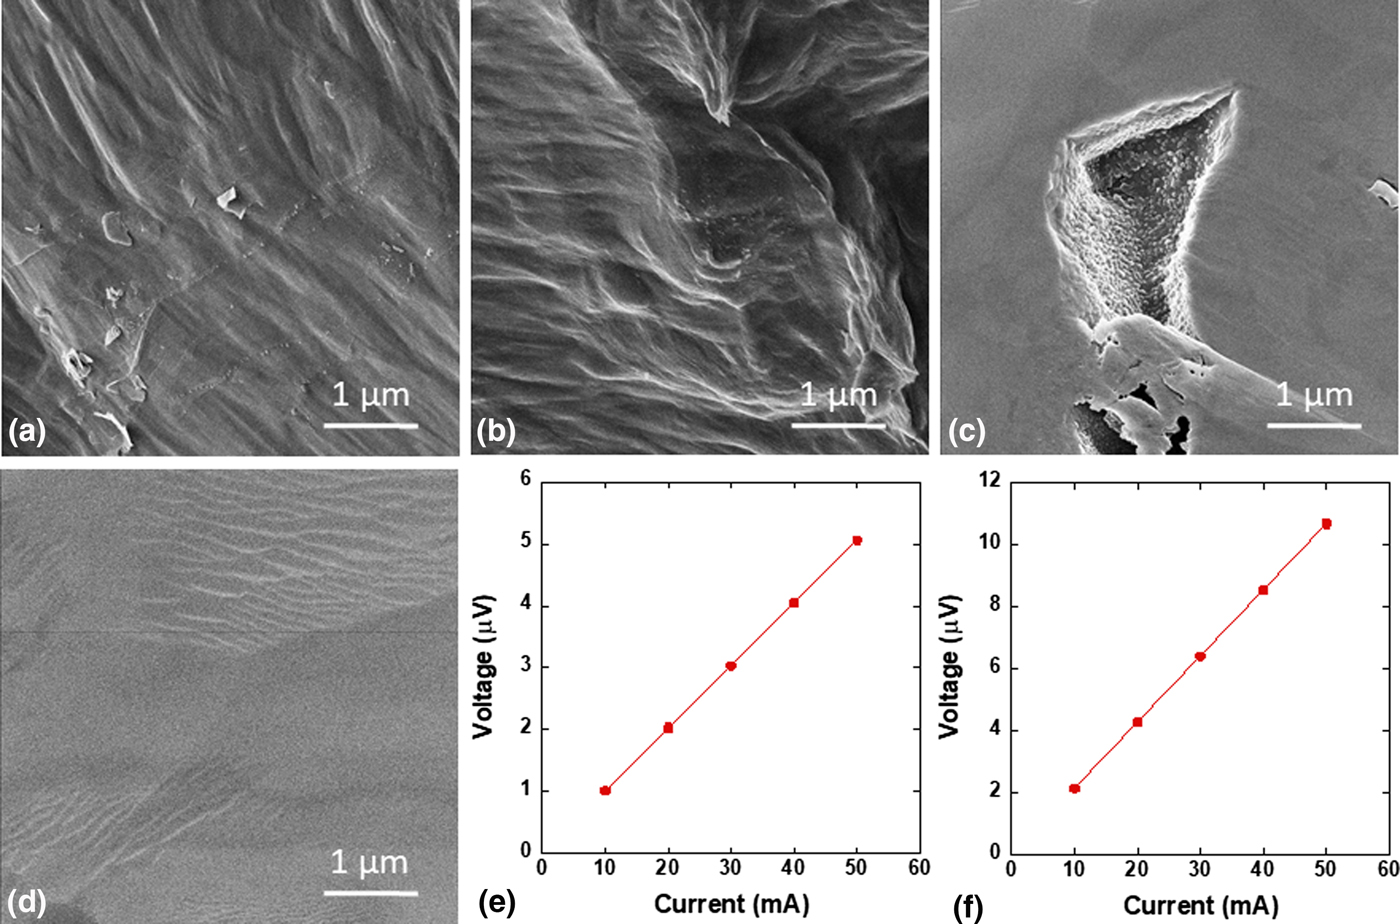
Figures 4(a) and 4(b) show HIM micrographs of the tensile fracture surfaces of the CuCv4 made by e-beam melting. Carbon flakes and bands/clusters of carbon nanoparticles are visible on the fracture surface [shown in Fig. 4(a)]. These flakes of submicrometer sizes originate from the carbon source that was added in the covetic conversion process. We also observed clusters of carbon nanoparticles, ≈10–100 nm in size, on the fracture surface, as shown in Fig. 4(b) (near the center). These nanoparticles resemble those reported by Salamanca-Riba et al.,[Reference Salamanca-Riba, Isaacs, LeMieux, Wan, Gaskell, Jiang, Wuttig, Mansour, Rashkeev, Kuklja, Zavalij, Santiago and Hu10] who observed them by HIM in the fracture surface of aluminum covetics. Ripple-shaped features associated with carbon nanoribbons[Reference Ma, Balachandran, Wang, Wen, Dorris, Lee and Rondinone15] were visible on the fracture-surface HIM micrographs. Figure 4(c) shows a relatively large pore (a couple of micrometers in size) in the ion-polished specimen. Numerous carbon nanoparticles of ≈20–100 nm are formed on the inner wall of this pore during the solidification process. The rapidity of the solidification process after the e-beam melting likely caused the relatively uniform size and homogeneous distribution of these carbon nanoparticles. Figure 4(d) clearly reveals the unique ripple-shaped feature on the ion-polished surface. These characteristic features of CuCv revealed by HIM are invisible by regular SEM.
HIM micrographs of e-beam melted CuCv4 showing (a) graphitic carbon flakes on fracture surface, (b) nanoparticles on fracture surface, (c) nanoparticles on the inner surface of a pore in ion-polished surface, and (d) ripple structure on ion-polished surface, and I–V curves of electron-beam melted (e) control CuCv0, and (f) nanocarbon-infused CuCv4.

These graphitic carbon flakes and nanoparticles that we observed inside the CuCv4 materials are substantially smaller than those graphitic carbon flakes observed on the as-solidified surface of CuCv4. During the e-beam melting process, graphitic carbon pieces in the molten fluid of copper broke up into smaller pieces and nanoparticles under the influence of high-energy electron beam that was directed at the top surface of molten copper. These sufficiently small size (smaller than a couple of hundred nanometers) of graphitic carbon pieces and nanoparticles get infused and stay in the molten copper, while those larger size (greater than a few hundred nanometers) graphitic carbon pieces gradually moved to the top surface due to their low density compared with copper. When those larger pieces of graphitic carbon were hit by the injecting electron beam, they are further smashed and crashed into smaller fragments and bought back in the molten copper by the current of electron beam. Repetitive melting and prolonged processing are beneficial to making covetic materials of better uniformity and with optimal load and infusion of carbon nanostructures.
The I–V curves measured with small rectangular bar specimens produced from CuCv0 and CuCv4 melted nuggets are shown in Figs. 4(e) and 4(f), respectively. Specimen temperature was closely monitored during testing, and the variation was <0.2 °C. For each test, five current levels ranging from 10 to 50 mA were applied to the specimen using a Keithley 6221 current source, and the corresponding voltages were measured by a Keithley 2182A Nanovoltmeter operated in the delta mode. As apparent in Figs. 4(e) and 4(f), the I–V curves exhibit excellent linear dependence of voltage on the applied current for both CuCv0 and CuCv4 samples. The slope of the I–V curves (V/I) was determined from the least-square fitting to the measured data, and the fit is shown in Figs. 4(e) and 4(f) as a solid line. The apparent resistivity was calculated from the following equation,
 $$\rho = \displaystyle{A \over {d_{{\rm vv}}}}\cdot R,$$
where A is the cross-sectional area of the specimen being tested, d vv is the separation of the voltage leads, and R(t) is the specimen resistance, which is determined from the slope of the I–V curve measured at test temperature t. For easy comparison, the resistance at 20 °C is calculated from the following formula,[16]
 $$R({\rm 2}0) = R(t)/[{\rm 1} + \alpha _{{\rm 2}0}\cdot (t - {\rm 2}0)],$$
where α 20 = 0.00393/°C is the temperature coefficient of resistance of copper. The measured resistivities at 20 °C for CuCv0 and CuCv4 samples using Eqs. (1) and (2) are listed in Table II as apparent resistivities ρapp (in μΩ·cm). The apparent conductivities (in MS/m) were calculated from the relationship σ app = 100/ρapp, when taking into consideration the difference in units.
Electrical conductivities of the control sample CuCv0 and the nanocarbon-infused CuCv4 measured at room temperature using thin bar specimens.

a d vv stands for the distance between voltage leads during four-probe IV testing.
These measured conductivities are referred to as “apparent” values due to the fact that the specimens are not fully dense. The effect of porosity must be taken into consideration for comparing the electrical conductivities of samples being investigated. For a material with a given volumetric porosity p, the volume fraction taken up by the material is (1–p), and the relationship between apparent conductivity and the true conductivity follows Archie's empirical formula,[Reference Archie18–Reference Boitsov, Chernyshev and Skorokhod20]
 $$\sigma ^{{\rm app}} = \sigma ^0\cdot ({\rm 1}-p)^m,$$
where σ app and σ 0 are the apparent conductivity and the true conductivity, respectively; p is the porosity of the material being tested; and m is the Archie exponent constant, which is a material-specific parameter. The m was reported to be ≈1.5 for ceramic ionic conductors[Reference El Khal, Cordier, Batis, Siebert, Georges and Steil19] and ≈1.9 for three-dimensional porous bulk metals/alloys.[Reference Boitsov, Chernyshev and Skorokhod20] Fitting the literature data[Reference Grootenhuis, Powell and Tye21] to Archie's empirical formula, we found that m is ≈2.2 for porous copper and copper alloys. Therefore, the true conductivity of the CuCv can be calculated from the measured apparent conductivity and porosity of the material using the following formula for copper alloys,
 $$\sigma ^0 = \sigma ^{{\rm app}}/({\rm 1}-p)^m,{\rm} m = {\rm 2}.{\rm 2}{\rm.} $$
As listed in Table II, the true electrical conductivities of e-beam melted CuCv0 and CuCv4 are 100.5% and 107.4% IACS (International Annealed Copper Standard), respectively. As expected, the control CuCv0 sample displayed a true electrical conductivity that is the same as the textbook value for annealed copper.[17, Reference Archie18] But the CuCv4 sample, covetic copper with 0.4% nanocarbon infusion produced by e-beam melting, exhibits a true electrical conductivity about 7% higher than that of the control CuCv0. The enhancement in electrical conductivity in CuCv4 is likely due to the covetic conversion and formation of carbon covetic networks.[Reference Ma, Balachandran, Wang, Wen, Dorris, Lee and Rondinone15] It is worth noting that the true electrical conductivity of CuCv4 is comparable to that of silver, which is the highest among all metallic materials. From a different point of view, if we make the CuCv4 material fully dense, it would have nearly the same volume-specific current-carrying capacity but ≈15% lower gravimetric density compared with very expensive silver. This observation and technical breakthrough could have significant implication for various energy-saving applications, from microelectronics to high-power electrical transmission cables.
In summary, we prepared CuCv4 (covetic copper with 0.4 wt% carbon infusion) by e-beam melting. A control sample (copper without carbon addition), CuCv0, was also prepared by the same processing conditions. The bulk densities of the CuCv0 and CuCv4 melts were determined by Archimedes’ principle. The measured density values were 8.86 and 8.53 g/cm3, which correspond to relative densities of 98.9% and 96.4% for the CuCv0 and CuCv4 samples, respectively. Microstructural SEM and HIM analysis of the as-solidified surface, fracture surface, and ion-polished surface of the CuCv4 revealed that loosely bonded graphitic carbon is covering the as-solidified surface, while submicrometer-sized graphitic carbon flakes, carbon nanoparticles (10–100 nm in size), and clusters/bands exist in the fracture surface and ion-polished surface. The electrical resistance of thin bar specimens of CuCv0 and CuCv4 was determined by four-probe method at room temperature, and then converted to 20 °C values for easy comparison following the ASTM B193 standard. Apparent electrical conductivities of 56.88 and 57.5 MS/m were measured for CuCv0 and CuCv4, respectively, which correspond to 98.1% and 99.1% IACS, respectively. After taking into consideration of their porosities, we determined true electrical conductivities of 100.5% and 107.4% IACS for the CuCv0 and CuCv4 samples, respectively. Our results demonstrate that the CuCv4 sample produced by e-beam melting exhibits a true electrical conductivity that is ≈7% higher than that of annealed copper. This conductivity value is virtually the same as that of silver, which exhibits the highest electrical conductivity among all metals. This new discovery can have a significant impact on the next generation conductors for energy applications.
Acknowledgment
The authors would like to thank Ms. J. Wang, Dr. J. Wen, Mr. B. L. Fisher, and Dr. R. E. Koritala in the Nanoscience and Technology Division, Ms. S. J. Lopykinski and Dr. D. G. Graczyk in the Chemical and Fuel Cycle Technology Division at Argonne National Laboratory for their technical assistance and discussion. This work was supported by the US Department of Energy (DOE), Energy Efficiency and Renewable Energy, Advanced Manufacturing Office, under Contract No. DE-AC02-06CH11357. Use of the Center for Nanoscale Materials, an Office of Science user facility, was supported by the US Department of Energy, Office of Science, Office of Basic Energy Sciences, under Contract No. DE-AC02-06CH11357. Helium ion microscopy was conducted at the Center for Nanophase Materials Sciences at Oak Ridge National Laboratory, which is a DOE Office of Science User Facility. The submitted manuscript has been created by UChicago Argonne, LLC, Operator of Argonne National Laboratory (“Argonne”). Argonne, a US Department of Energy Office of Science laboratory, is operated under Contract No. DE-AC02-06CH11357. The US Government retains for itself, and others acting on its behalf, a paid-up non-exclusive, irrevocable worldwide license in said article to reproduce, prepare derivative works, distribute copies to the public, and perform publicly and display publicly, by or on behalf of the Government.