Introduction
According to Dragani et al. (Reference Dragani, Drabble, D’Onofrio and Mazio2004), the first observations of the sea levels at Deception Island were made in 1991. Tidal data were obtained over four days in summer by a visual tide staff located near the Decepción Station (Argentina) geodetic benchmark (BARG). This geodetic benchmark, belonging to the Deception Island geodetic network (REGID), was used as the vertical and horizontal datum. Based on these tidal data, an orthometric height value of 2.547 m for the BARG was calculated. This orthometric level was translated by geometric levelling to the point LN00, the fundamental point of the levelling network of Deception Island (RENID); the mean sea level obtained relative to LN00 was 5.430 m. Later, Vidal et al. (Reference Vidal, Berrocoso and Fernández-Ros2012) calculated mean sea levels (MSLs) with respect to vertices of the REGID corresponding to tidal data registered during three months in the 2007–08 Antarctic campaign at DECMAR (Deception Island) and LIVMAR (Livingston Island) stations. The results of new tidal observations for two years on Deception and Livingston islands are presented here.
Instrumentation and data
Data were obtained using two moorings, each with a SAIV TD304 bottom pressure sensor at points near the coast, obtaining average local values of depth of the tide gauge of 3.147 m at Deception Island and 7.475 m at Livingston Island. The tidal observations at DECMAR and LIVMAR stations were made between February 2011 and April 2013.
Pressure (P), temperature (T) and conductivity (C) data were recorded at the stations with a CTD SAIV SD 204 sensor that has an accuracy of±0.02 ppt for salinity, S, (derived from P, T and C) and±0.01ºC for T. Additionally, AQUAlogger 520 PT were used. These sensors have an accuracy of±0.05°C for T and 0.005% of full scale (10 m) for P. The geometric levelling was made using a Leica model NA2 optical level with an accuracy of±0.7 mm for one kilometre double run levelling. The GPS data for positioning of benchmarks and stations were taken from Vidal et al. (Reference Vidal, Berrocoso and Fernández-Ros2012). The gravimetric observations were made with a LaCoste & Romberg model D-203 relative gravimeter.
Methodology
To convert hydrostatic pressure into a sea level equivalent height P=P a +ρgh was used, where P is the pressure registered by the sensor of the tide gauge, P a is the atmospheric pressure, g is the acceleration due to gravity (average value calculated for Deception Island is 9.822083 m s-2) and ρ the density of the water in the study area, calculated using the records of T and S.
Vidal et al. (Reference Vidal, Berrocoso and Fernández-Ros2012) used a constant reference value of 990.8 mb (hPa) as P a which corresponds to the average value of P a in the region during the period 1978–89 (Rakusa-Suszczewski et al. Reference Rakusa-Suszczewski, Mietus and Piasecki1992). The sea level for any particular time can be corrected by adding or subtracting the changes caused by P a changes on the reference values: at low enough frequency the correction is c. -1 cm of sea surface height for every +1 mb (hPa) of P a (Chelton & Enfield Reference Chelton and Enfield1986). For this study, records of P a were taken concurrently with the tidal measurements, obtaining average values of 988.39 mb at Deception Island and 987.27 mb at Livingston Island.
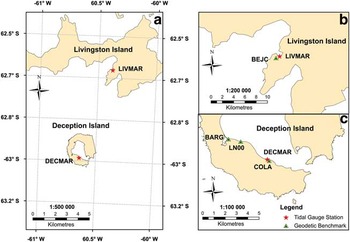
Sea level measurements were linked to fixed onshore benchmarks by comparing simultaneous readings of the gauges against a previously levelled shore-based tidal staff. Using precise geodetic levelling, the height of tide gauge benchmarks (TGBM) were calculated relative to the height of nearby geodetic stations, COLA (Deception Island) and BEJC (Livingston Island) (Fig. 1). Both geodetic stations have absolute coordinates in X, Y, Z and ellipsoidal height (h) relative to ITRF2000 (Berrocoso et al. Reference Berrocoso, Enríquez De Salamanca, Ramírez, Fernández-Ros and Jigena2007).
Location of tidal station. b. Detailed map of Livingston Island showing the location of LIVMAR and BEJ1. c. Detailed map of Deception Island showing the location of DECMAR, COLA, LN00 and BARG.

The instantaneous MSL measurements with visual tide staff were only carried out on days with no wind or waves (calm sea) for 1 hour with 10 minutes sampling. For DECMAR station, a total of seven days and 59 measurements distributed during the sea level recording period were acquired. The same procedure was followed for LIVMAR, with controls during three days with a total of ten measurements.
The gravimetric connection between the South American continent and the South Shetland Islands, was taken from Berrocoso et al. (Reference Berrocoso, Enríquez De Salamanca, Ramírez, Fernández-Ros and Jigena2007). The orthometric heights (H) may be calculated from the ellipsoid height (h) obtained from the GPS measures, absolute gravity measures (g) and the geometric levelling differences (Λn), (Berrocoso et al. Reference Berrocoso, Garate, Martín-Dávila, Fernandez-Ros, Jigena and Moreu1996, Reference Berrocoso, Enríquez De Salamanca, Ramírez, Fernández-Ros and Jigena2007).
Results
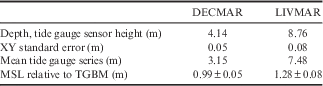
Table I shows the overall linear fit between the visual measurements and the bottom pressure gauge data at DECMAR and LIVMAR, having obtained centimetre accuracy and a very good linear correlation in the correction.
Results of linear fit between instantaneous measurements of sea level at DECMAR and LIVMAR. Depth measured by tide gauge, height measured with visual tide staff and optical level relative to tide gauge benchmark (TGBM).
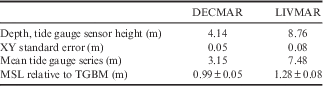
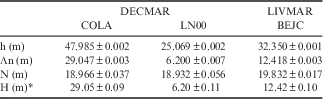
Table II shows the relationship of the tide gauges with respect to the benchmark geodetic vertices. The orthometric heights (H) are indicated and the undulation of the geoid (N) are calculated for Livingston Island (BEJC) and for Deception Island (COLA and LN00). The MSL at geodetic reference stations are also shown.
Results obtained from geodetic benchmarks used at DECMAR and LIVMAR. Mean sea level (MSL) in metres referenced to tide gauge benchmark (TGBM).
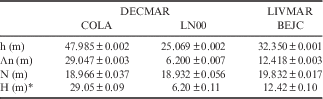
h=ellipsoid height, Λn=geometric levelling differences, N=undulation of the geoid, H=orthometric height.
*Calculated value for the H error (σH) includes the MSL error.
Discussion
The achievement of this work with respect to the results of Vidal et al. (Reference Vidal, Berrocoso and Fernández-Ros2012) can be summarized as follows: i) the MSL was calculated based on a long-term time series (more than two years of records), versus the seasonal series of only three months of records, ii) the orthometric height of the geodetic reference benchmarks were obtained and a new, more accurate orthometric height is provided for geodetic vertex LN00, iii) more accurate values were obtained for the reference benchmarks, the difference being +0.06 m for BEJC and +0.20 m for COLA relative to values in Vidal et al. (Reference Vidal, Berrocoso and Fernández-Ros2012).
Acknowledgements
This work was made possible by the support of the following projects: CGL2007-28768-E/ANT, CTM2008-03113-E/ANT and CTM2009-07251/ANT of the Spanish Ministry of Science and Innovation.
Author contribution
Research design: MBD, JVP, BJA. Data collection (participating in the Spanish Antarctic campaigns 2009–10, 2010–11, 2011–12, 2012–13): BJA, JVP, MBD. Data processing and manuscript preparation: BJA, JVP, MBD.