FOCUS POINTS
• Several forms of dementia and pre-dementia exist, and growing evidence indicates that the underlying pathophysiological processes begin long before clinical symptoms are manifested.
• CSF protein biomarkers have proven useful in the diagnosis of dementia and mild cognitive impairment, but each has its limitations.
• Neuroimaging with anatomical MRI, FDG-PET, and perfusion SPECT have proven useful in the diagnosis of dementia and mild cognitive impairment, but each modality has its limitations.
• Amyloid imaging markers, while intriguing, have significant limitations—relatively low specificity and high cost being important factors.
• In the worldwide medical arena, the cost of diagnostic tools will become a limiting factor as the population affected by dementia swells dramatically, requiring economical diagnostic strategies with acceptable, albeit imperfect, levels of accuracy.
Introduction
The world is aging. Between 1997 and 2025, the number of individuals worldwide over 65 years of age will increase from 381 million to 823 million.Reference Cummings1 In the United States alone, the over-65 population will swell from 35 million to 65 million.Reference Ferri, Prince and Brayne2 Moreover, those over 85 years old will increase at a disproportionate rate. Age-related conditions can be expected to increase in frequency as the population ages. In particular, the dementias, such as Alzheimer's disease (AD), frontotemporal dementia (FTD), dementia with Lewy bodies (DLB), vascular dementia (VaD), and other stroke-related disorders, will increase in frequency, and those afflicted will place increasing demands on medical systems and on families. The frequency of dementias doubles with every 5 years of age over 60. Roughly 1% of 60-year-olds manifest a dementing disorder, while 2% of those 65–70 years, 8% of those 75–79 years, 16% of those 80–84 years, and more than 30% of those over age 85 will develop some form of dementia.Reference Jorm3 Without effective treatment, the number of persons with dementing illnesses will quadruple in the next 50 years. Worldwide, an estimated 81 million people will have some form of dementia.Reference Ferri, Prince and Brayne2 The number of people with AD in the United States alone, currently approximately 5 million, is expected to exceed 13 million by 2050.Reference Hebert, Scherr, Bienias, Bennett and Evans4 Furthermore, roughly 19% of those over the age of 65 years develop mild cognitive impairment (MCI; see below), a potential precursor to a dementia. If this percentage holds over the next 15 years, then approximately 156 million persons worldwide will be affected by MCI.
Over the last 20 years, researchers and clinicians have evaluated large numbers of patients using functional brain imaging for the differential diagnosis of dementia. An accumulated database of thousands of patients with clinically diagnosed, and several hundred patients with pathologically confirmed, AD from many independent, international sites has yielded consistent patterns in brain function abnormalities. Imaging of regional brain activity either directly with 18F-fluoro-deoxyglucose positron emission tomography (PET) or indirectly using perfusion PET or perfusion single photon emission computer tomography (SPECT) has provided consistent neuroimaging findings.Reference Small5–Reference Silverman10 Multiple recent studies have demonstrated the discriminative power of functional neuroimaging among the various etiologies of dementia.Reference Small5, Reference Bonte, Weiner, Bigio and White8, Reference Villemagne, Ong and Mulligan11–Reference Lim, Katsifis and Villemagne15 Moreover, early changes in brain function can now be consistently detected in patients with MCI,Reference Silverman, Small and Chang6, 7, Reference Bohnen, Djang, Herholz, Anzai and Minoshima12, Reference Nobili, Frisoni and Portet16 and evidence supports that MCI destined to progress to AD can be differentiated from MCI that will progress to FTD.Reference Silverman, Small and Chang6, 13, Reference Foster, Heidebrink and Clark14, Reference Rowe and Villemagne17–Reference Miller, Cummings and Villanueva-Meyer20 The possibility of even projecting duration of survival now exists.Reference Villemagne, Pike and Chetelat21 In the course of this review, evidence will be presented that, in fact, neuroimaging may be able to predict the trajectory of dementia from early stages of MCI.Reference Jack, Wiste and Vemuri22
The clinical evaluation of dementia without the use of neuroimaging or other diagnostic modalities is of limited utility. Conditions, such as hypothyroidism, alcoholism, severe vitamin B deficiency, normal-pressure hydrocephalus, and subdural hematoma need to be excluded, although these account for only a small fraction of patients presenting with cognitive problems. Depression in the elderly can often present with cognitive deficits. The correlation between the clinical diagnosis of AD and autopsy-confirmed pathology of AD ranges from 75–90%.Reference Kantarci and Jack23 Sensitivity of clinical diagnosis of AD ranges from 76–98%. and specificity ranges from 61–84% in the research setting but falls considerably in the community setting.Reference Kantarci and Jack23 Neuroimaging and protein biomarkers can greatly enhance diagnostic accuracy. Herein, the dementias will be defined based on the pathology and clinical presentation. Diagnostic testing, including protein markers and neuroimaging, will be reviewed with attention to relative sensitivity and specificity.
The Dementias
Alzheimer's disease
Alzheimer's disease (AD) accounts for 60–70% of the cases of dementia in the aged.Reference Cummings1, Reference Hebert, Scherr, Bienias, Bennett and Evans4 AD leads to death on average within 8 years of diagnosis and is the number-one cause of institutionalization of the elderly in industrialized nations. The definitive diagnosis of AD is made at autopsy, based on the findings of amyloid plaques, neurofibrillary tangles, and neuronal degeneration.Reference Cummings1, Reference Mistur, Mosconi and Santi24–Reference Samuels and Grossman26 While AD is described as a distinct diagnostic entity, its neuropathology suggests multiple overlapping etiologies. Amyloid plaques, the principal neuropathological finding in AD, are composed of a central core of amyloid protein bounded by abnormal neurites containing paired helical filaments, apolipoprotein E, astrocytes, and microglia.Reference Jellinger and Bancher27–Reference Mirra, Heyman and McKeel29 However, amyloid also can be found in diffuse plaques.Reference Rozemuller, Stam and Eikelenboom30, Reference Le, Crook, Hardy and Dickson31 Tangles of neurofibrillary proteins are variably present.Reference Jellinger and Bancher27, Reference Price, Davis, Morris and White28 Neurofibrillary tangles (NFT) are composed of phosphorylated tau proteins in paired helical filaments. Tau protein normally functions to stabilize the microtubule scaffolding of neurons; however when hyperphosphorylated, tau binds to itself, forming large aggregates that eventually fill the neuronal cell body and kill the neuron. These tangles are most often found in the large cholinergic neurons of the basal nucleus of Meynert and the large pyramidal projection neurons of the entorhinal cortex.Reference Cummings1 Growing insights into the molecular biology of these pathological processes are leading to new clues to imaging and diagnosing AD.
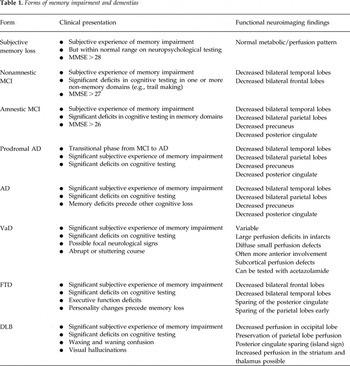
At this point, the diagnosis of AD is largely based on clinical and neuropsychological criteria, such as a Mini-Mental Status Examination (MMSE) score of less than 24, which have incomplete correlation with the disease.Reference Cummings1, Reference Silverman10 The current diagnostic criteria are based on clinical criteria only as established by the NINCDS-ADRDA Work Group in 1984 under the auspices of the U.S. Health and Human Services Task Force on Alzheimer's disease,Reference McKhann, Drachman and Folstein32 but recent efforts are moving toward refining these diagnostic criteria to include molecular and neuroimaging markers.Reference Dubois, Feldman and Jacova33 The clinical diagnosis is graded based on level of certainty. A “definite” diagnosis of AD requires histological confirmation, either by biopsy or autopsy. A “probable” diagnosis of AD is based on typical clinical symptoms without histological confirmation. A “possible” diagnosis is offered when there are atypical features, but no alternative diagnosis is apparent. This latter diagnosis can often be intertwined with other forms of dementia described below. The American Academy of Neurology has established diagnostic criteria, but have found a sensitivity of only 49–63% by clinical criteria.Reference Knopman, DeKosky and Cummings34 Jagust etal.Reference Jagust, Reed, Mungas, Ellis and DeCarli35 reported on a historical cohort defined by clinical diagnostic criteria that were followed to autopsy. Clinical diagnosis had a sensitivity of 76% and a specificity of 58% for the histologically confirmed AD. The classic findings in AD with functional neuroimaging are decreased perfusion or metabolism in the medial temporal lobes, parietal cortex, and the posterior cingulate gyrus and precuneus, which can differentiate it from FTD and other dementias (see Table 1).
Forms of memory impairment and dementias

Roughly 10% of AD cases can be directly attributed to autosomal dominant, early-onset familial genetic disorders,Reference Mistur, Mosconi and Santi24 specifically in the DNA sequence coding for the enzyme that cleaves the amyloid precursor protein presenilin (chromosome 14) or for the amyloid precursor protein itself (chromosome 21).Reference Hardy36 A more common genetic risk factor for AD is a mutation of the ApoE gene on chromosome 19. Two alleles of the ApoE4 gene accelerate the onset of AD by approximately 20 years and increases the risk of AD by 16-fold.Reference Kim, Basak and Holtzman37 Genetic testing will be an important part of the diagnostic evaluation of dementia or MCI, but only to assess risk, not to differentiate one form from the other.
Vascular dementia
Vascular dementia (VaD) is a general term for dementing illnesses resulting from multivessel disease or ischemic brain injury.Reference Camargo9, Reference Ravona-Springer, Davidson and Noy38–Reference Hanyu, Shimuzu and Tanaka40 VaD accounts for up to 20% of all dementias. VaD is strongly associated with cardiovascular disease. Whether presenting with sudden onset after an initial stroke or in a gradual manner due to multiple microvascular infarcts, VaD can progress to profound cognitive impairment. By the very nature of the pathology, the symptoms can be highly divergent with a range of neurological signs depending on the particular vessel involved. Frequently, focal neurological signs are present, particularly in multi-infarct dementia. However, diffuse white matter ischemic injury due to microvascular disease (Binswanger's disease) can lack localizing signs. Clinical clues to VaD as the etiology of dementia in a given patient include abrupt onset, fluctuating course, cardiovascular risk factors, smoking history, hypertension, focal neurological signs, and a stepwise progression; however, the situation is not entirely simple (Table 1). On the one hand, there are some neuroimaging data to suggest that different types of vascular dementia can be distinguished by functional brain imaging; on the other hand, a growing body of evidence suggests that AD and vascular dementia frequently coexist and may share common etiological factors.Reference Camargo9, Reference Ravona-Springer, Davidson and Noy38–Reference Hanyu, Shimuzu and Tanaka40 Functional brain imaging in VaD is characterized by the diversity of appearance, ranging from evidence of a single large stroke to an array of small focal defects. There is a tendency for diffuse focal perfusion defects to have a more anterior distribution in VaD, but this is by no means absolute.
Frontotemporal dementia
FTD is predominately a disease of the frontal lobes in which areas of judgment, personality, social comportment, and language are more severely affected, while memory function is relatively spared until later in the disease course.Reference Cummings1, Reference Talbot, Goulding and Lloyd41, Reference Tranfaglia, Palumbo, Siepi, Sinzinger and Parnetti42 FTD accounts for roughly 10% of dementia cases, often with an earlier onset than that seen with AD. In the 40- to 65-year-old age group, it can represent 50% of the cases of dementia.Reference Cummings1 There is a genetic component.Reference Cummings1, Reference Kantarci and Jack23 FTD is, in fact, a number of pathological entities, including Pick's disease, tau-positive pathologies, tau-negative pathologies, AD-like pathologies, and cases lacking a distinct histopathology. Pick's disease is characterized by spherical aggregates of hyperphosphorylated tau proteins, known as Pick's bodies.Reference Pickering-Brown, Baker and Nonaka43, Reference Bronner, ter Meulen and Azmani44 These pathological aggregates are found in the dentate gyrus, CA1 pyramidal cells, subiculum, and frontal neocortex. They can also be found in high concentration in the caudate, dorsomedial putamen, and globus pallidus. Other forms of FTD with tau-positive pathology include corticobasal degeneration and progressive supranuclear palsy. Tau-negative forms of FTD often are associated with motor neuron degeneration and are typically positive for ubiquitin. Two familial forms of FTD have been substantiatedReference Mistur, Mosconi and Santi24—a tau-positive dementia with Parkinsonian symptoms derived from a mutation in chromosome 17 and a tau-negative dementia with ubiquitin-positive neuronal inclusions derived from a mutation also found on chromosome 17.
FTD typically presents clinically with personality changes preceding memory dysfunction. Frontal lobe dysfunction can be manifested as amotivation and apathy or, conversely, as disinhibition and impulsivity. Executive function becomes impaired and/or language impairment occurs. Patients can experience aphasia, in which case they tend to manifest predominantly temporal lobe abnormalities, such as anterolateral hypoperfusion or decreased metabolism.Reference Cummings1, 13, Reference Foster, Heidebrink and Clark14, Reference Mistur, Mosconi and Santi24, Reference McKhann, Drachman and Folstein32 Patients with disinhibition tend to show inferior frontal lobe abnormalities, but perform relatively normally on tests of executive function.Reference Cummings1, Reference Small5, Reference Camargo9, 13, Reference Foster, Heidebrink and Clark14, Reference Mistur, Mosconi and Santi24, Reference McKhann, Drachman and Folstein32 Patients with apathy tend to manifest dorsolateral frontal or medial frontal abnormalities and have greater difficulty on executive function tests (Table 1). Right-sided and left-sided FTD can be differentiated in some cases with neuropsychological testing, but it is often best demonstrated with metabolic or perfusion functional neuroimaging (see Table 1).Reference Small5, Reference Camargo9, Reference Foster, Heidebrink and Clark14, Reference Talbot, Goulding and Lloyd41
Dementia with Lewy bodies
Dementia with Lewy bodies (DLB) is characterized pathologically by the accumulation of Lewy bodies. These pathological aggregates occur in a number of diseases, including Parkinson's disease, multiple system atrophy, and sporadically in AD. Alpha synuclein is the principal protein found in Lewy bodies.Reference Cummings1, Reference Tateno, Kobayashi and Saito45 Normally a soluble protein, alpha synuclein can form complex aggregates when phosphorylated. Lewy bodies are typically found in the neocortex, most often primary sensory cortices, and the substantia nigra. DLB is clinically characterized by memory impairment, impaired judgment, waxing and waning confusion, visual hallucinations, and Parkinsonian symptoms. Functional brain imaging most often reveals decreased perfusion or metabolism in the primary visual cortex.Reference Tateno, Kobayashi and Saito45, Reference Tateno, Kobayashi and Shirasaka46 There are also reports of increased perfusion or metabolism in the striatum and thalamus (see Table 1). Dopamine transporter studies demonstrate decreased dopamine transporter uptake in the basal ganglia. Recently, I123-metaiodobenzylguanidine (MIBG) imaging has revealed decreased sympathetic innervations of the heart in cases of DLB. Decreased cardiac MIBG uptake has proven to be a highly effective tool for differentiating DLB from AD. In recent studies, 96% of cases of DLB had decreased cardiac MIBG uptake,Reference Tateno, Kobayashi and Shirasaka46, Reference Yoshita, Taki and Yokoyama47 while this finding is negative in AD (although 90% of Parkinson's disease patients can also be positive for this findingReference Tateno, Sakakibara and Kishi48).
Dementia pugilistica
Dementia pugilistica or chronic traumatic encephalopathy (CTE) is found in patients exposed to repeated traumatic head injury. CTE can occur as the result of a single severe brain injury or, more commonly, from repetitive brain trauma. It was first recognized in boxers, but has now been diagnosed in American football players and others undergoing repeated blows to the head. CTE is characterized clinically by a range of symptoms, including memory impairment, behavioral and personality changes, speech abnormalities, and Parkinsonian symptoms, including gait disturbances. Depression may be an early symptom of CTE or simply co-occurring in persons experiencing repetitive head injury.Reference Fann, Burington and Leonetti49 For example, 11% of retired American football players reported diagnosis of depression, and the likelihood of depression increased with increased number of concussions during the football career.Reference Guskiewicz, Marshall and Bailes50 Similarly, the incidence of diagnosis of MCI was correlated with a history of 3 or more concussions.Reference Guskiewicz, Marshall and Bailes51 CTE is characterized pathologically by tau-positive NFT and tau-positive threads throughout the cerebral corticesReference McKee, Cantu and Nowinski52–Reference Omalu, DeKosky and Hamilton54 Amyloid plaques, Lewy bodies, and cerebrovascular amyloid accumulations are largely absent.Reference McKee, Cantu and Nowinski52, Reference Omalu, DeKosky and Hamilton54 Two series of cases and a smattering of case reports exist concerning the neuropathological findings in professional American football players with early onset cognitive impairment. Retired National Football League players who experience depression and cognitive impairment have revealed tau-positive neuropathology as described above.Reference McKee, Cantu and Nowinski52–Reference Omalu, DeKosky and Minster55 At least two cases had known ApoE genotype and were not at increased risk for AD. A recent survey of retired National Football League players revealed that retired players under the age of 50 were 19 times more likely to be diagnosed with dementia than the general public.56 Repetitive head trauma or repetitive concussions, even in the presence of protective gear, appears to carry significant risk for early-onset dementia, with neuropathological findings evident in football players in their 20 s and 30 s.
Neuroimaging studies of repetitive concussive injury in American football players has revealed diffuse cortical hypoperfusion often with extensive involvement of the frontal and anterior temporal lobes.57, Reference Amen, Newberg and Thatcher58 It would be expected that amyloid imaging markers (see below) would be negative due to the absence of amyloid in the CTE neuropathology.
Mild cognitive impairment
Mild cognitive impairment (MCI) is an early cognitive decline that can potentially progress to AD or other dementias. MCI presents in approximately 19% of persons 60–75 years old and in approximately 29% of those over 85 years of age.Reference Lopez, Jagust and DeKosky59 MCI can be divided into stable, declining, and amnestic MCI. Approximately 30% of MCI patients have amnestic MCI, characterized by memory impairment on neuropsychological testing, but no significant change in MMSE score.Reference Nobili, Frisoni and Portet16 Current estimates are that 12% of patients with amnestic MCI progress to AD each year.Reference Petersen60 Recent studies have shown that 35% progress to AD in 5 years,Reference Bennett, Wilson and Schneider61, Reference Boyle, Wilson, Aggarwal, Tang and Bennett62 but some estimates are that as many as 80% of amnestic MCI cases progress to AD in 6 years.Reference Petersen60
Notably, it is now evident that the pathological process of AD begins years before the onset of clinical symptoms.Reference Trojanowski, Vandeerstichele and Korecka63 Earlier intervention in this process is far more likely to be effective due to the smaller burden of amyloid and hyperphosphorylated tau proteins. Moreover, earlier intervention may precede or truncate the downstream events, such as inflammation, oxidative stress, and apoptosis.Reference Trojanowski, Vandeerstichele and Korecka63–Reference Jack, Knopman and Jagust65 Herein lies the benefit of neuroimaging, which has shown the potential to differentiate and provide prognostic clues about the different forms of MCI (see Table 1 and below). Forthwith, the relative diagnostic potential of cerebrospinal fluid (CSF) markers and neuroimaging markers will be considered.
CSF Proteins and the Diagnosis of Dementias and MCI
Cerebrospinal fluid (CSF) bathes and cushions the brain. It is in direct contact with the brain, and, as a result, proteins that accumulate or are released as a result of pathological processes in the brain are likely to appear in the CSF. Extensive research has focused on identifying and characterizing CSF markers in AD. This work is reviewed in several excellent articles.Reference Fagan and Holtzman66–Reference Blennow and Hampel71 One marker that has received considerable attention is tau protein, a critical component of AD pathology. Total tau protein CSF level is a nonspecific marker for neuronal and axonal degeneration. Over 20 studies with more than 3,000 subjects have evaluated total tau protein CSF levels. Total tau protein CSF levels are increased 300% in AD compared to controls.Reference Blennow and Hampel71, Reference Hertze, Minthon, Zetterberg, Vanmechelen, Blennow and Hansson72 Using a conservative cutoff of >600 pg/mL CSF, total tau protein can be a contributing biomarker to the diagnosis of AD.Reference Humpel73 Unfortunately, total tau protein CSF levels are increased in other dementias,Reference Blennow and Hampel71, Reference Mollenhauer, Bibl and Trenkwalder74, Reference Arai, Morikawa and Higuchi75 following stroke,Reference Hesse, Rosengren and Andreasen76 and as a part of normal aging.Reference Humpel73 Curiously, total tau protein CSF levels are not increased in cases of MRI-defined VaD.Reference Andreasen, Vanmechelen and Van d77
Isoforms of phosphorylated tau protein have proven more specific for AD. In particular P-tau-231 (tau protein phosphorylated at the threonine 231) has proven useful in differentiating AD from FTD, DLB, VaD, and normal controls.Reference Mistur, Mosconi and Santi24, Reference Blennow and Hampel71, Reference Parnetti, Lanari and Amici78, Reference Buerger, Zinkowski and Teipel79 P-tau-231 also distinguishes AD from major depression.Reference Buerger, Zinkowski and Teipel80 P-tau-231 has been correlated with pathological evidence of NFT burden.Reference Buerger, Ewers and Pirttila81 Multiple studies have shown that P-tau-231 can differentiate AD from controls with an average sensitivity of 85% and average specificity of 96%.Reference Blennow and Hampel71 It also distinguishes AD from FTD with a sensitivity of 88% and specificity of 92%.Reference Hampel, Buerger and Zinkowski82 CSF P-tau-231 levels have been correlated longitudinally with hippocampal volume decrease measured using MRI in patients with AD.Reference de Leon, DeSanti and Zinkowski83 While P-tau-231 levels can indicate the presence of AD and help differentiate AD from other causes of dementia,Reference Humpel73 the levels do not reliably increase with clinical progression of AD.Reference Mistur, Mosconi and Santi24
Another useful marker in AD is the major protein component in neuritic plaques, β amyloid. There are several truncated forms of β amyloid. In diffuse plaques, the predominant form of this protein is Aβ-42.Reference Blennow and Hampel71 Decreased levels of this protein have been studied extensively as a marker for AD. Hypothetically, CSF levels of Aβ-42 might be reduced if plaques are acting as sinks for the accumulation of β amyloid, resulting in lower quantities diffusing into the CSF. The levels of CSF Aβ-42 are inversely correlated with amyloid plaque density in the neocortex and hippocampus.Reference Strozyk, Blennow, White and Launer84 Aβ-42 CSF levels are decreased 50% in AD relative to controlsReference Hertze, Minthon, Zetterberg, Vanmechelen, Blennow and Hansson72, Reference Andreasen, Minthon and Vanmechelen85, Reference Hansson, Zetterberg and Buchhave86 and are reliably decreased in MCI.Reference Hertze, Minthon, Zetterberg, Vanmechelen, Blennow and Hansson72 Several studies have found that CSF Aβ-42 levels can distinguish AD from normal controls with a mean sensitivity of 86% and a mean specificity of 89%.Reference Blennow and Hampel71 Decreased Aβ-42 was recently demonstrated to correlate with a faster decline in cognitive function among patients with MCI followed longitudinally.Reference Okonkwo, Mielke and Griffith87 Yet, this marker has several limitations. CSF Aβ-42 levels do not show a reliable decrease with the progression of AD symptoms.Reference Tapiola, Pirttila and Mikkonen88 Levels are also decreased in DLBReference Mollenhauer, Cepek and Bibl89, Reference Andreasen, Minthon and Davidsson90 and in FTD.Reference Kapaki, Paraskevas and Papageorgiou91 Indeed, Aβ-42 levels have been found to be decreased in disorders without β amyloid plaques, such as HIV-associated cognitive impairment,Reference Clifford, Fagan and Holtzman92 amyotrophic lateral sclerosis, multiple system atrophy, and Creutzfeldt–Jakob disease.Reference Blennow and Hampel71 Moreover, decreased CSF Aβ-42 levels can be found in cognitively normal subjects.Reference Fagan, Mintun and Mach93
Neuroinflammation is a key component of AD pathology. Activated neuroglia are found surrounding neuritic plaques. Isoprostane is an isomer of prostaglandins produced by the peroxidation of polyunsaturated fatty acids in the inflammation processReference Pratico94, Reference Montine, Markesbery and Zackert95 and has proven to be an intriguing marker. Isoprostane is increased in MCI and may precede the development of amyloid plaques.Reference Pratico, Clark and Liun96 As MCI progresses to AD, a longitudinal correlation of increased isoprostane can be demonstrated.Reference de Leon, DeSanti and Zinkowski83 Moreover, isoprostane levels are higher in AD than in FTD and other dementias.Reference Montine, Kaye and Montine97–Reference Yao, Zhukareva and Sung99
Given the above limitations of each marker, a combination of CSF markers may prove to be a valuable technique,Reference Trojanowski, Vandeerstichele and Korecka63, Reference Johansson, Mattsson and Hansson100, Reference Maddalena, Papassotiropoulos and Muller-Tillmanns101 particularly when augmenting functional neuroimaging findings.Reference Forlenza, Diniz and Gattaz102 For example, increased P-tau-231 CSF levels are 85% sensitive and 96% specific for AD compared to controls, but when combined with decreased CSF Aβ-42 levels, the sensitivity increased to 86% and the specificity to 97%.Reference Maddalena, Papassotiropoulos and Muller-Tillmanns101 In one series of patients, increased total tau and decreased Aβ-42 level predicted which MCI cases would progress to AD over a period of 4–6 years.Reference Hansson, Zetterberg and Buchhave86 Lastly, increased total tau and decreased Aβ-42 levels were correlated with ApoE allele status and with increased risk of converting from cognitively normal to MCI over a 42-month follow-up period.Reference Li, Sokal and Quinn103
CSF levels of total tau, P-tau-231, and Aβ-42 are generally normal in normal aging, depression, Parkinson's disease, alcohol dementia, and post-stroke.Reference Fagan and Holtzman66, Reference Aluise, Sowell and Butterfield68, Reference Blennow and Hampel71, Reference Hertze, Minthon, Zetterberg, Vanmechelen, Blennow and Hansson72 In acute stroke, total tau levels are increased, but phosphorylated tau levels remain normal. VaD can show mild to marked increase in total tau, but phosphorylated tau levels and amyloid levels are in the normal range.Reference Blennow and Hampel71 FTD is associated with a slight increase in total tau and a moderate decrease in Aβ-42. DLB is associated with mild changes in each of these three markers. In summary, CSF markers are unlikely to stand alone as diagnostic markers to differentiate the dementias. However, in combination with functional neuroimaging, a strong diagnostic and predictive set of markers may be available. An intriguing application may be the early identification of MCI using the combination of functional neuroimaging and CSF isoprostane levels.
Neuroimaging and the Diagnosis of Dementias and MCI
Anatomical Imaging
Anatomical imaging studies such as conventional magnetic resonance imaging (MRI) or computed tomography (CT) have limited usefulness in early dementia, except to rule out alternative diagnoses, such as hemorrhage, unsuspected lesions, or tumors.Reference Silverman10, Reference Atiya, Hyman, Albert and Killiany104 MRI has high resolution, on the order of 1.5 mm. Its strength lies in its ability to provide detailed anatomical information. Multiple studies have documented volumetric changes in the hippocampus and the medial temporal lobe associated with AD.Reference Atiya, Hyman, Albert and Killiany104–Reference Fox, Warrington and Rossor106 Other centers have reported progress in characterizing changes in the frequency of white matter hyperintensities.Reference Capizzano, Acion and Bekinschtein107, 108 However, differentiation of frontotemporal dementia from AD is not possible based on the current knowledge of early anatomical changes,Reference Atiya, Hyman, Albert and Killiany104, Reference Fox, Warrington and Rossor106, Reference Bonte, Harris, Roney and Hynan109 although high resolution MRI volumetric analysis of the hippocampus and entorhinal cortex has yielded interesting results. These areas are affected early in the pathogenesis of AD. Indeed, some layers of the entorhinal cortex lose 40–60% of their neurons prior to the onset of mild memory impairment often associated with MCI. High-resolution MRI studies have shown hippocampal volume loss of 27% in AD relative to elderly controls. An 11% decrease in hippocampal volume has been reported in MCI.Reference Du, Schuff and Amend110 Notably, the entorhinal cortex is more striking. Volumetric analysis revealed entorhinal cortex volume decrease of 39% in AD with an average of 13% reduction in volume in MCI.Reference Du, Schuff and Amend110 Efforts to develop fully automated volumetry have yielded promising preliminary results.Reference Kovacevic, Rafii and Brewer111 There have been some recent studies using crude qualitative Likert-type rating scales to assess medial temporal lobe atrophyReference Duara, Loewenstein and Potter112, Reference DeCarli, Frisoni and Clark113; however, these are of limited value except to propagate the current clinical standard of casual subjective analysis or “eyeballing.” The accuracy of these subjective measures is roughly 57–70%.Reference Whitwell, Przybelski and Weigand114, Reference Nagy, Hindley and Braak115 Volumetrics with statistical comparison to an age-matched control group undoubtedly offers much more diagnostic value.Reference Du, Schuff and Zhu116–Reference Hanggi, Streffer, Jancke and Hock118
Serial MRI studies also are useful for measuring small rates of change associated with AD-related brain atrophy, more often as outcome measures in clinical trials rather than as clinical diagnostic information.Reference Atiya, Hyman, Albert and Killiany104–Reference Fox, Warrington and Rossor106 Voxel-based morphometry of serial MRI scans over a period of years has demonstrated significant atrophy in the hippocampus, entorhinal cortex, and other medial temporal lobe structures.Reference Whitwell, Przybelski and Weigand114 Atrophy appears to follow a progression from the anterior hippocampus and entorhinal cortex to the entire hippocampus, then progressing to inferior and middle temporal gyri and then to the parietal cortex.Reference Whitwell, Przybelski and Weigand114, Reference Du, Schuff and Zhu116, Reference Thompson, Hayashi and Dutton119–Reference Desikan, Sabuncu and Schmansky122 Indeed, the relative loss of entorhinal cortex volume relative to age-matched controls may be a sensitive early indicator of pathology, as it precedes volume loss in other areas including the hippocampus, inferior and middle temporal gyri, posterior cingulate gyrus, and precuneus.Reference Nagy, Hindley and Braak115, Reference Chetelat, Landeau and Eustache121, Reference Desikan, Sabuncu and Schmansky122 Entorhinal cortex volume loss in AD averages 6% per year compared to only 1.43% per year in elderly controls.Reference Du, Schuff and Zhu116 Volume loss in the hippocampus has been more widely studied recently. For example in one study, the hippocampus was 32% smaller in AD and 19% smaller in MCI.Reference Colliot, Chetelat and Chupin120 Hippocampal volumetrics was able to correctly differentiate MCI from elderly controls with a sensitivity of 75% and specificity of 70%. However, Thurfjell etal. recently found extensive overlap in hippocampal volumetrics between AD and elderly controls.Reference Thurfjell, Lotjonen and Lundqvist123 Moreover, it should be noted that hippocampal volume loss also occurs in depression,Reference McKinnon, Yucel, Nazarov and MacQueen124 post-traumatic stress disorder,Reference Bremner125–Reference Woon, Sood and Hedges127 and alcoholism,Reference Hedges and Woon126, Reference Agartz, Momenan, Rawlings, Kerich and Hommer128 which may confound the clinical utility of this measure as a diagnostic tool, as each of these conditions can confound the diagnosis of cognitive decline in the elderly. Unfortunately, even in longitudinal studies, volumetric changes are often relatively smallReference Atiya, Hyman, Albert and Killiany104 or of modest predictive value.Reference Atiya, Hyman, Albert and Killiany104, Reference Rusinek, De and Frid105 For example, a 6-year longitudinal study of atrophy of the medial temporal lobe yielded a sensitivity of 85%, equivalent to clinical evaluation alone, but a modest improvement in specificity.Reference Bonte, Harris, Roney and Hynan109 Functional neuroimaging with either SPECT or PET are yielding much higher levels of sensitivity and specificity.
Molecular imaging
Over the last decade, molecular markers have been under development in an effort to image the specific pathology of AD. Pittsburgh Compound B (PiB) binds to amyloid in a variety of pathological substrates, including diffuse plaques, NFT, and amyloid angiopathy. PiB binding is increased in AD and is most evident in the middle frontal cortex, prefrontal cortex, parietal cortex, temporal cortex, posterior cingulate gyrus, precuneus, and occipital cortex. Increased PiB binding is found in most AD patientsReference Klunk, Mathis, Price, Lopresti and DeKosky129–Reference Pike, Savage and Villemagne131; however, not all AD patients show PiB binding.Reference Cairns, Ikonomovic and Benzinger132 Increased PiB binding is found in 61% of patients with MCI.Reference Mistur, Mosconi and Santi24, Reference Mintun, LaRossa and Sheline133 Unfortunately, increased PiB binding is found in 22% of aged normalsReference Rowe, Ng and Ackermann134 and in 40% of 80-year-old normals.Reference Villemagne, Chetelat, Pike and Rowe135 An in vitro study of PiB binding indicates that it is a nonspecific marker for amyloid.Reference Lockhart, Lamb and Osredkar136 PiB binding is increased in VaDReference Mok, Leung and Chu137 and can be increased in DLB.Reference Gomperts, Rentz and Moran138 Nevertheless, PiB binding is most robust in AD. For example, a recent correlation of in vivo PiB retention to post-mortem amyloid plaque load showed a strong positive correlation.Reference Masters, Villemagne and McLean139 However, it remains likely PiB may be more suited to ruling out AD,Reference Gomperts, Rentz and Moran138 due to its high sensitivity.
Experience with 11C-PIB has advanced considerably, and large sample studies have recently been reported.Reference Villemagne and Rowe14011C-PIB-positive imaging is moderately predictive of progression from MCI to AD. In recent studies, roughly 70% of MCI patients with 11C-PIB retention converted to AD in three years compared to 10% of those MCI patients who were 11C-PIB-negative.Reference Villemagne, Pike and Chetelat21, Reference Okello, Koivunen and Edison141 Subjects with MCI who were negative for this marker tended to progress to non-AD dementia, such as FTD or DLB, at a higher rate of 15% per annum.Reference Villemagne, Chetelat, Pike and Rowe135 In a large study of 11C-PIB labeling changes in healthy elderly controls over 2.5 years, Mintun etal.Reference Mintun, Vlasenko, Sheline and Morris142 followed 129 subjects. Of these, a total of 19 subjects had positive 11C-PIB retention at baseline. At 2.5 years, an additional 8 subjects had become positive for this marker, representing a conversion rate of 2.93% per annum. Based on this, Mintun etal. estimated that the mean duration for conversion from 11C-PIB-positive scan to symptomatic AD is 10.8 years.Reference Mintun, Vlasenko, Sheline and Morris142
11C-PIB is consistently 90% sensitive for AD.Reference Rowe143 However specificity is much lower and worsens significantly with age.Reference Rowe143 Notably, retention of 11C-PIB increases with age in normal controls. Roughly 10% of healthy controls at age 50 years are positive for 11C-PIB. This nonspecific binding increases to 20% of controls at age 60 years and 40% of controls at age 80 years.Reference Rowe, Ng and Ackermann134, Reference Chetelat, Villemagne and Bourgeat144 The presence of 11C-PIB retention in elderly controls predicts the conversion of 14% to MCI in the subsequent 14 months—not a particularly robust finding. Moreover, 11C-PIB retention also is elevated in about 80% of LBD cases, wherein labeling is found in the substantia nigra, entorhinal cortex, anterior cingulate, and temporal lobes.Reference Rowe, Ng and Ackermann134 This finding has been attributed to the higher affinity of 11C-PIB for diffuse amyloid.Reference Lockhart, Lamb and Osredkar136 Nonetheless, the labeling of diffuse versus discrete amyloid plaques cannot be differentiated by scan appearance, which can greatly reduce the specificity of 11C-PIB. While some have suggested that 11C-PIB be considered a “gold standard” for AD, it cannot be considered as such by even the loosest definition of the term, given its low specificity. A further limitation of PiB is that it is an 11C radiopharmaceutical, and as a result of the 20-min radioactive decay half-life of the isotope, it requires an on-site cyclotron. PiB would be difficult to implement in clinical practice outside of a research setting,Reference Rowe and Villemagne17 but it may have use in the testing of anti-amyloid medications. With these limitations in mind, several groups began developing amyloid markers labeled with 18F, which has a 110-min radioactive half-life. Centralized production and regional distribution to clinical facilities is possible with 18F-labeled products.
Currently, four fluorinated amyloid markers are under evaluation in phase II and phase III clinical trials. Two are nearing completion of clinical trials for U.S. Food and Drug Administration (FDA) approval: florbetaben which was initially developed by Bayer HealthCare Pharmaceuticals, Inc. and flutemetamol, which is being developed by GE Healthcare. Florbetapir, which was initially developed by Avid Radiopharmaceuticals and now acquired by Eli Lilly, has recently received FDA approval. Another marker, AZD4694, initially being developed by AstraZeneca, but now under development by Navidea, is currently in phase II trials.
A fifth molecule with promise145 is 2-(1-(6-[(2-[18F]fluoroethyl)(methyl)amino]-2-naphthyl)ethylidene) malononitrile (18F-FDDNP). It was initially under development, reportedly with Siemens. FDDNP binds to Aβ fibrils and NFT with high affinity.Reference Small, Kepe and Ercoli146 FDDNP is inherently fluorescent, and in vitro studies demonstrate specific binding to plaques and NFT in brain tissue from AD patients.Reference Agdeppa, Kepe and Liu147 FDDNP binding is increased in the parietal cortex, temporal cortex, frontal cortex, and posterior cingulate gyrus of patients with AD.Reference Small, Kepe and Ercoli146–Reference Shoghi-Jadid, Small and Agdeppa148 Binding of FDDNP is increased in AD, largely absent in elderly controls, and differentiates MCI with 95% accuracy. It demonstrated a longitudinal progression over 2 years in a small number of cases. A limitation of this tracer is the narrow range of binding variation between controls and AD patients, with only a 5–8% difference, compared to a 17% difference in FDG binding between these groups.145 A recent study correlated FDDNP with 11C-PIB in a small sample of 5 MCI subjects, 3 AD subjects, and 4 controls.Reference Ossenkoppele, Tolboom and Foster-Dingley149 FDDNP has a lower specific binding, but it does show an increase in binding during the progression of the disease. This may prove a unique window of application, since 11C-PIB binding does not accurately track disease progression.Reference Rowe, Ng and Ackermann134, Reference Chetelat, Villemagne and Bourgeat144, Reference Villemagne, Mulligan and Pejoska150, Reference Villemagne, Chetelat and Pike151 Of note, FDDNP has not appeared to progress to later stages of clinical development.
Rowe etal.Reference Rowe, Ackerman and Browne152 in Australia first published on AV-1, also known as florbetaben (or Bayer 94-9172) in 2008. Florbetaben is now under phase II and phase III clinical trials.Reference Villemagne, Ong and Mulligan11, Reference Rowe and Villemagne17, Reference Rowe, Ng and Ackermann134, Reference Villemagne, Chetelat and Pike151, Reference Sabri, Gertz and Dresel153, Reference Ong, Villemagne and Langdon154 Of note, florbetaben was recently acquired from Bayer HealthCare Pharmaceuticals, Inc. by Piramal Healthcare, which plans to submit for FDA approval before the end of 2012. This marker is rapidly metabolized in the liver by O-dialkylation and N-demethylation to polar metabolites. Roughly 60% of the metabolites make it into the brain where the majority binds to white matter (WM) in a diffuse background. Similar to PIB, roughly 20% of control subjects have florbetaben binding at significant levels. Florbetaben is administered as a 250 mBq dose with an 80–90 min waiting period to allow for metabolic conversion and binding. PET scanning for 15 min is a typical protocol.Reference Villemagne, Chetelat, Pike and Rowe135
This marker has a curious pattern of binding in AD, not unlike that of 11C-PIB. Flobetaben is increased throughout the neocortex in AD, except that there is little binding in the medial temporal lobe—a site that shows AD pathology very early in the disease process,Reference Villemagne, Ong and Mulligan11, Reference Villemagne, Mulligan and Pejoska150, Reference Rowe, Ackerman and Browne152 although neurofibrillary tangles, rather than amyloid, tend to predominate in this area.Reference Braak and Braak155 Florbetaben binding is high in the posterior cingulate gyrus, precuneus, and frontal cortex, consistent with Braak and Braak's histopathological findings of amyloid accumulation.Reference Braak and Braak155 Binding is lower in the parietal cortex and temporal cortex and largely absent from the sensorimotor cortex and cerebellar gray matter.Reference Rowe and Villemagne17, Reference Rowe, Ackerman and Browne152–Reference Ong, Villemagne and Langdon154, Reference Seibyl, Barret and Zubal156, Reference Villemagne, Ong and Langdon157 Florbetaben has a smaller dynamic range than 11C-PIBReference Villemagne, Mulligan and Pejoska150 and also differs in that it is more likely to stain discrete amyloid plaques than diffuse amyloid. All 18F-labeled amyloid markers appear to have higher white matter uptake compared to 11C-PIB.
Florbetaben binding was found to be 100% sensitive and 90% specific for AD in a proof-of-concept study.Reference Rowe, Ackerman and Browne152 A more recent study with a larger sample size of 30 patients with AD and using clinical diagnosis as the gold standard found florbetaben to have a 97% sensitivity and an 88% specificity in differentiating AD from elderly controls.Reference Villemagne, Ong and Mulligan11 In a multisite phase II study of 81 probable AD and 69 healthy elderly controls,Reference Barthel, Gertz and Dresel158 visual interpretation of florbetaben scans by three independent trained readers yielded a sensitivity of 80% and a specificity of 91%. When correcting for the assumption of the clinical diagnosis (of 10–30%),Reference Barthel, Gertz and Dresel158, Reference Kukull, Larson and Reifler159 visual interpretation provided a sensitivity of 96% and a specificity of 97%. Using quantitative methods, florbetaben demonstrated a sensitivity of 85% and a specificity of 91% for AD compared to elderly controls.Reference Seibyl, Barret and Zubal156, Reference Barthel, Luthardt and Becker160 The posterior cingulate gyrus appeared to be a region of strong uptake and a hallmark indicator. The discriminative power of the posterior cingulate gyrus in this study was greater than that of the parietal cortex or the frontal cortex.Reference Barthel, Gertz and Dresel158 An ongoing Phase III trial with 40 patients followed to autopsy has shown a sensitivity of 100% and a specificity of 93%.161 Florbetaben imaging was performed on 20 patients with FTD and 7 patients with DLB. AD and FTD could be differentiated with a sensitivity of 97% and a specificity of 91%. As has previously been reported, amyloid binding was mixed in the patients with DLB.Reference Villemagne, Ong and Mulligan11, Reference Rowe, Ng and Ackermann134 FTD patients and elderly controls typically showed no florbetaben binding, other than white matter background.
The role of florbetaben in the evaluation of MCI is still emerging, but this may be an important contribution of amyloid markers.161, Reference Barthel and Sabri162 Rowe and colleaguesReference Villemagne, Chetelat, Pike and Rowe135, Reference Barthel and Sabri162 have that found 53% of patients with MCI (defined in a more progressive fashion as MMSE ≤ 28 and memory impairment in a single domain) are shown to be florbetaben positive. Amnestic MCI cases could be differentiated from non-amnestic cases: 83% of amnestic MCI cases had florbetaben-positive scans, while only 17% of non-amnestic MCI cases had positive scans. In contrast, 96% of patients with AD (defined as MMSE ≤ 23) had positive scans. Current estimates of sensitivity for MCI are 80% and specificity 90% for cases that are strongly florbetaben-positive.Reference Villemagne, Chetelat, Pike and Rowe135, 161
GE Healthcare's flutemetamol is a fluorinated version of 11C-PIB. It is currently in phase III trials. The ongoing longitudinal end-of-life study has 204 subjects. Thirty-one subjects have proceeded to autopsy.163 Flutemetamol had a 100% sensitivity and 92% specificity to pathology. Flutemetamol is administered as a 170 mBq dose with an 80–90 min waiting period. PET scanning over 15 min yields a quality image. One phase II trial included 27 probable AD, 18 amnestic MCI, and 10 normal elderly controls.163 Using quantitative methods, the sensitivity in this small sample was 93% and the specificity was 96% for differentiating AD from controls.Reference Buckley, Thurfjell and Farrar164 Preliminary data suggest that it may have reasonable accuracy in MCI, but the specific results were not reported.
AZD4694 was first described in 2010. It has high affinity for β amyloid in vitro and selectively labels β amyloid in postmortem AD brains.Reference Jureus, Swahn and Sandell165 It demonstrates very high linear correlation to 11C-PIB in initial clinical trials.161 Trials to date have used a 200 MBq bolus with an approximately 30-min waiting period. These parameters will probably evolve with more experience. AZD4694 clearly differentiated AD patients from controls.Reference Cselenyi, Jonhagen and Forsberg166 Early clinical experience demonstrates binding that is very comparable to 11C-PIB in AD and MCI patients and an absence of binding in FTD patients.161
In April 2012, florbetapir was the first of the fluorinated amyloid markers to receive FDA approval, under the trade name AMYViD. Florbetapir is approved for the indication of imaging the brain to estimate beta-amyloid neuritic plaque density in adult patients with cognitive impairment who are being evaluated for AD and other causes of cognitive decline. Florbetapir (previously known as AV45) is administered as a 370 mBq bolus with a 30-min waiting period to allow for metabolic conversion and binding. The scan can be completed in 10 min in a typical protocol.Reference Villemagne, Chetelat, Pike and Rowe135, Reference Clark, Schneider and Mintun167 Florbetapir binding (based on 34 AD patients and 16 elderly controls) is highest in the precuneus, followed by the anterior cingulate or posterior cingulate, temporal cortex, parietal cortex, and frontal cortex, in descending order.Reference Wong, Rosenberg and Zhou168, Reference Joshi, Pontecorvo and Clark169 Newberg etal.Reference Newberg, Arnold, Wintering, Rovner and Alavi170 reported florbetapir to be 95% sensitive and 95% specific compared to elderly controls in a phase II trial. In an 18-month phase II trial of florbetapir, 45 subjects with probable AD were compared to 60 subjects with MCI and 79 healthy elderly controls.Reference Sperling, Doraiswamy and Johnson171 The study showed 68% of MCI cases and 90% of AD cases were 11C-PIB-positive.Reference Rowe, Ng and Ackermann134
Clark etal.Reference Clark, Schneider and Mintun167 reported phase III data on florbetapir. Thirty-five subjects with terminal illnesses, including advanced dementia, received florbetapir scans late in life and then underwent postmortem neuropathological analysis. Eighteen were florbetapir-positive, while 17 did not show any significant amyloid labeling. All of the florbetapir-positive cases showed AD histopathology. One case had AD by autopsy diagnosis, but did not show florbetapir labeling. In contrast, all the cases with non-AD neuropathology had been florbetapir-negative. A specificity series of young (under age 50 years) controls totaling 74 subjects yielded no florbetapir-positive scans. Altogether, this longitudinal study reported a sensitivity of 93% and a specificity of 100%.Reference Clark, Schneider and Mintun167 However, the authors recognized the study was biased to the late stages of dementia, and this level of accuracy is unlikely in early AD or MCI.
The FDA approval of florbetapir (AMYViD) has the following stipulations: (1) a training program must be completed prior to being able to properly interpret the florbetapir images, (2) a positive scan does not establish the diagnosis of AD or other dementia, and (3) safety and efficacy has not been established for predicting the development of dementia. It will be critically important to participate in a training program to reach a high level of accuracy and inter-rater reliability.Reference Rowe and Villemagne17 While demented patients studied in the last year of life could be correctly classified as AD-positive or -negative with a sensitivity of 93% and a specificity of 100%,Reference Clark, Schneider and Bedell172 it is not so easy in the earlier phases of the illness. For example, in a recently published multicenter studyReference Camus, Payoux and Barre173 that was not industry-sponsored, the results are quite telling. A sample of 13 patients with clinically defined AD (NINCDS-ADRDA criteria), 12 patients with probable MCI, and 21 healthy elderly controls were evaluated by visual read and by semiquantitative analysis. Two independent readers with a basic training in interpreting amyloid scans had moderate inter-rater agreement (κ = 0.71), and visual read gave an 85% sensitivity and a 38% specificity. However, when a quantitative analysis method—standardized uptake values (SUVR) compared to the cerebellum—was used, higher accuracy was obtained. SUVR were higher in AD patients compared to controls in most regions of the cerebrum, but the posterior cingulate showed significantly more florbetapir uptake in AD patients compared to both controls and MCI patients. The sensitivity using this semiquantitative method was 92% and the specificity was 90.5%.Reference Camus, Payoux and Barre173 Similarly, readers in a test/retest paradigmReference Joshi, Pontecorvo and Clark169 showed moderate inter-rater reliability (κ = 0.78) but much higher intrarater test-retest reliability (κ = 0.88). So training and/or quantitative analysis will likely prove to be important component steps in incorporating amyloid imaging into the practice of evaluating patients with dementing illnesses.Reference Rowe and Villemagne17
It should be noted that international efforts are underway to correlate brain imaging findings, biomarkers, and neuropsychological findings in patients with MCI and dementia. Collaborations such as the Australian Imaging Biomarkers and Lifestyle Study of Ageing, the Alzheimer's Disease Neuroimaging Initiative, the European Alzheimer's Disease Neuroimaging Initiative, and the Japanese Alzheimer's Disease Neuroimaging Initiative are accumulating large databases to understand the progression of MCI to AD and to differentiate the forms of dementia.
Functional neuroimaging—introduction
Currently, the most reliable neuroimaging findings for AD are the observed decreased metabolic activity and associated decreased perfusion of the posterior parietal and temporal lobes bilaterally with relative sparing of the basal ganglia, thalamus, and primary sensory-motor cortex.Reference Bonte, Weiner, Bigio and White8, Reference Foster, Heidebrink and Clark14, Reference Mistur, Mosconi and Santi24, Reference McKhann, Drachman and Folstein32, Reference Ravona-Springer, Davidson and Noy38, Reference Jobst, Barnetson and Shepstone174 Increasingly, the findings of decreased metabolism and perfusion of the posterior cingulate gyrus and precuneus have been recognized as early hallmarks of AD.
Functional neuroimaging—PET
Reference Pickut, Saerens and Marien18F-fluoro-deoxyglucose positron emission tomography (FDG-PET) is often used for diagnostic evaluation of AD; however, it is not FDA-approved for this purpose. The principle underlying FDG-PET is the central role of glucose as an energy source for neurons. These cells are incapable of storing energy and need a continuous supply of glucose. As a neuron's activity increases, so does its glucose utilization. In response, local perfusion increases to deliver more glucose and oxygen. FDG serves as a glucose substitute. When FDG becomes phosphorylated, it becomes trapped inside the neuron. The accumulation of the tracer continues over approximately 20 min.Thus, the image rendered by FDG-PET is the integration of 20 min of brain activity. The average glucose utilization of gray matter is 40–60 μmol glucose/100 g tissue/min and of white matter is 15 μmol glucose/100 g tissue/min.Reference Herholz, Carter and Jones175
The typical findings in AD are decreased glucose metabolism in the parietal lobes, temporal lobes (with greater decrease in the medial portions), and the posterior cingulate gyrus/precuneus. Frontal lobes may be involved, but this is usually later in the progression of the disease. The primary somatosensory cortex and visual cortex are usually spared. Furthermore, the basal ganglia and cerebellum are usually spared.Reference Bohnen, Djang, Herholz, Anzai and Minoshima12 The most consistent finding in early AD has been hypometabolism of the hippocampus and entorhinal cortex.Reference McMurtray, Licht and Yeo176–Reference Mosconi178 The progress in FDG-PET neuroimaging has been summarized in several excellent reviews.Reference Bohnen, Djang, Herholz, Anzai and Minoshima12, Reference Herholz, Carter and Jones175, Reference Mosconi, Tsui and Herholz179, Reference Jagust180
The finding of decreased metabolism in the posterior cingulate cortex and precuneus early in the pathological course of ADReference Minoshima, Giordani and Berent181, Reference Minoshima, Foster and Kuhl182 was initially an underappreciated diagnostic feature that was not examined in numerous early studies of AD. Moreover, this finding is often missed when mere visual inspection is used for diagnostic purposes. The posterior cingulate cortex and precuneus region have a higher basal metabolism; thus a subtle decrease in metabolism early in the clinical course of AD is often not appreciated visually. Only with voxel-based statistical parametric analysis does the early decrease in metabolism (and perfusion) become evident. This confound is less of an issue with perfusion SPECT, because basal perfusion levels are not relatively higher compared to adjacent cortexReference Bonte, Harris, Roney and Hynan109 (see below).
FDG-PET as it is routinely used in clinical practice has a sensitivity of 88–93% and a specificity of 63–67% compared to clinical diagnostic workup.Reference Silverman10, Reference Herholz, Carter and Jones175, Reference Jagust180 Case-control studies have shown greater diagnostic accuracy in differentiating AD. A recent meta-analysisReference Bohnen, Djang, Herholz, Anzai and Minoshima12 derived a sensitivity of 96% and a specificity of 90% when differentiating AD from healthy elderly controls based on five studies published since 2000. An earlier meta-analysisReference Patwardhan, McCrory, Matchar, Samsa and Rutschmann183 found a sensitivity of 86% and a specificity of 86% derived from 15 studies spanning 1990–2000. Longitudinal studies with pathological confirmation have shown a sensitivity of 84–96% and a specificity of 74–86% in differentiating AD from other forms of dementia.Reference Silverman, Small and Chang6, Reference Bohnen, Djang, Herholz, Anzai and Minoshima12, Reference Foster, Heidebrink and Clark14, Reference Jagust, Reed, Mungas, Ellis and DeCarli35
While FTD and DLB appear to be clinically similar to AD early in the course of the illness, the appearance on FDG-PET can be distinct.Reference Bohnen, Djang, Herholz, Anzai and Minoshima12 FTD is characterized by metabolic reduction in the frontal and/or temporal lobes with relative sparing of the parietal cortices and precuneus.Reference Bohnen, Djang, Herholz, Anzai and Minoshima12 FDG-PET distinguished AD from FTD in a sample of 102 patients with clinical presentation of dementia with 85% accuracy.Reference Panegyres, Rogers, McCarthy, Campbell and Wu184 Minoshima etal.Reference Minoshima, Foster and Sima185 reported a 90% sensitivity and a 82% specificity based on occipital hypometabolism to distinguish DLB from AD. In contrast, in a recent study of 14 patients with DLB, preservation of posterior cingulate/precuneus metabolism proved to be a diagnostic sign with 100% specificity.Reference Lim, Katsifis and Villemagne15
A large sample (N = 548) of patients with AD (N = 199), FTD (N = 98), DLB (N = 27), and MCI (N = 114), as well as a group of normal elderly (N = 110), were evaluated with FDG-PET and compared using a voxel-based statistical parametric analysis.Reference Mosconi, Tsui and Herholz179 Virtually all AD patients showed decreased parietal, temporal, and posterior cingulate cortex/precuneus metabolism, rendering a sensitivity of 99% and a specificity of 98% in differentiating AD from normal aging controls. This supports the importance of statistical parametric analysis in strengthening the diagnostic utility of neuroimaging. However, these FDG-PET findings did not prove to be pathognomonic for AD, as about 13% of AD patients demonstrated decreased frontal metabolism and 5% of AD cases had decreased occipital metabolism (usually a hallmark for DLB). Similarly, patients clinically diagnosed with FTD had minimally decreased frontal metabolism in 35% of cases and had significantly decreased parietal metabolism in another 35% of cases.Reference Mosconi, Tsui and Herholz179 This confounded the differentiation of AD from FTD, and specificity was approximately 65%. Patients diagnosed with DLB presented similar confounding FDG-PET findings. Roughly 35% of DLB patients demonstrated decreased posterior cingulate/precuneus metabolism, resulting in a sensitivity of 71% for differentiating AD from DLB.
Recently, the major thrust of neuroimaging research in this area has shifted to identifying MCI prior to the development of profound cognitive impairment, such as can be detected by crude clinical methods (MMSE or Clock Drawing Test). Patients with MCI of the Alzheimer's type or amnestic MCI generally demonstrate mildly decrease metabolism in the medial temporal lobe and the posterior cingulate cortex/precuneus, followed by the parietal cortex.Reference Mistur, Mosconi and Santi24, Reference McMurtray, Licht and Yeo176, Reference de Leon, Convit and Wolf177, Reference Mosconi, Tsui and Herholz179, Reference Jagust180, Reference Mosconi, De and Li186 In contrast, patients with non-amnestic MCI often show decreased frontal lobe metabolism with relatively spared posterior cingulate/precuneuous metabolism, but overall there is greater variability in presentation for non-amnestic MCI.Reference McMurtray, Licht and Yeo176, Reference de Leon, Convit and Wolf177, Reference Mosconi, Tsui and Herholz179 Recent longitudinal studies have provided insight into the value of FDG-PET in predicting the progression of MCI. Dobert etal.Reference Dobert, Pantel and Frolich187 followed 24 patients with MCI for approximately 18 months after a baseline scan. The scan had a sensitivity of 44% and a specificity of 83% for predicting progression to AD; if the diagnosis of mixed VaD/AD was included, then sensitivity rose to 71% and specificity decreased to 78%.Reference Dobert, Pantel and Frolich187A large longitudinal study of patients over 5 years after a baseline FDG-PET had a sensitivity of 78% and a specificity of 81% for the final clinical diagnosis of dementia. Drzezga etal.Reference Drzezga, Lautenschlager and Siebner188 followed 22 patients with MCI over 1 year with a baseline and follow-up FDG-PET, neuropsychological test, and MRI. Using statistical parametric analysis, this group demonstrated a predictable pattern of hypometabolism in the temporal and parietal cortices and posterior cingulate gyrus/precuneus at baseline in those MCI cases that progressed to AD. Statistically significant hypometabolism in the posterior cingulate gyrus/precuneus, but no changes in the parietal cortex, was found in those MCI cases that remained stable over 1 year.Reference Drzezga, Lautenschlager and Siebner188 Similar results were recently reported in a 3-year longitudinal study by Pagani etal.,Reference Pagani, Dessi and Morbelli189 who also used statistical parametric analysis. This group made the additional observation that stable MCI patients had statistically significantly less hypometabolism in the hippocampus and parahippocampal gyrus compared to MCI patients who progressed to AD.Reference Pagani, Dessi and Morbelli189 A recent meta-analysis of the diagnostic accuracy of FDG-PET in predicting conversion from MCI to AD derived a sensitivity of 89% and a specificity of 84%.Reference Yuan, Gu and Wei190 The progress in this area has been previously reviewed.Reference Mistur, Mosconi and Santi24, Reference Mosconi, Tsui and Herholz179
Functional neuroimaging—SPECT
SPECT is the most widely available technology for measuring brain function.Reference Devous191, Reference Devous192 SPECT facilities outnumber PET facilities 12-fold.Reference Devous191 Using currently available radiopharmaceuticals, perfusion SPECT accurately represents regional cerebral blood flow (rCBF).Reference Darcourt, Mena, Cauvin and Miller193, Reference Payne, Trivedi and Devous194 Additional tracers have become available (one is commercially available) to measure receptor density and dopamine transporter site density. rCBF is a valid marker for neuronal activity over most of the physiological range of cerebral blood flow, because under most circumstances rCBF is tightly coupled to neuronal metabolism. This principle underlies SPECT perfusion imaging and functional MRI. SPECT perfusion was first measured with Xenon (133Xe), an inert gas that precisely quantifies cerebral blood flow. Commonly used radiopharmaceuticals currently include 99mTc-hexamethylpropylene amine oxime (HMPAO), 99mTc-ethylcysteinate dimer (ECD), N-isopropyl-p-123I-iodoamphetamine (IMP), and 123I-N,N,N’-trimethyl-N’-(2-hydroxy-3-methyl-5-iodobenzyl)-1,3-propanediamine (HIPDM). All of the currently available tracers closely follow 133Xe-derived rCBF values over the physiological range.Reference Devous191, Reference Darcourt, Mena, Cauvin and Miller193, Reference Payne, Trivedi and Devous194 HMPAO has many advantages, including but not limited to low risk of allergic reaction, higher extraction, and better signal-to-noise ratio. 125I-IMP is widely used outside the United States with excellent results.
Of note, the radiopharmaceuticals for SPECT perfusion imaging are widely available and approved by federal pharmaceutical regulatory agencies. In contrast, radiopharmaceuticals for PET, which are dependent upon a cyclotron for production and are generally short-lived, are considerably less available and not approved by the FDA (in the United States) or equivalent bodies. Coupled with the limited availability of PET imaging centers, PET remains an alluring, but impractical, solution for the widespread need to image roughly 123 million persons at risk for dementia worldwide. SPECT offers a widely available and inexpensive imaging technique with a modest loss of diagnostic accuracy compared to FDG-PET imaging.Reference Pimlott and Ebmeier195, Reference Matsuda196
Resolution differences are often cited as a reason to prefer PET imaging. While PET FDG imaging still provides the highest resolution, it is at the limit of its resolution enhancement due to the very nature of the positron (a positron travels some 5–10 mm from its point of emission to the point where it is annihilated, referred to as the range.Reference Cherry and Phelps197 Modern perfusion SPECT images have resolution only slightly below FDG-PET images. For practical clinical purposes, with few exceptions (hippocampus, amygdala), the currently available resolution is adequate for interpretation of rCBF changes related to dementia and other neuropsychiatric disorders. Moreover, a revolutionary process may replace the Anger circuit and photomultiplier system that underlies current SPECT imaging with Compton camera technology. This could potentially increase the resolution of perfusion SPECT imaging to 1–2 mm198 and markedly reduce radiopharmaceutical doses and radiation exposure.
Since its earliest use,Reference Ducassou, Brendel, Lacroix and Brothier199–Reference Hill, Costello, Gramm, Lovett, McNeill and Treves201 SPECT imaging has undergone significant advancement in image acquisition and processing. Perhaps the earliest study, published by Bonte etal. in 1986, documented decreased temporal lobe perfusion in 37 patients with AD using 133Xe perfusion SPECT.Reference Bonte, Ross, Chehabi and Devous202 These early SPECT perfusion studies of AD relied on single-headed or low-resolution gamma cameras.Reference Battistin, Pizzolato and Dam203–Reference Mattman, Feldman and Forster205 Later studies used higher resolution gamma cameras; however, some groups still used inferior single-headed cameras, which resulted in compromised data.Reference Varma, Adams and Lloyd206 Processing and interpretation, like the equipment, have undergone remarkable progress, resulting in significantly improved diagnostic accuracy. Early studies depended on visual subjective interpretation or “eyeballing.” Inter-rater reliability was a significant factor.Reference Hellman, Tikofsky and Van207 Early attempts at semiquantitative analysis remained subjective and compromised. These early studies have been summarized in a number of reviews.Reference Talbot, Lloyd, Snowden, Neary and Testa208–Reference Van Heertum210 Notably, a weighted meta-analysis, which excluded 123I-IMP and 99mT-ECD studies, derived a pooled weighted sensitivity and specificity of 48 99mT-HMPAO studies published prior to 2003.Reference Dougall, Bruggink and Ebmeier209 According to this meta-analysis, perfusion SPECT has a sensitivity of 74% and a specificity of 81% for the differentiation of AD from elderly controls.Reference Dougall, Bruggink and Ebmeier209 A more recent meta-analysis of selected research from 1990–2010Reference Bloudek, Spackman, Blankenburg and Sullivan211 concluded that perfusion SPECT had a sensitivity of 79% and a specificity of 84%. Both these meta-analyses intermingled studies using single-headed and multiheaded gamma cameras. Moreover, the summary sensitivity/specificity figures result from combined comparisons of AD cases to MCI, FTD, VaD, DLB, and healthy elderly controls. As a result, these meta-analyses are not consistent with the conclusions of others.Reference Bonte, Harris, Hynan, Bigio and White212, Reference Hanyu, Abe and Arai213
When the entire extent of SPECT neuroimaging literature was examined and grouped based on camera type and comparator group (FTD, VaD, DLB, MCI, healthy elderly control), a somewhat different picture emerges. For the purposes of the review, 133Xe and 123I-IMP studies were not included. When differentiating AD from healthy elderly controls, studies using relatively low-resolution, single-headed gamma cameras yielded an overall sensitivity of 84% and an overall specificity of 83%.Reference Jagust, Thisted and Devous25, Reference Jobst, Barnetson and Shepstone174, Reference Hellman, Tikofsky and Van207, Reference Hanyu, Abe and Arai213–Reference O'Brien, Ames and Desmond221 Studies utilizing multiheaded gamma cameras and often quantitative analysisReference Bonte, Weiner, Bigio and White8, Reference Bonte, Harris, Roney and Hynan109, Reference Jobst, Barnetson and Shepstone174, Reference O'Brien, Eagger, Syed, Sahakian and Levy217, Reference O'Brien, Ames and Desmond221–Reference Rusina, Kukal, Belicek, Buncova and Matej241 yielded a modest, but clinically significant, increase in overall sensitivity from 84–89% and in overall specificity from 83–89%.
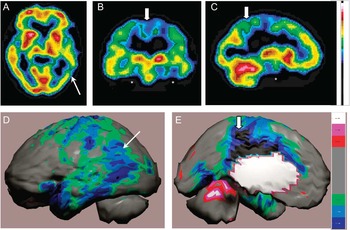
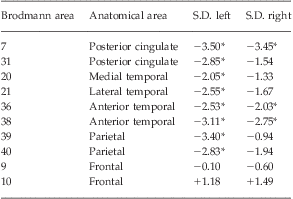
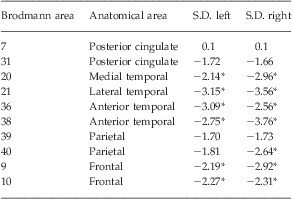
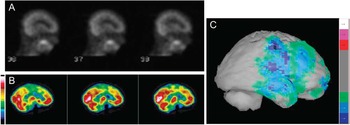
Longitudinal clinical studies have examined the sensitivity and specificity of baseline SPECT perfusion scans for the eventual diagnosis of AD. Hanyu etal.Reference Hanyu, Abe and Arai213 examined a group of 219 patients and were able to distinguish 56 cases that would progress to AD based on decreased perfusion of the temporal and parietal lobes (sensitivity 82%, specificity 89%). As part of the Oxford Study to Investigate Memory and Aging, Jobst etal.Reference Jobst, Barnetson and Shepstone174 followed 200 patients with dementia and 119 controls over 7 years. Seventy patients were autopsied, and baseline clinical evaluation alone yielded a sensitivity of 93% and a specificity of 46%, while baseline SPECT scans combined with clinical diagnosis did not change sensitivity, but increased specificity to 84%. Taken together, studies of perfusion SPECT in the diagnosis of AD with comparison to a longitudinal clinical course and/or histopathology demonstrate sensitivity in the range of 82–96% and a specificity in the range of 83–89%. See Figure 1 for an example of the typical appearance of AD on perfusion SPECT. Table 2 provides a statistical parametric analysis of perfusion in key diagnostic regions of a patient with AD.
Tc-99m-HMPAO perfusion SPECT scan data from a patient with a diagnosis of AD. A–C: 4 mm sections—transverse at the level of the caudate, coronal at the level of the putamen, and sagittal lateral to the caudate, respectively. The color scale is scaled relative to the patient's mean cerebral perfusion. Mean blood flow (72%) is in yellow. Color shifts occur at approximately every 0.5 SD (3%) relative to the patient's mean. D–E: The patient's data compared to a normative database (N = 68). A map of statistically significant differences can be generated using the Oasis software by Segami, Inc. Here, the color scale indicates gray for areas that do not differ significantly from the normative database. In contrast, areas of green, light blue, and dark blue represent areas of more than 2, 3, and 4 SD below the mean perfusion of the normative database, respectively. Statistically significant increases in perfusion are illustrated in the red color scale. Decreased perfusion in the temporal lobes (asterisk), parietal cortex (thin arrow), and posterior cingulate gyrus (thick arrow) can be appreciated. Images courtesy of CereScan Corporation, Denver, CO (http://www.cerescanimaging.com).

Statistical parametric analysis by Brodmann area in AD
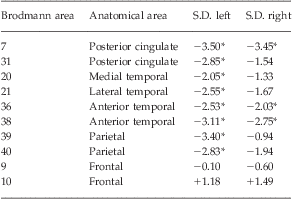
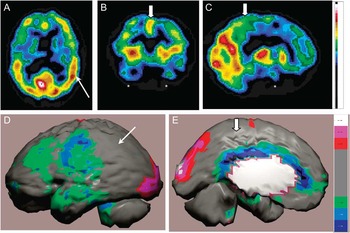
The patient's data statistically analyzed relative to a normative database (N = 64; Segami, Inc.). This table illustrates relative perfusion in key Brodmann areas. Comparison to Table 3 will illustrate the differences between AD and FTD perfusion SPECT scans. Perfusion is statistically significantly reduced in parietal and temporal lobes, as well as the posterior cingulate gyrus, with sparing of the frontal lobes (*p < .05 relative to a normative database of 64 subjects). Statistics courtesy of CereScan Corporation, Denver, CO.
SPECT neuroimaging can be extremely helpful in the evaluation of dementia of a vascular origin. VaD can show widely varying regional blood flow patterns, reflecting its variable vascular source.Reference Wu, Mungas, Eberling, Reed and Jagust39 As such, there is not a single characteristic pattern of perfusion or metabolic activity that identifies VaD dementia.Reference Ravona-Springer, Davidson and Noy38–Reference Hanyu, Shimuzu and Tanaka40 Rather, it is often the varied, bilaterally disparate, and irregular pattern that aids in the diagnosis of vascular dementia.Reference Cummings1, Reference Foster, Heidebrink and Clark14, Reference Ravona-Springer, Davidson and Noy38, Reference Hanyu, Shimuzu and Tanaka40 Neuroimaging data suggest that different types of VaD can be distinguished by SPECT; indeed some authors feel that SPECT is more helpful in the diagnosis of vascular disease than PET.Reference Wu, Mungas, Eberling, Reed and Jagust39, Reference Hanyu, Shimuzu and Tanaka40 In the very early detection of stroke, which is the seminal event leading to infarct-related dementia, SPECT is considered superior by most authors.Reference Ravona-Springer, Davidson and Noy38, Reference Wu, Mungas, Eberling, Reed and Jagust39, Reference Starkstein, Sabe and Vazquez242 Often SPECT will reveal a perfusion defect matching the vascular territory of a major cerebral artery. There have been considerable efforts to develop protocols to differentiate small vessel VaD from AD. Several investigators have recognized the tendency for VaD to present with reduced perfusion in anterior aspects of the brain,Reference Starkstein, Sabe and Vazquez242–Reference Jagust, Budinger and Reed244 although this does not fully differentiate VaD from other dementias.Reference Yoshikawa, Murase and Oku243, Reference Yoshikawa, Murase and Oku245 Three-dimensional statistical parametric analysis of perfusion SPECT also demonstrated an anterior–posterior differentiation of VaD and AD. In particular, anterior cingulate cortex hypoperfusion strongly differentiated AD from VaD.Reference Hanyu, Shimuzu and Tanaka40 Combined weighted sensitivity and specificity of studies using multiheaded cameras and quantitative analysis was 90% and 76.4%, respectively.Reference deFigueiredo, Shankle and Maccato230, Reference Ishii, Shishido and Miyajima240, Reference Butler, Costa and Greco246, Reference Uchida, Minoshima, Okada, Kawata and Ito247 Of note, Ishii etal. utilized a more sophisticated form of statistical parametric analysis with a sample of 12 patients with AD, 10 patients with VaD, and 9 control patients.Reference Ishii, Shishido and Miyajima240 Depending on the statistical cutoff utilized, sensitivity and specificity for differentiating VaD from AD was as high as 92% and 80%, respectively. This represents a significant increase relative to the performance of single-headed gamma cameras with qualitative analysis, in which the combined sensitivity is 70% and the combined specificity is 76.6%.Reference Battistin, Pizzolato and Dam203, Reference Talbot, Lloyd, Snowden, Neary and Testa208, Reference Sloan, Fenton, Kennedy and MacLennan219, Reference Pavics, Grunwald and Reichmann248–Reference Launes, Sulkava and Erkinjuntti252 In addition, subcortical ischemic damage leading to subcortical VaD or to white matter ischemic damage (Binswanger's disease) often presents with perfusion defects in deep brain nuclei.Reference Kato, Yoshikawa and Oku253 For example, perfusion of the pulvinar of the thalamus is often reduced in subcortical VaD. This finding can distinguish subcortical VaD from AD and controls.Reference Shim, Yang, Kim, Shon and Chung254 In summary, perfusion defects in the thalamus, anterior cingulate cortices, and basal ganglia can help distinguish VaD from AD.Reference Ishii, Shishido and Miyajima240, Reference Kato, Yoshikawa and Oku253, Reference Shim, Yang, Kim, Shon and Chung254 The use of vasodilation with acetazolamide (brand name Diamox) or increased CO2 to test vascular reserve can be a useful test to distinguish VaD from AD.Reference Pavics, Grunwald and Reichmann248 In controls, there is a uniform increase in perfusion in response to acetazolamide.Reference Vorstrup, Henriksen and Paulson255, Reference Takasawa, Murase and Oku256 Similarly, patients with AD will show increased perfusion upon administration of the vasodilator.Reference Pavics, Grunwald and Reichmann248 However, often patients with VaD (similar to patients with transient ischemic attacks) are at the limit of the vasoreactive reserve.Reference Vorstrup257 Thus, there is little change in perfusion with acetazolamide administration. Last, a promising application of artificial intelligence to this differential was reported in 1995. An optimal interpolative neural network (OINN), or artificial intelligence program,Reference deFigueiredo, Shankle and Maccato230 was developed under the direction of Ismael Mena and utilized in an innovative study to differentiate VaD and AD. By means of 19 regions of interest, this interesting algorithm allowed differentiation of VaD and AD using SPECT perfusion imaging with 83% accuracy.Reference deFigueiredo, Shankle and Maccato230
FTD can be characterized on functional brain imaging by decreased function and associated hypoperfusion in the frontal lobes, caudate nuclei, and anterior temporal lobes.Reference Small5, Reference Silverman, Small and Chang6, Reference Talbot, Goulding and Lloyd41, Reference Tranfaglia, Palumbo, Siepi, Sinzinger and Parnetti42, Reference Tateno, Kobayashi and Saito45, Reference Talbot, Lloyd, Snowden, Neary and Testa208, Reference Van Heertum210 Hypoperfusion also can be found in the anterior cingulate gyrus. In FTD, perfusion is generally spared in the posterior cingulate gyrus/precuneus.Reference Bonte, Harris, Roney and Hynan109, Reference Bonte, Harris, Hynan, Bigio and White212, Reference Devous258 Based on correlation to autopsy data, posterior cingulate perfusion has a positive predictive value of 93% and a negative predictive value of 81%.Reference Bonte, Harris, Hynan, Bigio and White212 Observations by a number of investigators using the modalities of PET, SPECT, and MRI support the validity of decreased posterior cingulate gyrus function as a diagnostic marker for AD that differentiates it from FTD.7, Reference Nobili, Frisoni and Portet16, Reference Rowe and Villemagne17, Reference Villemagne, Pike and Chetelat21, Reference Mistur, Mosconi and Santi24, Reference Bremner125, Reference Klunk, Mathis, Price, Lopresti and DeKosky129
Figure 2 illustrates the typical appearance of FTD on perfusion SPECT. Table 3 provides a statistical parametric analysis of perfusion in key diagnostic regions.
Tc-99m-HMPAO perfusion SPECT scan data from a patient with a diagnosis of FTD. A–C: 4 mm sections—transverse at the level of the caudate, coronal at the level of the putamen, and sagittal lateral to the caudate, respectively. The color scale is the same as images A–C in Figure 1. D–E: The patient's data compared to a normative database (N = 68). A map of statistically significant differences can be generated using the Oasis software by Segami, Inc. The color scale is the same as images D and E in Figure 1. Decreased perfusion in the temporal lobes (asterisk) and frontal lobes can be appreciated. However, perfusion is not decreased in the parietal cortex (thin arrow) or the posterior cingulate gyrus (thick arrow). Images courtesy of CereScan Corporation, Denver, CO (http://www.cerescanimaging.com).

Statistical parametric analysis of perfusion by Brodmann area in FTD
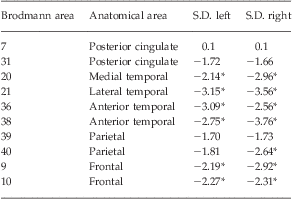
The patient's data statistically analyzed relative to a normative database (N = 64; Segami, Inc.). This table illustrates relative perfusion in key Brodmann areas in the FTD patient. Perfusion is statistically significantly reduced in frontal and temporal lobes with sparing of the parietal lobes and posterior cingulate gyrus (*p < .05 relative to a normative database of 64 subjects). Statistics courtesy of CereScan Corporation, Denver, CO.
A number of studies have explored the ability of perfusion SPECT to distinguish AD from FTD. For example, Bonte etal.Reference Bonte, Tintner, Weiner, Bigio and White259 followed 54 patients to autopsy, and a SPECT scan up to 1 year prior to death predicted the histopathology with a 96% sensitivity and an 84% specificity. Matsuda etal.Reference Matsuda, Mizumura and Nagao260 recently utilized Z-score analysis to demonstrate that decreased posterior cingulate/precuneus perfusion could distinguish 40 patients with AD from 40 controls with an accuracy of 86%. Meta-analyses have yielded a combined sensitivity and specificity of 71.5% and 78.2%, respectively, in differentiating AD from FTD.Reference Dougall, Bruggink and Ebmeier209, Reference Bloudek, Spackman, Blankenburg and Sullivan211 However, the mixing of studies using single-headed and multiheaded cameras, as well as qualitative and quantitative methods, clouds the issue. When only single-headed camera studies are evaluated,Reference Talbot, Lloyd, Snowden, Neary and Testa208, Reference Neary, Snowden and Shields261–Reference McNeill, Sare and Manoharan263 the combined sensitivity and specificity are similar to those reported by Dougall etal.Reference Dougall, Bruggink and Ebmeier209 Multiheaded camera studies have yielded greater accuracy.Reference Tranfaglia, Palumbo, Siepi, Sinzinger and Parnetti42, Reference Bonte, Harris, Roney and Hynan109, Reference Charpentier, Lavenu and Defebvre264–Reference Horn, Habert and Kas266 For example, in a careful study with quantitative analysis of SPECT data from a multiheaded gamma camera compared to autopsy findings, the temporal-parietal and posterior cingulate gyrus hypoperfusion had a 96% sensitivity and an 80% specificity for distinguishing AD from FTD.Reference Bonte, Harris, Roney and Hynan109 Tranfaglia etal.Reference Tranfaglia, Palumbo, Siepi, Sinzinger and Parnetti42 utilized commercially available statistical parametric analysis software to differentiate FTD from AD and MCI. The software allowed the evaluation of separate Brodmann areas with statistical comparison to a normal database. Statistically significant perfusion decreases were found in Brodmann areas 37 (temporal gyrus), 39 (angular gyrus), and 40 (supramarginal gyrus), which distinguished AD from FTD. In contrast, decreased perfusion in area 47 (frontal association cortex) distinguished FTD (see also Tables 2 and 3). Several different linear and nonlinear analysis methodsReference Horn, Habert and Kas266 have been tested in the differentiation of FTD from AD. A support vector machine and partial least sequence regression was most accurate (88%) in differentiating mild AD from mild FTD and was superior to visual interpretation (65–82%). Discriminative analysis of areas of decreased perfusion, particularly the frontal cortex, along with the MMSE allowed 90% accuracy in differentiating AD from FTD.Reference Charpentier, Lavenu and Defebvre264
Similarly, the differentiation of AD from DLB by perfusion SPECT imaging has benefited from improved hardware and analysis techniques. Shimizu etal.Reference Shimizu, Hanyu and Kanetaka267 examined the differentiation of DLB and AD using statistical parametric analysis to evaluate cortical, as well as deep nuclei, perfusion. They found that while hypoperfusion in the occipital lobe was predictive of DLB, the additional findings of increased perfusion in the thalamus and bilateral striatum strengthened the accuracy of the diagnosis of DLB. Goto etal.Reference Goto, Ishii and Uemura268 also found striatal parameters useful in differentiating early mild DLB from early mild AD. They found striatal volume to be reduced in early DLB, along with reduced occipital perfusion. The sensitivity of these parameters was 89%, while the specificity was 84%. They confirmed that reduced hippocampal perfusion and volume distinguishes early AD from early DLB.
The clinical progression of MCI to AD has been followed in prospective longitudinal studies with large samples over twoReference Boyle, Wilson, Aggarwal, Tang and Bennett62 to fiveReference Bennett, Wilson and Schneider61 years. These clinical studies have shown that roughly 35% of patients with MCI progress on to AD over the course of 5 years. Thus, the ability to identify MCI accurately will help target those at risk of progressing to AD. The accurate and early identification of MCI with perfusion SPECT has been examined extensively in a number of longitudinal studies. A total of 495 patients with MCI have been followed over 2–3 years (one study to 5 yearsReference Johnson, Moran and Becker269) in 10 longitudinal studies that included a baseline SPECT scan. All of the studies used multiheaded gamma cameras and quantitative analysis.Reference Johnson, Moran and Becker269–Reference Borroni, Anchisi and Paghera278 Overall, 43% of MCI patients converted to AD with an average conversion rate of 20% per annum. The remaining 258 patients showed no change in cognition (stable MCI). A highly consistent finding was that converters could be distinguished from stable MCI by statistically significantly decreases in perfusion of the medial temporal/parahippocampal cortex and parietal cortex. In addition, several studies found significantly decreased perfusion in the posterior cingulate/precuneus.Reference Kogure, Matsuda and Ohnishi275–Reference Borroni, Anchisi and Paghera278 Thus, the key SPECT findings found in AD were already present 2–3 years before the onset of the clinical symptoms of AD.
Moreover, some studies have suggested that MCI with different prognoses show differing patterns on SPECT scans. Nobili etal.Reference Nobili, Frisoni and Portet16 similarly found that SPECT perfusion patterns were predictive of the type of MCI experienced. This work was part of a large multicenter study of the European Alzheimer's Disease Consortium involving subjects who were 55 years or older and had MMSE scores of 27 or greater. (Note: These subjects would not be defined as MCI using current diagnostic standards.) Subjects were defined as amnestic MCI if they demonstrated significant impairment on memory-specific neuropsychological testing (e.g., delayed recall). Subjects with non-amnestic MCI were defined by significant impairment in other neuropsychological testing (e.g., trail-making, categorical verbal fluency), but not in memory-specific tests. In contrast, subjects who had complaints of memory difficulty, but did not demonstrate impairment on neuropsychological testing, were defined as Subjective Only. Those with only subjective memory difficulties showed perfusion patterns on SPECT that were indistinguishable from controls. Subjects with non-amnestic MCI demonstrated bilateral perfusion deficits in the temporal lobes, while those with amnestic MCI demonstrated bilateral perfusion deficits in the parietal lobes, temporal lobes, posterior cingulate, and precuneus area.Reference Nobili, Frisoni and Portet16 Temporal lobe perfusion as measured by SPECT has been shown to be inversely correlated with the rate of cognitive decline in AD patients.Reference Wolfe, Reed, Eberling and Jagust279
The early SPECT perfusion changes in MCI that presage the progression to AD and other dementias underscore the potential value of changes in the activity of the posterior cingulate as an early signal. The posterior cingulate gyrus receives input from the subiculum and projects to the anterior thalamus.Reference Desgranges, Baron and de la Sayette280 Several studies have demonstrated functional correlation between the posterior cingulate and the entorhinal cortex.Reference Hirao, Ohnishi and Matsuda281, Reference Mosconi, Pupi and De Cristofaro282 The entorhinal cortex appears to be one of the first sites to accumulate neurofibrillary tangles and neuritic plaques preceding even the hippocampus.Reference Braak and Braak155, Reference Matsuda283, Reference Gomez-Isla, Price and McKeel284 Indeed, portions of the entorhinal cortex may undergo 40–60% neuronal loss prior to measurable memory loss.Reference Price, Ko and Wade285 So, patients with only mild subjective memory impairment may already have significant AD-specific pathology present in the entorhinal cortex. Reflecting the intimate association between the two structures,Reference Minoshima, Cross, Foster, Henry and Kuhl286 changes in posterior cingulate function may indeed be an early and prognostic downstream effect of entorhinal cortex dysfunction. In contrast, decreased perfusion in the hippocampus has been variably reported. MatsudaReference Matsuda196, Reference Matsuda287 concluded that this variability was the result of partial volume effects in the analysis of this small structure. Therefore, the usefulness of hippocampal perfusion or metabolismReference Mosconi, Tsui and Herholz179 as an early predictive sign is dubious.
Recently, several groups have focused on novel methods of image analysis to enhance the identification of prodromal AD among patients with MCI. Habert etal.Reference Habert, Horn and Sarazin271 utilized statistical analysis in a sample of 83 patients with memory complaints who were followed over 3 years. They found similar sensitivity and specificity as described above. Pagani etal.Reference Pagani, Salmaso, Rodriguez, Nardo and Nobili239 used principal component analysis to differentiate mild and moderate AD. Again, the hippocampus, parietal cortex, and posterior cingulate emerged as discriminative features for the severity of AD. Chaves etal.Reference Chaves, Ramirez and Gorriz238 found that linear kernel support vector analysis significantly increased the diagnostic power of SPECT in identifying early mild AD. In a sample of 38 patients with mild AD, the approach yielded a sensitivity of 97%, a specificity of 100%, and an accuracy of 99%.
In summary, SPECT is a valuable tool in the identification of AD, the differentiation of other dementias, and the detection of MCI. In several studies, SPECT detected functional patterns of MCI prior to the onset of significant neuropsychological impairment and prior to evidence of hippocampal atrophy on MRI.Reference Caroli, Testa and Geroldi273 SPECT outperforms clinical assessment for MCI, which is generally 49–63% sensitive and 89–94% specific.Reference Petersen, Stevens and Ganguli288 Using older, single-headed SPECT cameras and visual inspection, several studies have found that SPECT can differentiate MCI with a sensitivity of approximately 84% and a specificity of 83%. Modern cameras and quantitative analysis yields a sensitivity of 89% and a specificity of 89%. This exceeds the standard set forth for minimal criteria for a biological marker of AD as defined by the Ronald and Nancy Reagan Research Institute of the Alzheimer's Association and the National Institute on Aging Working Group.289 SPECT, alone or in combination with genetic testing, has the potential to provide prognostic information and differentiate those at risk for progression from MCI to AD.
Comparing SPECT and FDG-PET
FDG-PET does outperform SPECT in general clinical application, wherein visual inspection alone is used for diagnostic evaluation. In this circumstance, FDG-PET has a sensitivity of 88–93% and a specificity of 63–67%.Reference Silverman10, Reference Jagust, Reed, Mungas, Ellis and DeCarli35, Reference Herholz, Carter and Jones175 When compared to histopathologically confirmed AD, the visual interpretation of FDG-PET has a sensitivity of 84% and specificity of about 74%,Reference Jagust, Reed, Mungas, Ellis and DeCarli35 yielding a lower accuracy than perfusion SPECT due to the difference in specificity (sensitivity 93%/specificity 84%Reference Jobst, Barnetson and Shepstone174). Statistical parametric analysis significantly improves the accuracy of FDG-PET,Reference Mosconi, Tsui and Herholz179 as it does for SPECT. Yet, FDG-PET does not provide a pathognomonic finding for AD. Roughly 35% of patients with FTD demonstrate decreased metabolism in the parietal cortex,Reference Mosconi, Tsui and Herholz179 which is a finding typical of AD. Conversely, about 13% of AD patients have decreased frontal metabolism, which is a finding typical of FTD.Reference Mosconi, Tsui and Herholz179 In contrast, perfusion SPECT can be 90% accurate in differentiating AD and FTD.Reference Bonte, Harris, Roney and Hynan109, Reference Charpentier, Lavenu and Defebvre264
Given that SPECT is much more readily available and can be performed at a much lower cost,Reference Villemagne, Ong and Mulligan11, Reference Pimlott and Ebmeier195, Reference Herholz290, Reference Weih, Degirmenci and Kreil291 it is important to assess the value-added benefit of choosing PET or SPECT imaging. A relatively small number of studies have examined the distinction between SPECT and PET imaging in the same patients. In an early small study of 21 probable AD subjects compared to 10 controls, Messa etal.Reference Messa, Perani and Lucignani227 found SPECT and PET to have similar abilities for elucidating decreased function in the temporal-parietal cortex. PET proved superior in assessing frontal lobe function. Notably, the SPECT camera in this study was of low resolution (8.2 mm full width at half-mazimum {FWHM}). Another small study of 20 patients with AD compared to 13 controls utilized region of interest analysis and found PET and SPECT to be similar in differentiating AD from control. A pivotal study in this area compared FDG-PET and perfusion SPECT in the same 26 patients with probable AD.Reference Herholz, Schopphoff and Schmidt292 In the key areas of the temporal, parietal, and posterior cingulate cortices, FDG-PET and SPECT yielded corresponding findings (r = 0.90) using statistical parametric analysis. On the other hand, a methodologically flawed study that evaluated regions of interest from one hemisphere to the other found considerably lower accuracy for both PET and SPECT.Reference Dobert, Pantel and Frolich187
SilvermanReference Silverman10 summarized the comparison of PET and SPECT well, noting that the sensitivity and specificity of PET and SPECT have considerable overlap. The application of quantitative analysis greatly enhances both PET and SPECT. With appropriate quantitative analysis, both neuroimaging modalities can achieve high sensitivity and specificity in the diagnostic evaluation of AD and MCI, and in the differentiation of AD from LBD.
While controlled research studies demonstrate considerable advantage of using neuroimaging in the diagnosis of dementia,Reference Foster, Heidebrink and Clark14, Reference Villemagne, Mulligan and Pejoska150, Reference Panegyres, Rogers, McCarthy, Campbell and Wu184, Reference Uchida, Minoshima, Okada, Kawata and Ito247 the community experience does not appear as promising. For example, the sensitivity and specificity of FDG-PET can be as low as 88% and 63%, respectively, in the community.Reference Silverman10, Reference Herholz, Carter and Jones175 Indeed, a recent community study in Denver, Colorado, concluded that almost two-thirds of patients with memory complaints were misdiagnosed by a FDG-PET scan.Reference Shipley, Kluger and Filley293 Neurologists concluded that clinical examination of 30 out of 46 patients revealed the correct diagnosis, which included psychiatric disorders and vitamin deficiencies. Similarly, an independent study of florbetapirReference Camus, Payoux and Barre173 yielded a lower level of accuracy compared to that reported in phase II/III trials.Reference Newberg, Arnold, Wintering, Rovner and Alavi170, Reference Clark, Schneider and Mintun294 The problem reflects variation in equipment, reconstruction techniques, and the level of training and/or experience of the reading physicians.Reference Panegyres, Rogers, McCarthy, Campbell and Wu184, Reference Joshi, Koeppe and Fessler295 Moreover, the use of visual reads instead of quantitative analysis further compounds the problem.Reference Camus, Payoux and Barre173, Reference Bartenstein, Minoshima and Hirsch232, Reference Honda, Machida and Matsumoto234 For example, the inter-rater reliability for FDG-PET is lower for visual reads (kappa = 0.56) compared to quantitative analysis (kappa = 0.83).Reference Ng, Villemagne and Berlangieri296 The variation in quality of community scans is particularly severe for perfusion SPECT imaging, as many facilities still use single-head cameras or nonspecific reconstruction protocols. This is the equivalent of using a 0.3 T MRI machine to perform MR angiography or diffusion tensor imaging. Figure 3 illustrates this situation. A patient with memory complaints received a perfusion SPECT scan from a community hospital (single-head gamma camera, nonspecific processing). The resulting scan showed no attenuation correction, no masking of extra-axial structures, and no quantitative analysis. The scan was read as normal based on visual interpretation in grayscale. Within 2 months, the patient was re-evaluated. Neuropsychological testing was consistent with MCI. A perfusion SPECT scan with brain-specific reconstruction and quantitative analysis revealed findings consistent with early FTD. She was diagnosed with non-amnestic MCI.
A comparison of a community standard SPECT scan to that produced by brain-dedicated processing and analysis. Patient is a 56-year-old female with complaints of cognitive decline, memory problems, and confusion. Her score on the Montreal Cognitive Assessment (MoCA) was 24 (normal range 26–30). A. Sagittal images from Tc-99m-HMPAO perfusion SPECT scan from general nuclear medicine service in a community hospital. Patient was administered 24 mCi of radiopharmaceutical; acquisition time 17 min on a GE Infinia (resolution 10.5 mm) with no postprocessing. The scan was read as normal. B. Sagittal images from Tc-99m-HMPAO perfusion SPECT scan from functional brain imaging specialty clinic. Patient was administered 27 mCi of radiopharmaceutical; after a 1-h wash-out period, acquisition time was 22 min on a Siemens E-Cam with low-energy, high-resolution (LEHR) parallel hole collimation (resolution of 7.4 mm). Counts were collected in a 64 × 64 matrix with 32 stops of 6 degrees each. Total counts exceeded 5 million. Data filtered using a Butterworth filter at .6 with an order of 6. Chang attenuation correction was performed. The volume was masked to exclude non-neural structures. There was no postfiltering. The colorscale is the same as Figure 1A–1C. C. The patient's data can be compared to a normative database (N = 68). A map of statistically significant differences can be generated using the Segami, Inc. software. The color scale is the same as Figures 1D and 1E. Using these techniques, preserved posterior cingulate perfusion, but decreased frontal and temporal lobe perfusion consistent with FTD, can be appreciated. Images courtesy of CereScan Corporation, Denver, CO (http://www.cerescanimaging.com).

The case in Figure 3 underscores the importance of quantitative analysis and illustrates the variation in quality of SPECT scans. The first scan does not have added value and, in fact, misdiagnosed the patient. The latter scan reflects the added value that has been reported in the literatureReference Pimlott and Ebmeier195, Reference Matsuda196, Reference Honda, Machida and Matsumoto234 and has been recognized by the English National Institute for Health and Clinical ExcellenceReference Pimlott and Ebmeier195 and the European Federation of Neurological Sciences.Reference Hort, O'Brien and Gainotti297 While SPECT may not necessarily offer added sensitivity over clinical evaluation in controlled research settings, high-quality SPECT imaging with quantitative analysis may provide added sensitivity relative to the community level of clinical assessment. Moreover, there is ample evidence that SPECT can provide greater specificity in differentiating the type of dementia.Reference Matsuda196, Reference Bonte, Harris, Hynan, Bigio and White212, Reference Weih, Degirmenci and Kreil291 SPECT scans have confirmed, clarified, or redirected diagnosis and medical management of dementia patients.Reference Rollin-Sillaire, Bombois and Deramecourt298, Reference Read, Miller and Mena299 Indeed, in a recent retrospective study in a memory disorders clinic, clinicians found a baseline SPECT scan to be contributory to the management of 80% of the cases.Reference Borghesani, DeMers and Manchanda300
Early Diagnosis May Be Key
The evidence is now extensive that the neuropathology of AD begins to occur 20–30 years prior to the onset of clinical symptoms.Reference Trojanowski, Vandeerstichele and Korecka63, Reference Jack, Knopman and Jagust65, 161 This is likely true for the other forms of dementia as well. Early identification of this neuropathology and abatement of risk factors will be critical to lessening the impending burden to medical systems worldwide. Current multinational efforts are underway to develop protocols to screen for Alzheimer's disease risk with a combination of genetic, biomarker, and neuroimaging testing. Thus, treatment could potentially start prior to the onset of symptoms, with dramatic improvements in the overall quality of life and reduction in the burden of the disease. For example, studies of donepezil (Aricept) at 10 mg daily dosing has shown a slowing of the progression of cognitive decline over a 24-week period.Reference Burns, Rossor and Hecker301, Reference Rogers, Farlow, Doody, Mohs and Friedhoff302 When combined with the NMDA receptor antagonist, memantine (Namenda), donepezil improved global functioning measures and cognitive function over the course of a 24-week study period.Reference Tariot, Farlow and Grossberg303 Serial SPECT studies of patients treated with donepezil have shown preservation or increased cortical blood flow in the parietal, temporal, and dorsolateral prefrontal cortex over intervals of 4–15 monthsReference Ceravolo, Volterrani and Frosini304–Reference Nobili, Vitali and Canfora307; however, it must be underscored that delays in implementing acetylcholinesterase treatment may significantly reduce any potential treatment benefit. For example, Raskind etal.Reference Raskind, Peskind, Truyen, Kershaw and Damaraju308, Reference Raskind, Peskind, Wessel and Yuan309 found that subjects enrolled in the placebo arm during the first phase of a galantamine trial, but who later received the medication, had markedly curtailed improvement in cognitive function compared to those who were treated with galantamine in the first phase of the study.
Pharmaceuticals designed to slow or reverse amyloid accumulation will have a greater impact early in the disease process. New medications in development—some of which will target amyloid accumulations, such as gamma and β secretase inhibitors/modulators, as well as alpha secretase activators and tau kinase inhibitors—are relatively unlikely to clear a large burden of amyloid such as is found in late disease and even less likely to reverse the pathology when secondary events (such as inflammation) have occurred.Reference Heneka, O'Banion, Terwel and Kummer310 Indeed, in August 2010, Eli Lilly halted clinical trials of a gamma secretase inhibitor due to lack of effect on cognitive function. While this pharmaceutical was apparently effective in reducing amyloid deposits in the form of plaques, subjects showed marked worsening of cognitive function.Reference Wilson311. It can be hypothesized that secondary inflammation had caused irreversible damage in these subjects.
While early identification is emerging as a critical step, clinical evaluation is insufficient to identify the disease process until substantial neuronal loss and accumulation of amyloid, Lewy bodies, and/or inflammation have occurred.Reference Trojanowski, Vandeerstichele and Korecka63 The current practice guidelines for the diagnosis of MCI by the American Academy of Neurology, which are over 11 years old, recommend using the MMSE to diagnose MCI and AD.Reference Petersen, Stevens and Ganguli288 Yet, in its own review of the literature, the American Academy of Neurology provides data from randomized controlled clinical trials demonstrating the MMSE to be insensitive for the diagnosis of MCI and poorly sensitive for the diagnosis of dementias (sensitivity 49–63%, specificity 92–96%). Similarly, the Clock Drawing Test, widely used to diagnose dementia, has at its best a sensitivity of 83% and a specificity of 72% for the diagnosis of dementia and is of little value in the diagnosis of MCI.Reference Petersen, Stevens and Ganguli288 More meticulous neuropsychological testing has been able to detect dementia with a sensitivity of 82% and a specificity of 90–95%.Reference Petersen, Stevens and Ganguli288 In contrast, perfusion SPECT neuroimaging studies of MCI were able to accurately differentiate MCI from elderly controls and from AD in subjects with a MMSE score of >27.Reference Edman, Edenbrandt, Freden-Lindqvist, Nilsson and Wallin270, Reference Hirao, Ohnishi and Hirata312 Taken together, the currently accepted clinical examination and bedside testing for dementia, let alone for MCI, are inadequate.
In an effort to advance the diagnostic process, Dubois etal.Reference Dubois, Feldman and Jacova33 recommended a refined set of criteria for the diagnosis of AD in the research setting. These criteria would include subjective memory impairment, preferably supported by a collateral historian; objective memory impairment (delayed recall has proven to be a highly accurate discriminate for dementia); episodic memory impairment; and evidence of one or more biological indicators. Features such as atrophy of the hippocampus and entorhinal cortex, abnormal CSF markers, or abnormal functional neuroimaging findings (metabolism by FDG-PET or perfusion by SPECT) are considered critical supportive evidence for the diagnosis of MCI or dementia.Reference Dubois, Feldman and Jacova33, Reference Hampel, Burger and Teipel313 Notably, they concluded that molecular amyloid imaging holds promise, but they recognized the current limitations of these markers. At the 2010 International Conference on Alzheimer's Disease, these criteria were debated and subsequently recommended as updated clinical practice guidelines,Reference Waldemar314 which were subsequently published.Reference Hyman, Phelps and Beach315 The European Federation of Neurological Societies (EFNS) earlier had published updated joint practice guidelines for the diagnosis and treatment of AD. These revised recommendations included the use of PET or SPECT in the differentiation of AD from other dementias and the routine performance of CSF biomarker analysis and APOE4 genetic testing.Reference Hort, O'Brien and Gainotti297
These refined criteria will have immediate benefit in accelerating research on the early diagnosis and intervention in MCI, AD, FTD, and other dementias. By enriching and refining our diagnostic criteria with biomarkers, as several expertsReference Dubois, Feldman and Jacova33, Reference Herholz, Carter and Jones175, Reference Jagust180 have pointed out, the sample size and therefore the duration of pharmacological intervention studies can be reduced. The enriched diagnostic criteria would also increase the sensitivity of such studies. Since neuroimaging and other biomarker studies have a lower coefficient of variation, smaller sample sizes would be needed to achieve the same result. For example, the coefficient of variation in studies of AD using the Alzheimer's Disease Assessment Scale–Cognitive or the MMSE is often roughly 100%, while the coefficient of variation for FGD-PET or SPECT studies is generally about 50%. This could allow an approximately 75% reduction in sample size with no loss of statistical power.Reference Jagust180 The outcome would be shorter study durations, more statistical power, and speeding the process of moving promising pharmaceutical agents to clinical application.
Early identification of patients with MCI who are likely to benefit from a dementia-delaying or -preventing medication will soon emerge as a critical need in the clinic. Data indicate that MCI can be differentiated into probable prodromal AD and probable prodromal FTD.Reference Nobili, Frisoni and Portet16, Reference Villemagne and Rowe140, 161 This prognostic distinction becomes particularly promising if tau-specific pharmacological agents can be successfully developed. For example, by identifying MCI patients using neuroimaging (FDG-PET or perfusion SPECT) who are most likely to progress to FTD (as opposed to AD) and who are also negative for P-tau-231, clinicians can distinguish, early in disease progression, those candidates most likely to benefit from a tau-specific therapy. Likewise, early implementation of acetylcholinesterase treatment for those patients with MCI of the AD type will have benefit.Reference Burns, Rossor and Hecker301, Reference Rogers, Farlow, Doody, Mohs and Friedhoff302, Reference Shimizu, Hanyu, Iwamoto, Koizumi and Abe305, Reference Nakano, Asada, Matsuda, Uno and Takasaki306
Conclusion
Given the potential benefit of early diagnosis and treatment, patients identified as at-risk for MCI warrant testing for abnormalities using neuroimaging or CSF biomarkers. SPECT scans evaluated with quantitative analysisReference Matsuda196 can potentially differentiate MCI likely to progress to AD from stable MCI with an accuracy of approximately 73% prior to clinical signs of significant cognitive impairment. The CSF biomarker p-tau-231 can differentiate MCI of the AD type from controls with a sensitivity of 85% and a specificity of 96%.Reference Blennow and Hampel71, Reference Hertze, Minthon, Zetterberg, Vanmechelen, Blennow and Hansson72 Molecular neuroimaging markers likely will still be of limited value in the diagnosis of early MCI. PiB is a nonspecific marker for amyloid and is found in 22% of controls.Reference Rowe and Villemagne17, Reference Rowe, Ng and Ackermann13418F-FDNNP may have a role here because of its affinity for NFT,145 which are found in the medial temporal lobe early in the disease process.Reference Braak and Braak155 Florbetaben, flutemetamol, and florbetapir do not appear to bind significantly in the medial temporal lobes, the area where AD pathology is thought to begin, but current estimates of accuracy for MCI are 53–70%,161 which is less than that of SPECT with quantitative analysis.Reference Habert, Horn and Sarazin271, Reference Borroni, Anchisi and Paghera278 FDG-PET can predict the conversion of MCI to AD with a sensitivity of 89% and a specificity of 84%.Reference Yuan, Gu and Wei190 Perfusion SPECT can differentiate MCI of the AD-type with a sensitivity of 84% and a specificity of 89%.Reference Johnson, Jones and Holman233–Reference Elgh, Sundstrom, Nasman, Ahlstrom and Nyberg235, Reference Caroli, Testa and Geroldi273
Over the next 15 years, the number of patients with AD will almost triple worldwide. The population affected by MCI will grow to at least 123 million. As evidence accumulates that lifestyle strategies (exercise, reduced number of repetitive concussions), dietary changes (reduced cholesterol), and preventative treatments (anti-inflammatories) can reduce the risk of progression to AD and other dementias, the importance of early identification looms. Identifying those with genetic risk factors will help define the population with the highest need for early diagnosis and monitoring. But as disease mitigating pharmaceuticals become available, early identification of patients with MCI who are likely to benefit will emerge as a critical need. Interrupting the swelling ranks of those affected by dementia will require early diagnosis of MCI and differentiation of those likely to progress and those who are stable. The research presented throughout this article demonstrates that SPECT with quantitative analysis can distinguish these subtypes of MCI with reasonable accuracy. However, cost will become a major factor for all healthcare systems worldwide. FDG-PET imaging is generally more costly than SPECT imaging.Reference Villemagne, Ong and Mulligan11, Reference Pimlott and Ebmeier195, Reference Herholz290, Reference Weih, Degirmenci and Kreil291 The current cost of the only commercially available amyloid marker (florbetapir) is $1,800 (U.S.) per dose.64 In contrast, SPECT is much less expensive and more widely available.Reference Devous191, Reference Devous192, Reference Herholz290, Reference Weih, Degirmenci and Kreil291 The research presented above demonstrates the sensitivity and specificity of SPECT. While the goal for the diagnosis of AD has been 100% accuracy, this reflects the concern of giving an incorrect diagnosis. As our ability to pharmacologically alter the course of these disease processes improves, the burden is shifted to providing an early preliminary diagnosis so that treatment can be initiated early while mitigation of the disease process is still possible. Newer high resolution, low radiation dose SPECT cameras are on the horizon, which will further lower the risk of early diagnosis by SPECT. SPECT can provide an economical strategy for early identification and monitoring. More aggressive research and clinical application of SPECT, particularly with quantitative analysis, is strongly encouraged.
Disclosures
Theodore A. Henderson, MD, PhD, is a consultant to CereScan Corporation. He has received honoraria in the past from Eli Lilly & Co., AstraZeneca, and Bristol-Myer-Squibb.