Introduction
The Mini-mental State Examination (MMSE) was originally proposed as a practical tool for mental state assessment in hospitalized patients (Folstein et al., Reference Folstein, Folstein and McHugh1975). It has probably been the most widely applied cognitive test, both in clinical settings and in epidemiological studies. In clinical settings the MMSE has been mainly used as a screening test for cognitive impairment (CI) or dementia and as a tool to monitor treatment response (McCarten et al., Reference McCarten, Rottunda and Kuskowski2004). In epidemiological studies it has been used to describe the cognitive decline that occurs with age as well as its related factors (Ganguli et al., Reference Ganguli, Yangchun, Hiroko, Ratcliff and Chung-Chou2006).
However, in different studies and populations, the MMSE has been found to have floor and ceiling effects (Tombaugh and McIntyre, Reference Tombaugh and McIntyre1992). MMSE floor effects (MMSE-FE) occur when performance in this test is adversely affected by personal characteristics, independent of cognitive functioning, thereby reducing test specificity. MMSE-FE are frequently seen in persons with poor education. Thus, for instance, the MMSE specificity for dementia detection in Mexicans with less than four years of schooling has been found to be 50% (Ostrosky-Solis et al., Reference Ostrosky-Solis, Lopez-Arango and Ardila2000). Other factors found to be related to MMSE-FE are race and gender (Rosselli et al., Reference Rosselli, Tappen, Williams and Salvatierra2006).
MMSE ceiling effects (MMSE-CE) represent the other side of the coin; they occur when performance in this test is favorably affected by personal characteristics, independent of cognitive functioning, thus reducing test sensitivity. MMSE-CE are frequently seen in persons with mild cognitive impairment (MCI) (van Gorp et al., Reference van Gorp, Marcotte, Sultzer, Hinkin, Mahler and Cummings1999; Xu et al., Reference Xu, Meyer, Thornby, Chowdhury and Quach2002) and occur more frequently in highly educated persons (Crum et al., Reference Crum, Anthony, Bassett and Folstein1993). MMSE-CE have been attributed to the high reliance in the MMSE on verbal items (Xu et al., Reference Xu, Meyer, Thornby, Chowdhury and Quach2002) and its lack of detailed assessment of visuo-constructive abilities and executive functions (Kirby et al., Reference Kirby, Denihan, Bruce, Coakley and Lawlor2001).
Two strategies are commonly used to reduce MMSE-FE associated with education and other demographic variables. The first uses reference scores, specific variables known to increase MMSE-FE such as education, gender and age, against which clinicians can interpret more appropriately the score of a particular patient (Crum et al., Reference Crum, Anthony, Bassett and Folstein1993). Normal MMSE reference values are lower in persons with fewer years of education. The second MMSE-FE reducing strategy relies on incorporating into the final MMSE score the responses to those MMSE items which are sensitive to educational level or other demographic variables (Rosselli et al., Reference Rosselli, Tappen, Williams and Salvatierra2006).
Nevertheless, Cossa et al. (Reference Cossa, Della Sala, Musicco, Spinnler and Ubezio1997) have shown that while adjusting the MMSE score for age and education may increase test specificity it may also produce an even greater reduction in MMSE sensitivity to detect the mildest dementia cases. Therefore, by correcting the MMSE score for educational level, a proportion of poorly educated persons (≤3 years of education) with educationally corrected MMSE scores indicative of normal cognition may in fact have MCI (a ceiling effect after correction in those poorly educated). On the other hand, persons with a few years more education may also fail in the same items as the poorly educated people, and since the same correction is not made on their MMSE scores they may end up being labeled as cognitively impaired when in fact they have normal cognition (a floor effect after correction in those with a few more years of education).
In this study we test this hypothesis in a community sample of Mexican elderly with a high proportion of poorly educated persons. Participants in our study were administered a previously validated Mexican version of the MMSE, with scoring adjusted for educational level (Reyes-Beaman et al., Reference Reyes-Beaman2004). They were also administered the seven-minute screen (7MS), a more recent cognitive screening battery composed of four cognitive subtests: the Benton temporal orientation test, an abbreviated version of the enhanced cued recall test, a clock drawing test and a verbal fluency test (Solomon and Pendlebury, Reference Solomon and Pendlebury1998). Several studies have shown that the 7MS has better psychometric properties than the MMSE, especially in detecting MCI, and seems to be less affected by floor effects associated with education than the MMSE (Meulen et al., Reference Meulen2004; Skjerve et al., Reference Skjerve, Nordhus, Engedal, Pallesen, Braekhus and Nygaard2007). Therefore, in our analysis we used the 7MS as an imperfect gold standard to examine the relationship between education and the MMSE ceiling and floor effects once MMSE scores are corrected for education.
Methods
Participants
Data presented here come from the first wave of a longitudinal study on risk factors for depression in Mexicans aged 60 years and older, who were receiving health care from the largest social security system in Mexico (IMSS). Preliminary results and sampling details are described elsewhere (Garcia-Peña et al., Reference García-Peña2008). Briefly, all study subjects were residents of Mexico City and were selected through a three-stage cluster sampling scheme: (i) an initial random selection of eight family medicine units, (ii) a random selection of 12 consulting physicians’ offices from within each family medicine unit, and (iii) all persons aged 60 years and older registered in the selected consulting offices. A total of 29,340 persons were included in the original sample and contacted at their recorded address. However, only 25% of them were finally interviewed, mainly because of incorrect addresses and non-recorded deaths. After correcting the sampling frame for these errors the response rate was estimated to be 61.5%.
During 2004, trained interviewers conducted face-to-face interviews in the participants’ homes. All participants answered an initial questionnaire that gathered sociodemographic data and assessed participants on several health-related scales, including the Mexican version of the MMSE, the 30-item Geriatric Depression Scale (GDS) (Yesavage et al., Reference Yesavage1982–3) and the Short Anxiety Screening Test (SAST) (Sinoff et al., Reference Sinoff, Ore, Zlotogorsky and Tamir1999). Cut-off points used in the original versions of these scales were used to establish the presence of depression (GDS score ≥11 points) and anxiety (SAST score ≥24 points).
Two groups of roughly the same number of participants were formed using these criteria: the depression/anxiety group (D/A group) and the non-depression/non-anxiety group (Non-D/A group). On the same day of MMSE administration, 91.2% of participants in the D/A group answered a second questionnaire with questions on medically diagnosed conditions, health care utilization and the 7MS. In contrast, because the Non-D/A group is a random sub-sample of participants scoring negative for depression and anxiety, taken at weekly intervals, a new visit to the participants had to be rescheduled for 7MS administration. As a consequence, in the Non-D/A group the 7MS was administered an average of 38.5 days after the MMSE. To reduce the effect of true changes in cognitive status over time on MMSE-7MS comparisons, we consider in this report only those observations in any of these groups with a time span between test administrations not exceeding 12 weeks. Additionally, because the presence of depressive symptoms could differentially affect performance on these cognitive tests, we performed MMSE-7MS comparisons separately in each group in most analyses.
Measurements
We used a previously validated Mexican version of the MMSE (Reyes-Beaman et al., Reference Reyes-Beaman2004). The main difference in the Mexican version of the MMSE is that correct points are granted to poorly educated persons, regardless of their response to the following MMSE items: serial sevens, follow a written instruction, read a sentence and copy a design. Based on this validation we did not administer these items to poorly educated participants. This scoring strategy showed the highest sensitivity (97%) and specificity (88%) for a diagnosis of CI independently performed by a psychiatrist (Reyes-Beaman et al., Reference Reyes-Beaman2004). The rest of the MMSE items were scored as usual, with no answers and refusals being considered as errors (Fillenbaum et al., Reference Fillenbaum, George and Blazer1988). Conventional MMSE cut-off points for CI (<16 moderate, 16–23 mild, 24–30 no CI) were used.
The Mexican version of the 7MS is a translation of the original version with back translation into English and review by a bilingual expert committee to ensure language equivalence. Items and scoring were the same as in the original version. The 7MS total score was obtained through the logistic equation provided by Solomon and Pendlebury (Reference Solomon and Pendlebury1998). Several validation studies indicate that the 7MS has better sensitivity than the MMSE to detect CI, especially MCI, and a slightly lower specificity than the MMSE. In the original validation of a U.S. sample, the 7MS showed a sensitivity of 92% and a specificity of 96% for Alzheimer's disease detection. A more recent 7MS validation, conducted in a population-based sample of Spanish elderly, also reports similar sensitivity (100%) and specificity (95%) figures for Alzheimer's disease detection (del Ser et al., Reference del Ser, Sanchez-Sanchez, Garcia de Yebenes, Otero and Munoz2006). In a Dutch validation, which included several types of dementia (Meulen et al., Reference Meulen2004) and MMSE administration, the 7MS had higher sensitivity than the MMSE for detecting any type of dementia (91% vs. 66%, respectively). In addition, the 7MS was even better than the MMSE in terms of sensitivity to detect mild dementia cases. In the same study, 7MS specificity was somewhat lower than that of MMSE (94% vs. 97%).
Statistical analysis
To facilitate score comparisons between cognitive tests in a similar metric, 7MS continuous scores were rescaled to equate the conventional discrete MMSE score. 7MS scores were rescaled using equipercentile equating (Kolen and Brennan, Reference Kolen and Brennan2004). This rescaling also considered the fact that CI is indicated by low scores on the MMSE and by high scores on the 7MS. To rescale the 7MS score we initially ranked all the available observations from lowest to highest, based on the MMSE score, and noticed the ranks corresponding to each MMSE discrete score. Next, we ranked the observations from highest to lowest, based on the 7MS logistic score, and assigned an equivalent MMSE score, based on the previously identified ranks corresponding to each MMSE score.
Having the scores of both tests on a similar metric allowed us to assess their agreement by subtracting the equated 7MS score (E7MS) from the corresponding MMSE score (MMSE-E7MS score difference). Since the 7MS has been found to have better sensitivity than the MMSE for detecting CI (see above), especially MCI, positive MMSE-E7MS differences, particularly the most extreme, were assumed to indicate probable MMSE-CE in most cases. In addition, since 7MS specificity in a Spanish-speaking population has been found to be 95% (see above) whereas the Mexican MMSE we used has 88% specificity, we assumed that at least the most negative MMSE-E7MS differences were indicative of probable MMSE-FE in most cases.
We determined which participant's variables and MMSE and 7MS subscales were related to the observed MMSE-E7MS score differences through an ordinal logistic regression model (Hosmer and Lemeshow, Reference Hosmer and Lemeshow2000). In this model the response variable (MMSE-E7MS score differences) is assumed to be an ordinal measurement. As a particular predictor increases its value in one unit, its associated coefficient can be interpreted as the expected change in the log-odds of falling into a particular category of the response variable compared to falling into the preceding lower category. These coefficients are assumed to be constant across transitions in the response variable, an assumption that was found to be adequate in our analyses. Thus, ultimately, positive predictor coefficients indicate an increased likelihood that observations with higher values in the predictor will be in a higher category of the response variable. Conversely, negative predictor coefficients indicate an increased likelihood that observations with higher values in the predictor will be in a lower category of the response variable.
Ordinal logistic regression models were fitted separately for the D/A Group and the Non-D/A Group. In both groups, these models were built starting with a saturated model, including terms for educational level, age group, gender, and the time span between administration of the tests, medical history of hypertension, diabetes, previous stroke, Parkinson's disease and hypo or hyperthyroidism, as well as current alcohol or psychotropic drug use, several recent neurological symptoms and CNS medication.
The saturated model also included terms for the four subtests composing the 7MS and six MMSE subscales. MMSE subscales were constructed using the results from a tetrachoric factor analysis reported by Jones and Gallo (Reference Jones and Gallo2000). Raw MMSE and 7MS subscale scores were rescaled to z-scores to evaluate their effect on the MMSE-E7MS score differences using a similar metric.
Model reduction and group-predictor interaction detection were guided by likelihood ratio (LR) tests. Using these tests, all statistically significant predictors found at least in one of the two groups were included in the models presented here.
Unconditional logistic regression models were also used to examine the relationship between the prevalence of poorly educated participants as a function of MMSE-E7MS score differences and demographic and health status covariates possibly affecting cognitive test performance.
This study was approved by the Ethics Committee of the Instituto Mexicano del Seguro Social (IMSS). Informed consent was sought from all participants and confidentiality maintained according to international ethical standards.
Results
MMSE and 7MS tests were serially administered to 1,395 participants in the D/A group and 1,416 participants in the Non-D/A group. Twelve observations were not analyzed because some parts of the two cognitive tests were not appropriately administered. In addition, we did not analyze 341 observations (337 in the Non-D/A Group) because the time span between the administration of both cognitive tests exceeded 12 weeks. After these exclusions we analyzed 2,458 observations of which 1,382 corresponded to the D/A Group. In our analyzed population, 49.5% comprised persons younger than 70 years, 38.1% aged between 70 and 79 years, and 12.4% aged 80 and older. Roughly two-thirds were female and 48.3% had three or less years of education.
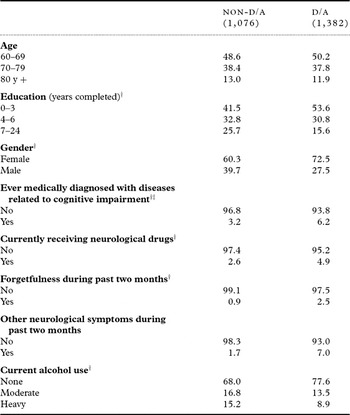
Table 1 compares the distribution of factors potentially related to cognitive test performance in the Non-D/A and the D/A groups. Except for age, statistically significant differences were found in the distribution of factors presented in the table. Compared to individuals in the Non-D/A group, the D/A group showed a higher proportion of females and poorly educated persons. It also showed a higher proportion of participants with diseases related to CI, of persons taking neurological drugs, and of those reporting forgetfulness and other neurological symptoms. Conversely, alcohol use was more prevalent in the Non-D/A group.
Factors potentially related to cognitive test performance in non-D/A and D/A Mexican elderly

†Groups significantly different in Fisher's exact test (p<0.01).
‡Previous stroke, Parkinson's disease, hypo or hyperthyroidism.
Non-D/A = non-depression/non-anxiety group; D/A = depression/anxiety group.
In the entire analyzed sample, observed MMSE scores ranged from 10 to 30. When the equated 7MS scores were subtracted from the corresponding MMSE scores, only 290 (11.8%) observations had a difference of zero. MMSE-E7MS score differences ranged between −13 and 13, with negative differences of high value indicating probable MMSE-FE and high value positive MMSE-E7MS differences indicating probable MMSE-CE. MMSE-E7MS differences lower than −6 were observed in 1.7% of observations, whereas score differences greater than 6 were observed in 0.9% of observations. Therefore, probable MMSE-FE was more likely at these extreme differences than probable ceiling effects. Additionally, MMSE-E7MS differences of −4 or less were also more frequent than score differences of 4 or more (13.4 vs. 11.6%, respectively).
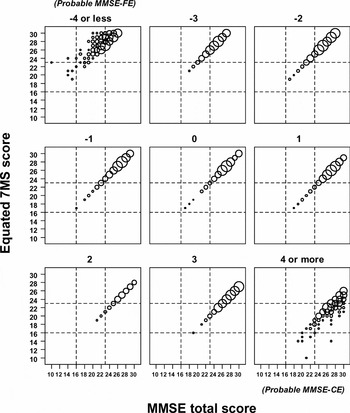
Figure 1 shows scatter plots of scores on both tests for groups defined by the MMSE-E7MS differences. In both tests, observations tended to concentrate on the no-CI category and less frequently on the mild CI category. As the absolute MMSE-E7MS score difference increased in value, observations were generally classified as mild CI in one test and no CI in the other. These classification disagreements were seen more frequently in the case of MMSE-E7MS differences greater than or equal to an absolute value of 4. More extreme disagreements (normal functioning in one test and moderate CI in the other) were less frequently seen.
Scatter plots for MMSE and E7MS scores according to the difference between them (MMSE score minus Equated 7MS score).
Extreme negative MMSE-E7MS score differences suggest a MMSE floor effect. Extreme positive MMSE-E7MS score differences suggest a MMSE ceiling effect. Dot size is proportional to the number of observations. Dashed lines represent conventional MMSE cutoff points for a normal test result (score 24 and higher), a test indicating mild CI (score 16 to 23) or moderate CI (score 15 and lower).

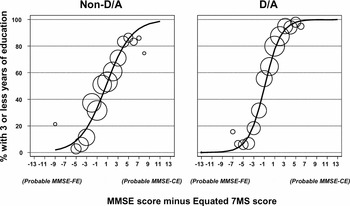
MMSE-E7MS differences were independently related to educational level in logistic regression models including either dummy terms for MMSE-E7MS score differences or a single difference term (Figure 2). Adjusting for the factors related to cognitive test performance presented in Table 1, poorly educated participants tended to be progressively more prevalent on the side of positive MMSE-E7MS differences reflecting probable MMSE-CE. This relationship was clearer in the D/A group where a more consistent and gradual increase in the percentage of poorly educated persons was observed as the score differences increased, and a higher proportion of poorly educated persons with more extreme positive differences was observed than in the Non-D/A group. Figure 2 also shows that the proportion of poorly educated persons is adequately modeled by including a single MMSE-E7MS difference term in the logistic regression model. Thus the relationship between the log-odds of poorly educated persons and the score differences is approximately linear.
Adjusted percentages of persons with 3 or less years of education in each of the MMSE-E7MS score difference categories.
Percentages were obtained through logistic a regression model with adjustment for age, gender, days between administration of cognitive tests, alcohol use as well as symptoms, medications and diseases related to cognitive test performance, using the mean values of these confounders observed in the entire analyzed sample. Dots show adjusted percentages obtained in a logistic regression including dummy terms for MMSE-E7MS score differences. Dot size is proportional to the number of observations. The line depicted in each graph represents the adjusted percentage of poorly educated persons obtained in a logistic regression model treating the MMSE-E7MS score differences as a single term.

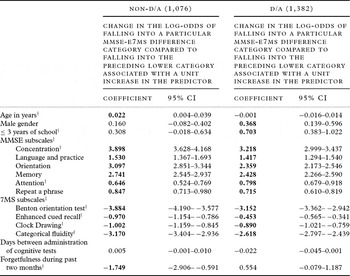
Table 2 presents the results of multivariate ordinal logistic regression models, separately fitted in the Non-D/A and the D/A groups, to identify independent predictors of MMSE-E7MS differences. Coefficients are presented in terms of changes in the log-odds of falling into a particular MMSE-E7MS difference category compared to falling into the preceding lower category associated with a unit increase in the predictor. Positive changes in log-odds indicate that higher predictor values are more likely in the higher values of MMSE-E7MS differences suggesting MMSE-CE. Conversely, negative changes in log-odds indicate that higher predictor values are more likely in the lower values of MMSE-E7MS differences suggesting MMSE-FE.
Independent predictors of MMSE-E7MS score differences in an ordinal logistic regression model

†Predictor effect on MMSE-E7MS differences was found to be significantly different between the Non-D/A and the D/A group (p < 0.05), using Likelihood Ratio tests.
‡Expressed as Z scores.
Non-D/A = non-depression/non-anxiety group; D/A = depression/anxiety group.
In the Non-D/A group, older persons had a higher likelihood of being on the side of MMSE-E7MS differences indicating MMSE-CE (coefficient = 0.022). This age effect was not seen in the D/A group (LR test p-value >0.05). In both groups, males were more likely than females to fall in the score differences suggesting MMSE-CE as were also poorly educated persons. However, these findings were statistically significant only in the D/A group.
Again in both groups, all standardized MMSE subscales were also positively related to MMSE-E7MS differences indicating MMSE-CE. High multivariate coefficients were found for the Concentration, Orientation and Memory subscales and to a lesser extent for the Language and Praxis subscale. In addition, the coefficient for the Concentration subscale was 21% higher in the Non-D/A than in the D/A group, whereas the corresponding coefficient for the Attention subscale was 22% lower in the Non-D/A than in the D/A group (likelihood ratio (LR) test for interaction p-value < 0.05).
On the other hand, all standardized 7MS subscales showed negative adjusted coefficients in the multivariate ordinal logistic regression models in the two groups defined by the presence of depression/anxiety. This indicates that greater values in these subscales (better performance) were more likely in persons with negative MMSE-E7MS differences suggesting MMSE-FE. The Benton Orientation test and the Categorical Fluidity 7MS subscales showed the highest association with MMSE-FE in both groups. The LR test for group-predictor interactions showed that all 7MS subscales showed a stronger relationship with floor effects in the Non-D/A group.
MMSE-FE were also independently associated with the report of recent forgetfulness only in the Non-D/A group.
Discussion
The aim of this study was to test the hypothesis that correcting MMSE scores for educational level to remove floor effects in poorly educated persons may introduce ceiling effects for them and floor effects for those with more years of education. We therefore compared the scores obtained using the Mexican version of the MMSE with the equated scores obtained using the 7MS, a cognitive test with better psychometric properties than the MMSE.
Our results indicate that, after correcting for educational level, the MMSE still has ceiling and floor effects, both of which occur with a similar frequency. More importantly, as expected, the educational level correction in our MMSE Mexican version changed the usual relationship between education and MMSE performance. We found that poorly educated participants were much more likely to show ceiling effects and, by implication; better educated persons were much more likely to show floor effects. This finding was observed more clearly in the D/A group but was also seen in the Non-D/A group and was not explained by age or gender – both of which are health status covariates known to affect MMSE performance (Marcopulos et al., Reference Marcopulos, Gripshover, Broshek, McLain and Brashear1999) – nor by differential timing in the administration of the 7MS.
However, one limitation of our analysis is that our results might be affected by the use of the 7MS as a “gold standard” of cognitive function. Even when other studies have found a marginal effect of education on 7MS performance (Meulen et al., Reference Meulen2004; Skjerve et al., Reference Skjerve, Nordhus, Engedal, Pallesen, Braekhus and Nygaard2007), this finding might not apply to our sample, which contained a much higher proportion of participants with three years or less of education. Performance in verbal and other components of the 7MS is also likely to be affected by floor effects (Strauss et al., Reference Strauss, Sherman and Spreen2006), especially in poorly educated persons (Ardila, Reference Ardila1998; Ostrosky-Solis et al., Reference Ostrosky-Solis, Lopez-Arango and Ardila2000). On the other hand, recent epidemiological and imaging studies have found that education has a true impact on the rate of age-related cognitive decline and on the clinical onset of Alzheimer's disease (AD). Better educated persons show faster rates of cognitive decline than persons with less education (Andel et al., Reference Andel, Vigen, Mack, Clark and Gatz2006). Also, at the same levels of brain pathology, highly educated persons show a later onset of clinical AD than those with poor education (Roe et al., Reference Roe, Mintun, D'Angelo, Xiong, Grant and Morris2008). Both findings are consistent with the concept that education increases the ability of the individual to cope with brain pathology or age-related changes by stimulating the creation of alternate brain networks to perform the same tasks, thus increasing his/her “cognitive reserve” (Stern, Reference Stern2006).
Therefore, we decided not to correct the 7MS scores for education, since education has an effect not only on cognitive test performance but also on cognitive functioning, and no published studies exist to correct 7MS scores for education. The effect of not performing this correction on the 7MS scores in our analyses would be that a proportion of the ceiling and floor effects we attributed to the MMSE score correction for educational level can rather be attributed to the 7MS ceiling and floor effects related to education present in this test. However, at least in the populations where the 7MS has been validated, it has shown fewer floor effects and much fewer ceiling effects related to educational level than the MMSE. As a consequence, we believe that most of the MMSE floor and ceiling effects we identified through our analysis have resulted from the MMSE correction for educational level and that the finding of ceiling effects in poorly educated persons and floor effects in persons with better education would hold had the 7MS scores been corrected for education.
Our results are likely to be generalized to other versions of the MMSE using different strategies to deal with floor effects in poorly educated persons, since they tend to perform badly in the concentration items of the test which we found most related to MMSE-E7MS disagreements. In addition, results from our analysis can be directly generalized to community-based samples with a high proportion of poorly educated participants and a relatively low prevalence and severity of CI.
Our results also have important implications both for epidemiological studies and for clinical settings using the MMSE as a cognitive test. For instance, after correction for education, MMSE-CE effects (more likely in poorly educated persons) may be responsible for the high variability in individual rates of change since such effects tend to occur more frequently in early CI observed in epidemiological studies (Galasko et al., Reference Galasko, Gould, Abramson and Salmon2000). In addition, educationally corrected MMSE scores may distort the relationship between education and cognitive decline by introducing a differential misclassification of cognitive function as noticed in longitudinal studies (Galasko et al., Reference Galasko, Gould, Abramson and Salmon2000). Also, our findings suggest that in clinical settings using educationally corrected versions of the MMSE the least educated and older elderly may need additional cognitive testing to rule out MCI. But the possibility of false-positive results in more educated and younger persons may also require additional testing of them.
More research is needed to examine the effect of correcting the MMSE for education or other demographic variables on ceiling and floor effects. In addition, there is a need to evaluate 7MS floor effects in poorly educated samples before recommending its use as a substitute for the MMSE as a cognitive test. Finally, it is still unclear the extent to which poor performance in cognitive test evaluation observed in poorly educated people can be attributed to the testing and how much can be attributed to a real effect of education on cognition.
Conflict of interest
None
Description of authors’ roles
F. Franco-Marina initiated the idea for this study, designed the research proposal, undertook the data analysis and prepared the manuscript. J.J. García-Gonzalez, O. Ugalde, S. Sanchez-García, Claudia Espinel-Bermudez and T. Juárez-Cedillo contributed to the research proposal, reviewed the analysis, and participated in the preparation of the manuscript. F. Wagner-Echeagaray, J.J. Gallo and Miguel Ángel Villa Rodríguez participated in the interpretation of the data and in the discussion of the paper. C. Garcia-Peña designed and conducted the original proposal and was involved in the data analysis and in the preparation and discussion of the manuscript.
Acknowledgments
This project was supported by grants from CONACYT (México) 2002-CO1–6868, Mexican Institute of Social Security (IMSS 2002–382), and NIH-FIRCA R03 TW005888. Dr. Wagner was funded through grant DA 17796–01 from NIDA and P60-MD002217–01 from the NCMHHD.