

Political scientists argue that the partisan–ideological Right—not least in reaction to Barack Obama—remains prejudiced against racial minorities and other disadvantaged groups (Parker and Barreto Reference Parker and Barreto2013; Tesler Reference Tesler2016). In 2016, support for Donald Trump was associated with negative racial attitudes and “hostile sexism” (Abramowitz Reference Abramowitz2018; Schaffner, MacWilliams, and Nteta Reference Schaffner, MacWilliams and Nteta2018). For public opinion researchers, the de facto null hypothesis is that 2016 was about prejudice.
However, if Republicans and Democrats see politics as a contest between warring groups (Achen and Bartels Reference Achen and Bartels2016; Mason Reference Mason2018), then Democrats and Republicans should have different—but equally group-centric and prejudiced—ways to evaluate the opposition. For this reason, analyses of prejudice in presidential politics must be sufficiently fine-grained. We must assess the magnitude of distinct prejudices, the different groups that prejudice might target, and the heterogeneous expression—rather than the presence or absence—of prejudice within the major parties. Although political scientists rarely make the claim outright, we are at risk of accepting an oversimplified narrative: first, that the Right is motivated by animus toward non-white others; and, second, that the Left is free of prejudice toward marginalized groups. This article highlights one manner in which prejudice might manifest: that is, unwillingness to support a presidential candidate from a historically underrepresented group. Using list experiments on the 2008 and 2012 Cooperative Campaign Analysis Project (CCAP), we explored which voters—Republican or Democratic, conservative or liberal—are unwilling to support candidates from different marginalized groups.
Our findings add nuance to how we understand out-group animus among Republicans and Democrats. Most surprising, our conservative and Republican respondents did not indicate a strong propensity to oppose an African American. Our data indicate that in both 2008 and 2012, less than 45% to 50% of Right-leaning voters were uncomfortable with an African American candidate (per se). Similarly, in 2008, no partisan or ideological groups indicated strong discomfort with a female candidate.
However, prejudice was revealed in our findings—in dramatic fashion. Among conservative and Republican respondents, gay and Muslim candidates were extreme “red flags.” Comparably, among liberal and Democratic respondents, we found widespread unwillingness to support a Mormon for president—indicating, perhaps, that liberal Democrats are warier of Mormons in political life (Campbell, Green, and Monson Reference Campbell, Green and Monson2014). Furthermore, when we aggregated respondents across sensitive-item conditions, significant proportions of Left- and Right-leaning respondents viewed candidates’ identities as legitimate reasons for opposing them.
Results indicate that prejudice in presidential politics is more complicated than Trump’s success suggests. Republicans and Democrats each may be willing to reject presidential candidates on the basis of their descriptive identities. To our knowledge, this is the first analysis to use repeated list experiments—fielded before the election and the reelection of the first African American president—to document these effects. By examining attitudes toward marginalized groups across the partisan–ideological divide in consecutive presidential elections, we gain a deeper understanding of the role that prejudice plays in contemporary American politics.
Results indicate that prejudice in presidential politics is more complicated than Trump’s success suggests. Republicans and Democrats each may be willing to reject presidential candidates on the basis of their descriptive identities.
LIST EXPERIMENTS AND CANDIDATE ASSESSMENTS: STATE OF KNOWLEDGE
In a country in which children are told that “anyone can grow up to be president,” citizens might be uncomfortable admitting that they would deny this opportunity to members of particular groups. For this reason, scholars often use list experiments to determine whether presidential candidates’ descriptive characteristics make citizens reluctant to support them.
When properly designed and executed, list experiments assess the prevalence of socially undesirable attitudes without requiring respondents to indicate their prejudice directly (Kuklinski, Cobb, and Gilens Reference Kuklinski, Cobb and Gilens1997). In the control condition, respondents see K items and are asked how many elicit a negative response. In the treatment condition, respondents see K + 1 items with the same unobtrusive prompt. The additional item in the treatment condition involves a sensitive subject about which respondents might be reluctant to reveal their true feelings. Traditionally, the difference of means (in item count) between treatment and control is interpreted as the proportion of the population bothered by the sensitive item (Sniderman and Carmines Reference Sniderman and Carmines1997).
In recent years, list experiments examined prejudice against African American and female presidential candidates, as well as candidates from minority religious traditions. Perhaps because these experiments differ in the wording of questions and execution, findings have been mixed. Nevertheless, several trends emerge.
First, although negative racial attitudes persist (Tesler Reference Tesler2016), some experiments have found relatively low discomfort with an African American presidential candidate. Several list experiments, fielded during the 2008 presidential campaign, indicate that citizens (including whites) were unbothered by a hypothetical black candidate (Benson, Merolla, and Geer Reference Benson, Merolla and Geer2011; Martinez Reference Martinez2009).
Other studies, however, are less sanguine. Similar experiments indicate that 30% of whites were bothered by the fact that Barack Obama “would be the first black president” if elected (Redlawsk, Tolbert, and Franko Reference Redlawsk, Tolbert and Franko2010), and that only 70% of citizens were “willing to support a black presidential candidate” (Heerwig and McCabe Reference Heerwig and McCabe2009). Yet, notably, even these pessimistic findings find room for optimism. Heerwig and McCabe (Reference Heerwig and McCabe2009) showed that tolerance for an African American presidential candidate increases with educational attainment, and Redlawsk, Tolbert, and Franko (Reference Redlawsk, Tolbert and Franko2010) suggested that Obama’s unique appeal made racially resentful whites more sympathetic to his campaign.
Second, list experiments indicate that citizens have grown more tolerant toward female presidential candidates. Streb et al.’s (Reference Streb, Burrell, Frederick and Genovese2008) use of a list experiment fielded in 2006 serves as a baseline. They concluded that 26% of Americans were resistant to a woman serving as president. Moreover, because their experiment asked about an extreme emotion (i.e., being “angry or upset”), Streb et al. (Reference Streb, Burrell, Frederick and Genovese2008) suggested that 26% underestimated the number of Americans with some reservation about a female commander in chief.
In the intervening years since 2006, however, list experiments indicate greater tolerance for female candidates. These results may be due to Hillary Clinton’s emergence as a viable contender for the White House. Less than two years after Streb et al.’s (Reference Streb, Burrell, Frederick and Genovese2008) experiment, Benson, Merolla, and Geer (Reference Benson, Merolla and Geer2011)—using different list experiments—reported no significant prejudice against a female presidential candidate. Furthermore, repeating Streb et al.’s (Reference Streb, Burrell, Frederick and Genovese2008) experiment in March 2016, Burden, Odo, and Yamada (Reference Burden, Ono and Yamada2017) estimated that only 13% of citizens felt angered by a female president, with Democratic identifiers showing especially minimal bias.
Third, other list experiments suggest that Americans reserve their strongest prejudice against candidates from minority religious backgrounds. This pattern has limits; Kane, Craig, and Wald (Reference Kane, Craig and Wald2004) found scarce evidence that citizens are prejudiced against Jewish candidates. However, Benson, Merolla, and Geer (Reference Benson, Merolla and Geer2011) found sharp resistance to atheist, Muslim, and Mormon candidates. Their data suggest that these prejudices are concentrated among two subpopulations: citizens who rarely interact with members of these groups and evangelical Southerners threatened by religious outsiders. Of course, given Mitt Romney’s ascent to prominence during the 2007–2008 presidential primaries, “Mormon” was likely the most salient religious identity against which Benson, Merolla, and Geer (Reference Benson, Merolla and Geer2011) found significant prejudice. During this same period, Monson and Riding (Reference Monson and Riding2009) reported that 25% of citizens were uncomfortable with a Mormon presidential candidate.
Our project expands and builds on these findings. Using list experiments fielded in 2008 and 2012, we investigated whether prejudice against African American candidates amplified or declined between President Obama’s election and reelection campaigns; whether prejudice toward female candidates is as muted as research suggests; and whether Benson, Merolla, and Geer (Reference Benson, Merolla and Geer2011) were correct that citizens reserve the most skepticism for Mormon and Muslim candidates. In addition, we examined prejudice against gay candidates—a noteworthy omission from the previously mentioned literature. Our goal is simple: to shed more light on the nature of prejudice and tolerance in presidential politics—and, especially, to examine the nature of prejudice on both sides of the partisan–ideological divide.
DATA AND METHODS
On the 2008 and 2012 CCAP (Schmidt and Carmines Reference Schmidt and Carmines2020), we randomly assigned participants to one of five list-experiment conditions. In the baseline condition, respondents read the following prompt:
How many of the following characteristics would make you more likely to vote against a candidate for President? We don’t want to know which ones, just how many of the four:
-
A candidate who is over 75 years old.
-
A candidate who has not held political office.
-
A candidate who does not have a college education.
-
A candidate who is wealthy enough to finance their own campaign.
The additional four treatments each concerned one sensitive item, directing respondents to indicate “how many of the five” items made them more likely to vote against a presidential candidate. In 2008, these items asked about African American, “gay or homosexual,” Muslim, and female candidates. In 2012, we substituted “a candidate who is Mormon” as the fourth sensitive item.Footnote 1 The 2008 (n=1,338) and 2012 (n=1,000) modules yielded approximately 250 and 200 respondents (respectively) per condition. (See the online appendix for complete information about sample sizes.)
To analyze each experiment, we subset the data into respondents assigned to the baseline and each particular sensitive-item condition.Footnote 2 Next, we modeled item count as a linear function of assignment to treatment. In general, randomization achieved balance across key covariates, obviating the need for additional righthand-side controls. (However, see the online appendix for results from ANOVA tests for balance and robustness checks using models that control for potential confounding variables.) Throughout, we used normal linear regression in zelig (Choirat et al. Reference Choirat, Gandrud, Honaker, Imai, King and Lau2016) to simulate treatment effects, using the R platform (R Development Core Team Reference Team2008). We graphed the estimated first differences generated by these simulations; where the confidence intervals did not overlap zero, we asserted a statistically significant, prejudiced response to the sensitive item.Footnote 3
Most important, we divided respondents by partisanshipFootnote 4 or ideology. Political scientists argue that the partisan–ideological coalitions are based around strong in-group identities and out-group resentments (Iyengar, Sood, and Lelkes Reference Iyengar, Sood and Lelkes2012; Mason Reference Mason2018). Consistent with this framework, we tested how biases manifest among Left- and Right-leaning respondents. Because partisanship and ideology are strongly correlated (Sniderman and Stiglitz Reference Sniderman and Stiglitz2012), we used separate models to assess treatment effects, as follows:
 $$ \ Item\ Count={\beta}_0+{\beta}_1\times Republican+\kern0.5em {\beta}_2\times Democrat+{\beta}_3\times Treatment+{\beta}_4\times Republican\times Treatment+{\beta}_5\times Democrat\times Treatment+\Eulerconst $$
 $$ \ Item\ Count={\beta}_0+{\beta}_1\times Conservative+{\beta}_2\times Liberal+{\beta}_3\times Treatment+{\beta}_4\times Conservative\times Treatment+{\beta}_5\times Liberal\times Treatment+\Eulerconst $$
To be sure, list experiments have prominent detractors (Gelman Reference Gelman2014). The difference-of-means estimator has fallen out of fashion in favor of maximum-likelihood estimation strategies that yield more efficient estimates by pooling respondents from multiple sensitive-item treatments into a multivariate regression. Yet, our experience indicates that the inferential leverage of these techniques decreases with smaller sample sizes. Moreover, Ahlquist (Reference Ahlquist2018) noted that compared to one popular estimator (Blair and Imai Reference Blair and Imai2012), simpler approaches may have fewer consequences from nonsystematic measurement error. We would be delighted if this article furthered debate about best practices for list experiments, especially with small to moderate sample sizes.
For the partisan and ideological subgroups, our sample sizes are underpowered for interpreting null effects as a neutral response to the sensitive item. Thus, we used three strategies for interpreting and contextualizing results. First, we interpreted null effects as ruling out very large effect sizes. Using DeclareDesign (Blair et al. Reference Blair, Cooper, Coppock, Humphreys and Fultz2018; Reference Blair, Cooper, Coppock and Humphreys2019), we quantified—for each subgroup analyzed—the average treatment effect (ATE) that can be detected (using the difference-of-means estimator) with 80% power. In the case of null effects, these represent an upper bound on the proportion of the relevant subgroup that had a negative response to the sensitive item. For example, on the 2008 CCAP, Republican identifiers did not show a statistically significant effect in the “woman candidate” list experiment (SATE=0.26; p>0.10); the number of Republicans across both conditions (n=223) is sufficient to reject an effect size greater than 0.38 (see the online appendix for details). In other words, in 2008, less than 38% of Republicans were more likely to vote against a woman presidential candidate.
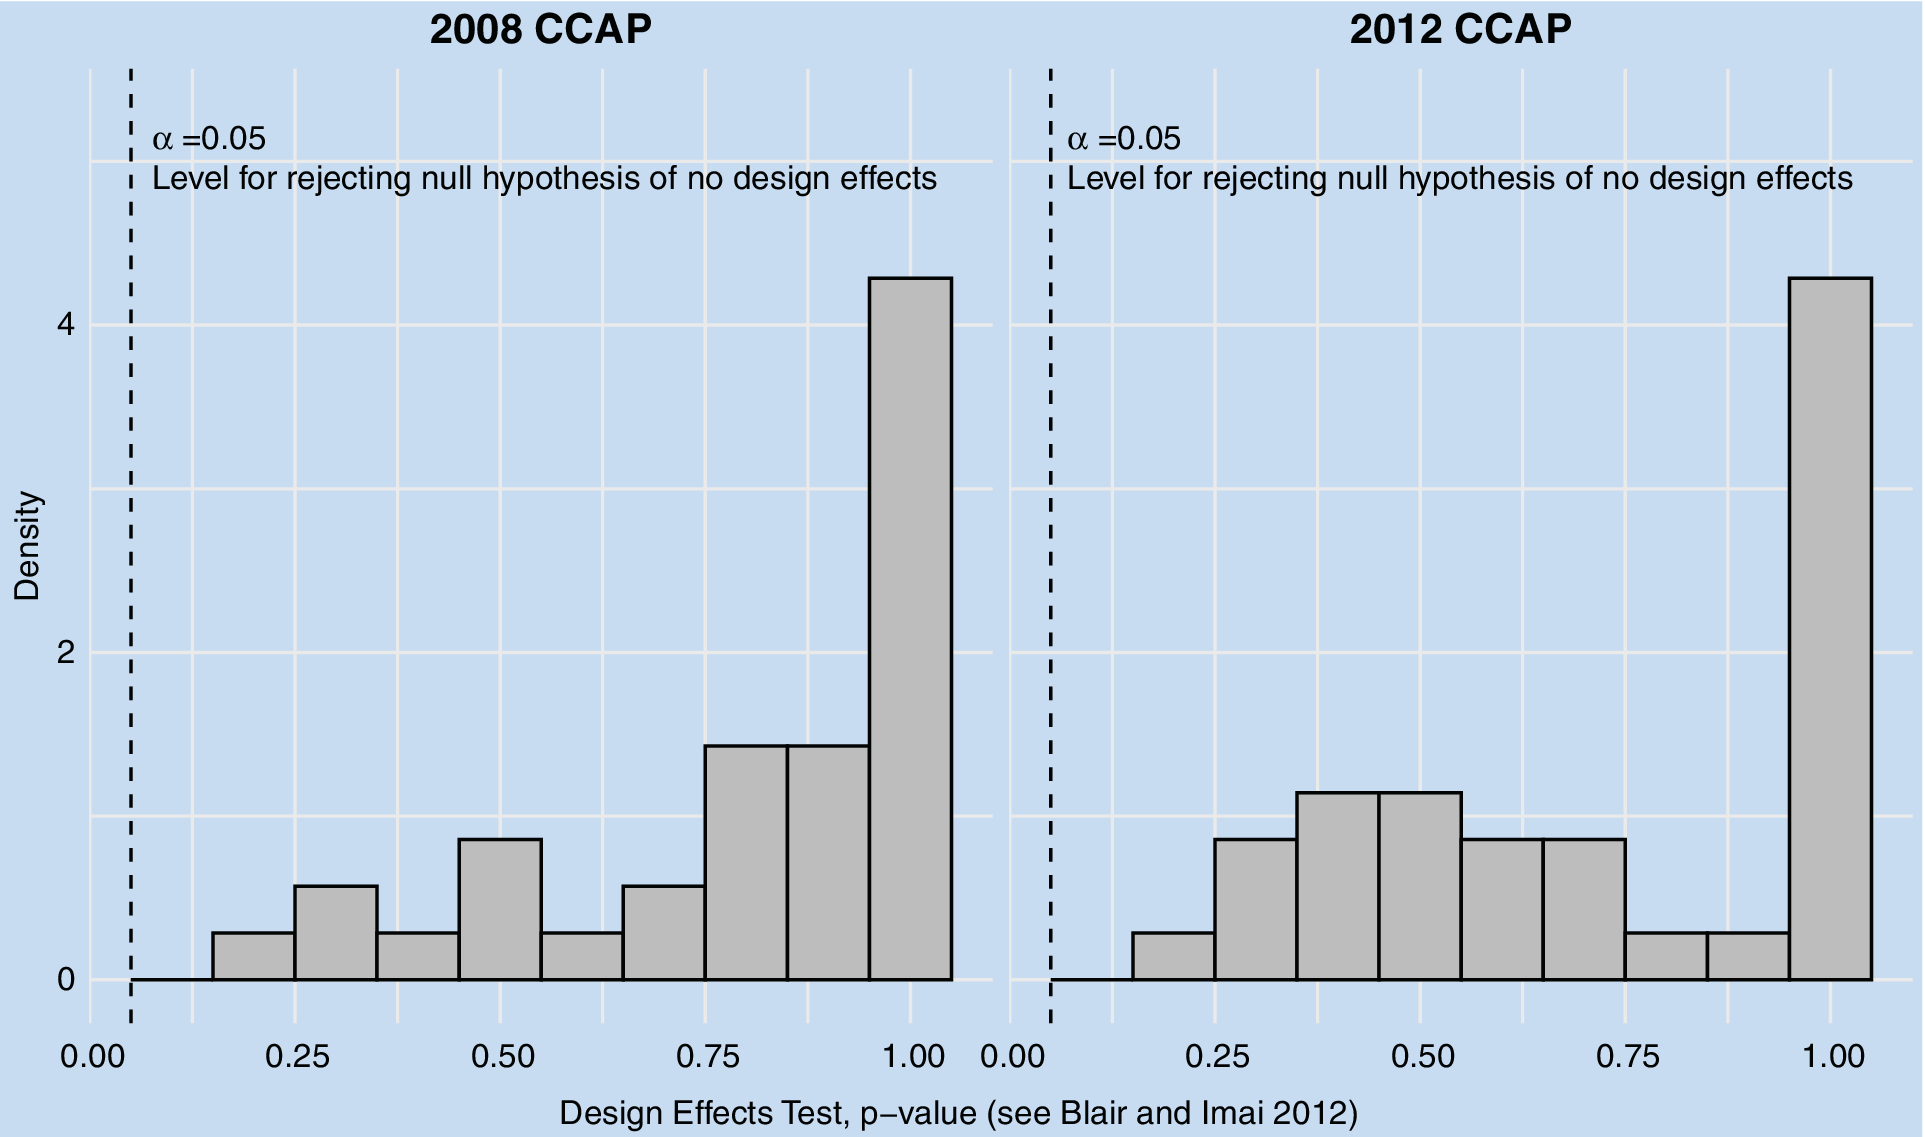
Second, for each subset of voters, we conducted design-effects tests (Blair and Imai Reference Blair and Imai2010) to assess whether respondents were systematically underreporting their item count in the sensitive-item treatments. In no case did these tests yield p-values sufficient for rejecting the null hypothesis of no design effects. Figure 1 plots density histograms of the p-values obtained for these design-effects tests. It is obvious that p-values cannot be compared directly. However, our failure to obtain even one instance of clear design effects—across 70 tests—should assuage concerns that respondents were underreporting their true prejudice.
However, our failure to obtain even one instance of clear design effects—across 70 tests—should assuage concerns that respondents were underreporting their true prejudice.
Density Histograms of p-Values from Design-Effects Tests, All Samples and Subsamples Analyzed (Including Partisan and Ideological Subgroups)

Third, our analysis concluded by pooling respondents across the sensitive-item treatments, estimating generalized prejudice against nontraditional candidates. This enabled more efficient estimates to corroborate our narrative: that Left- and Right-leaning voters are each prepared to oppose presidential candidates on the basis of their descriptive identities.
RESULTS
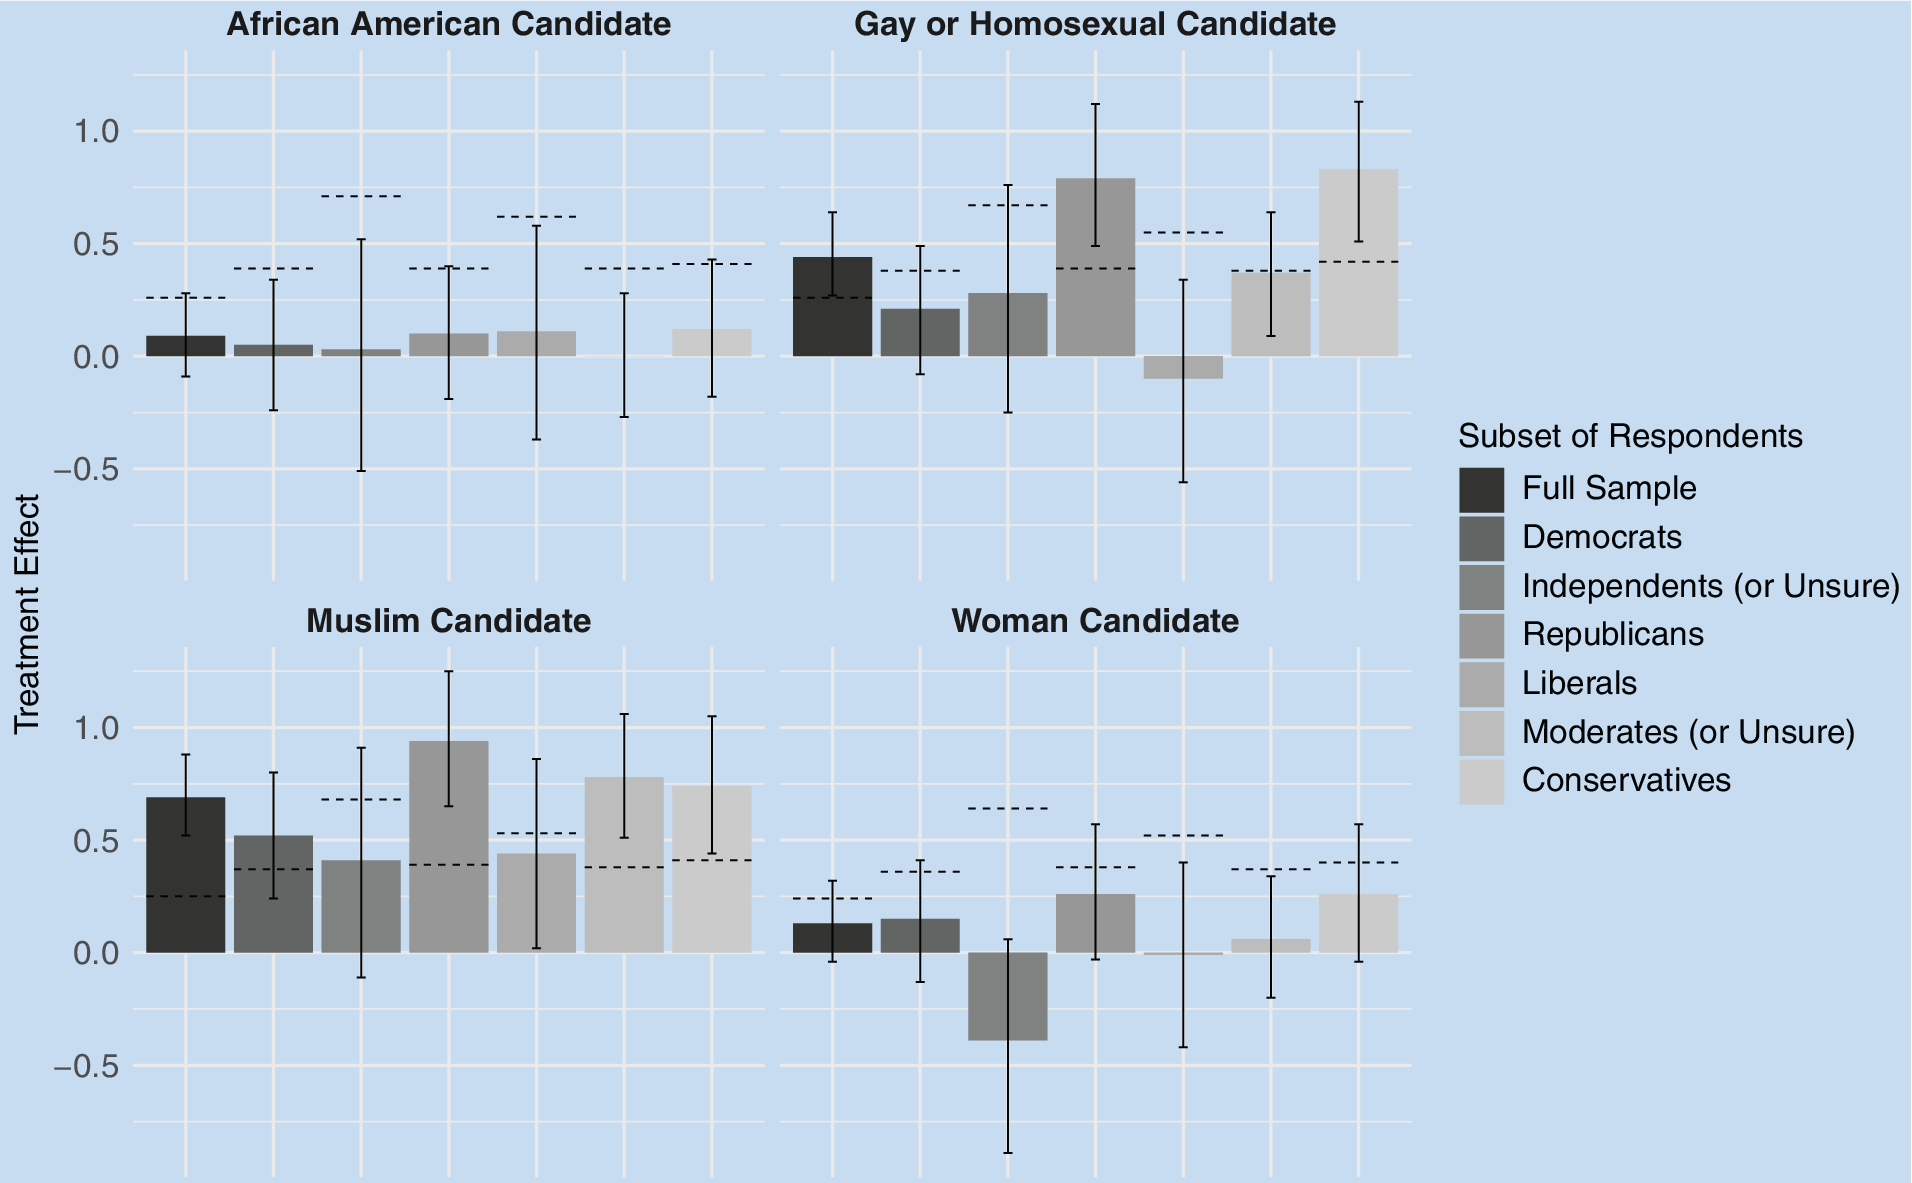
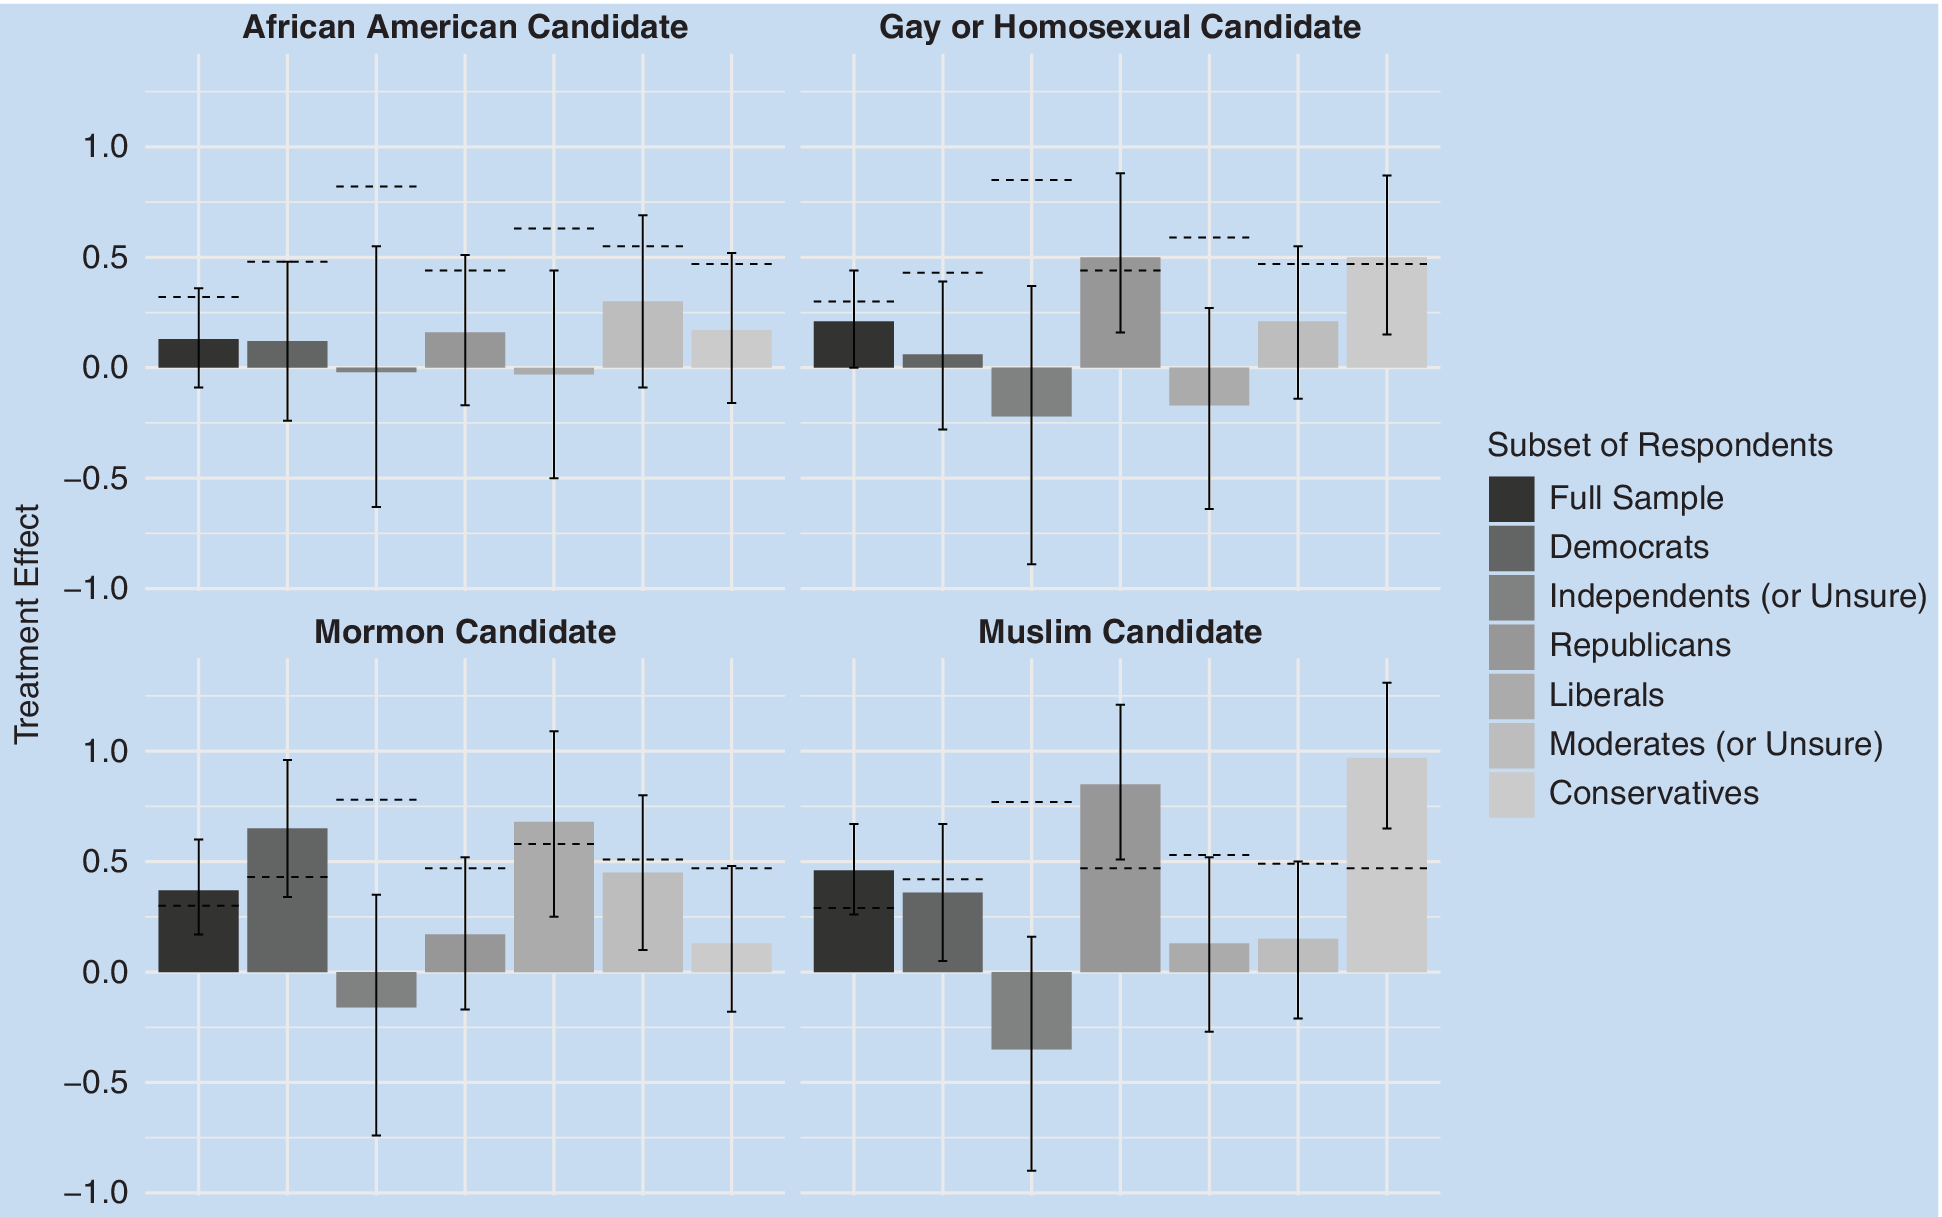
For each experiment, figures 2 and 3 display the estimated treatment effects for the full sample and for each partisan or ideological subgroup in 2008 and 2012, respectively. The figures present 90% confidence intervals indicating whether treatment effects achieved statistical significance. The horizontal dashed lines indicate ATEs that can be detected with 80% power. (Complete regression results are in the online appendix.)
List Experiments, 2008 CCAP: Estimated Proportions More Likely to Vote Against the Candidate in Question
Notes: Horizontal dashed lines indicate effect sizes that each comparison is equipped to detect (given the number of respondents in treatment and control) with 80% power (d=0.80); power analyses conducted using DeclareDesign (Blair et al. Reference Blair, Cooper, Coppock, Humphreys and Fultz2018). Data from the 2008 CCAP (n=1,338). The “African American candidate” list experiment was analyzed using only respondents who did not identify as “Black.” All other list experiments were analyzed using the full sample. Vertical lines indicate 90% confidence intervals produced using normal linear regression in zelig (Choirat et al. Reference Choirat, Gandrud, Honaker, Imai, King and Lau2016). Treatment effects imply the proportion of the sample (or subsample) that was more likely to vote against a candidate that matched the description.

List Experiments, 2012 CCAP: Estimated Proportions More Likely to Vote Against the Candidate in Question
Notes: Horizontal dashed lines indicate effect sizes that each comparison is equipped to detect (given the number of respondents in treatment and control) with 80% (d=0.80) power; power analyses conducted using DeclareDesign (Blair et al. Reference Blair, Cooper, Coppock and Humphreys2019). Data from the 2012 CCAP (n=1,000). The “African American candidate” list experiment was analyzed using only respondents that did not identify as “Black.” All other list experiments were analyzed using the full sample. Vertical lines indicate 90% confidence intervals produced using normal linear regression in zelig (Choirat et al. Reference Choirat, Gandrud, Honaker, Imai, King and Lau2016). Treatment effects imply the proportion of the sample (or subsample) that was more likely to vote against a candidate that matched the description.

First, we addressed null results: cases in which neither the full sample nor any subgroup showed a significant treatment effect. To reiterate, we interpret null effects as evidence against very large effects rather than evidence that prejudice was absent from the sample or subsample.
We found consistently null effects in three cases: the “woman candidate” experiment (fielded in 2008 only) and each iteration (i.e., 2008 and 2012) of the “African American candidate” experiment. Our data imply that in 2008, less than 24% of respondents were more likely to vote against a female candidate. In 2008 and 2012, less than 26% (2008) and 32% (2012) of (non-black) respondents were more likely to vote against an African American.
The muted results in these experiments are noteworthy, given that support for Donald Trump was associated with “hostile sexism” (Schaffner, MacWilliams, and Nteta Reference Schaffner, MacWilliams and Nteta2018) and negative racial attitudes (Abramowitz Reference Abramowitz2018). Indeed, when we categorized the results by partisanship and ideology, even Republicans and conservatives did not seem especially uncomfortable with female or African American candidates. Whereas some Republican respondents in 2008 might have been predisposed to vote against a woman, they were the minority; at least 62% of Republicans surveyed indicated no such attitude. Likewise, whereas some Republicans in 2008 and 2012 might have been predisposed to vote against an African American, at least 61% (2008) and 56% (2012) of (non-black) Republicans sampled were comfortable with such a candidate.Footnote 5
These results echo the hopeful conclusions of other list experiments (Benson, Merolla, and Geer Reference Benson, Merolla and Geer2011; Burden, Odo, and Yamada Reference Burden, Ono and Yamada2017; Martinez Reference Martinez2009), which also found minimal prejudice against African American or female candidates. Indeed, regarding tolerance for female candidates, our results are even more optimistic. This is because our sensitive items were written to capture any degree of discomfort—however minimal—with candidates who matched the description. Rather than ask respondents whether a female president would make them “angry or upset” (Streb et al. Reference Streb, Burrell, Frederick and Genovese2008), we simply asked whether respondents were “more likely to vote against” a female candidate. This suggests that in 2008, 24% represents an upper estimate of the proportion of Americans with deeply felt prejudice toward female candidates—only two years after Streb et al. (Reference Streb, Burrell, Frederick and Genovese2008) concluded that 26% was a lower estimate of this proportion. These findings suggest a profound uptick in tolerance toward female candidates.
To be clear, these results do not necessarily imply that Republicans (or Americans in general) are unbiased against African American and female candidates—and not simply because our n is sufficient only to reject very large effect sizes. Prejudice has numerous ways of manifesting in political life; the ballot box is only one. As DeSante and Smith (Reference DeSante and Smith2020) showed, many prejudiced whites voted for the first African American president but in 2016 opted for a candidate comfortable with racist appeals. For this reason, the absence of stark prejudice against an African American candidate might support Redlawsk, Tolbert, and Franko’s (Reference Redlawsk, Tolbert and Franko2010) suggestion that President Obama had unique appeal, such that whites’ enthusiasm for Obama’s campaign coexisted with higher levels of racial resentment. Moreover, we are not confident that with data from 2016 we would have found comparable results; explicit racial appeals have increased political power, especially from Right-leaning voters (Valentino, Neuner, and Vandenbroek Reference Valentino, Neuner and Vandenbroek2018). At the very least, citizens’ muted discomfort with “a candidate who is African American” highlights the paradoxes of the Obama era. Yet, because the results are consistent across 2008 and 2012, they nonetheless signal racial progress.
At the very least, citizens’ muted discomfort with “a candidate who is African American” highlights the paradoxes of the Obama era. Yet, because the results are consistent across 2008 and 2012, they nonetheless signal racial progress.
Where do we find obvious, statistically significant prejudice in our data? The short answer: almost everywhere, especially when we attend to differences in partisanship and ideology. Results indicate that 44% of respondents in 2008 and 21% in 2012 were more likely to vote against a “gay or homosexual” candidate. At the subgroup level, results are consistent with partisan realignment around culture-war issues (Layman Reference Layman2001). In 2008 and 2012, Republican and conservative respondents exhibited uniquely steep bias against gay candidates. It is interesting that the treatment effect for Republicans in 2008 (SATE=0.79) was substantively larger than for Republicans in 2012 (SATE=0.50). Whether Right-leaning voters are warming to gay candidates is a question for future research; however, our sample sizes were sufficient to detect both effects.
The “Muslim” experiments reflect both the pervasiveness of anti-Muslim bias and its manifestation on the Right. In both election cycles, respondents indicated that they were more willing to vote against a Muslim: 69% in 2008 and 46% in 2012. It is unsurprising that Right-leaning voters showed unambiguous, negative reactions to a Muslim candidate. In 2008, conservatives demonstrated a strong treatment effect (SATE=0.74), which increased substantially in 2012 (SATE=0.97). Republicans showed strong prejudice against Muslim candidates in both 2008 (SATE=0.94) and 2012 (SATE=0.85).
Yet, although Right-leaning respondents were nearly unanimous in their discomfort with Muslim candidates, this prejudice—especially in 2008—was not unique to the Right (Benson, Merolla, and Geer Reference Benson, Merolla and Geer2011). In 2008, each partisan–ideological subgroup (except independents) showed a significant negative response to “a Muslim candidate.” In most cases, these effect sizes are at (or near) those that our sample sizes were powered to detect. However, by 2012, pronounced skepticism toward Muslim candidates had diminished for liberal and moderate respondents, although it lingered among Democrats (SATE=0.36). The fact that anti-Muslim sentiment persists (to some degree) on the Left supports Kalkan, Layman, and Uslaner’s (Reference Kalkan, Layman and Uslaner2009) conclusion that suspicion toward Muslims transcends partisan–ideological divisions (see also Karpowitz, Monson, and Patterson Reference Karpowitz, Monson and Patterson2016).
Finally, in 2012, the full sample had a negative reaction to “a Mormon candidate” (SATE=0.37). However, liberals and Democrats were disproportionately responsible for this effect. Indeed, almost two thirds of Democrats (SATE=0.65) indicated that they would be more likely to vote against a Mormon; the number of Democrats sampled was sufficient to detect an effect size of this magnitude. Thus, aversion to a “Mormon candidate” emerges as a disproportionate judgment of left-wing voters. Meanwhile, the effect size for Republicans (SATE=0.17) is not significant; because the number of Republicans sampled was sufficient to detect (with 80% power) an effect size of 0.47, the data indicate that less than 47% of Republicans sampled were more likely to vote against a Mormon candidate. This indicates that whereas anti-Mormon bias was prominent among evangelical Southerners in 2007–2008 (Benson, Merolla, and Geer Reference Benson, Merolla and Geer2011), by 2012, prejudice against Mormon candidates (per se) was concentrated among Left-leaning voters.
Of course, Democrats’ aversion to a Mormon candidate—in the context of the 2012 presidential election—might be interpreted as a “Romney effect.” That is, the Republican presidential nominee was a Mormon, and our Democratic respondents might have inferred that “a candidate who is Mormon” was synonymous with the GOP nominee. In that case, however, it is curious that we do not see a comparable effect among Republicans in the “African American” list experiment.
Equally likely is that anti-Mormon sentiment is as emblematic of left-wing consciousness as anti-gay and anti-Muslim sentiment is of right-wing consciousness. Accepting this premise does not mean equating these biases or suggesting that they have similar consequences for the target population. Nevertheless, Mormons are perceived as insulated—to an inappropriate and suspicious degree—from American life (Campbell, Green, and Monson Reference Campbell, Green and Monson2012; Reference Campbell, Green and Monson2014). Together with Democrats’ increased secularism (Putnam and Campbell Reference Putnam and Campbell2010), the intolerance of (some) left-wing voters toward religion in general (Conway et al. Reference Conway, Houck, Gornick and Repke2017), and the association of Mormonism with Republican partisanship (Campbell, Green, and Monson Reference Campbell, Green and Monson2012, Reference Campbell, Green and Monson2014), Democrats’ reactions in the “Mormon” list experiment have theoretical support. More generally, our results support Benson, Merolla, and Geer’s (Reference Benson, Merolla and Geer2011) conclusion that citizens are especially wary of religious outsiders running for president.
GENERALIZED PREJUDICE
In addition to analyzing each experiment separately, we pooled the sensitive-item treatments to form a generalized prejudice index. This procedure does not facilitate inference about opposition to any particular type of candidate. However, it provides empirical leverage on the prevalence of prejudice—against any of the target populations—within the sample.
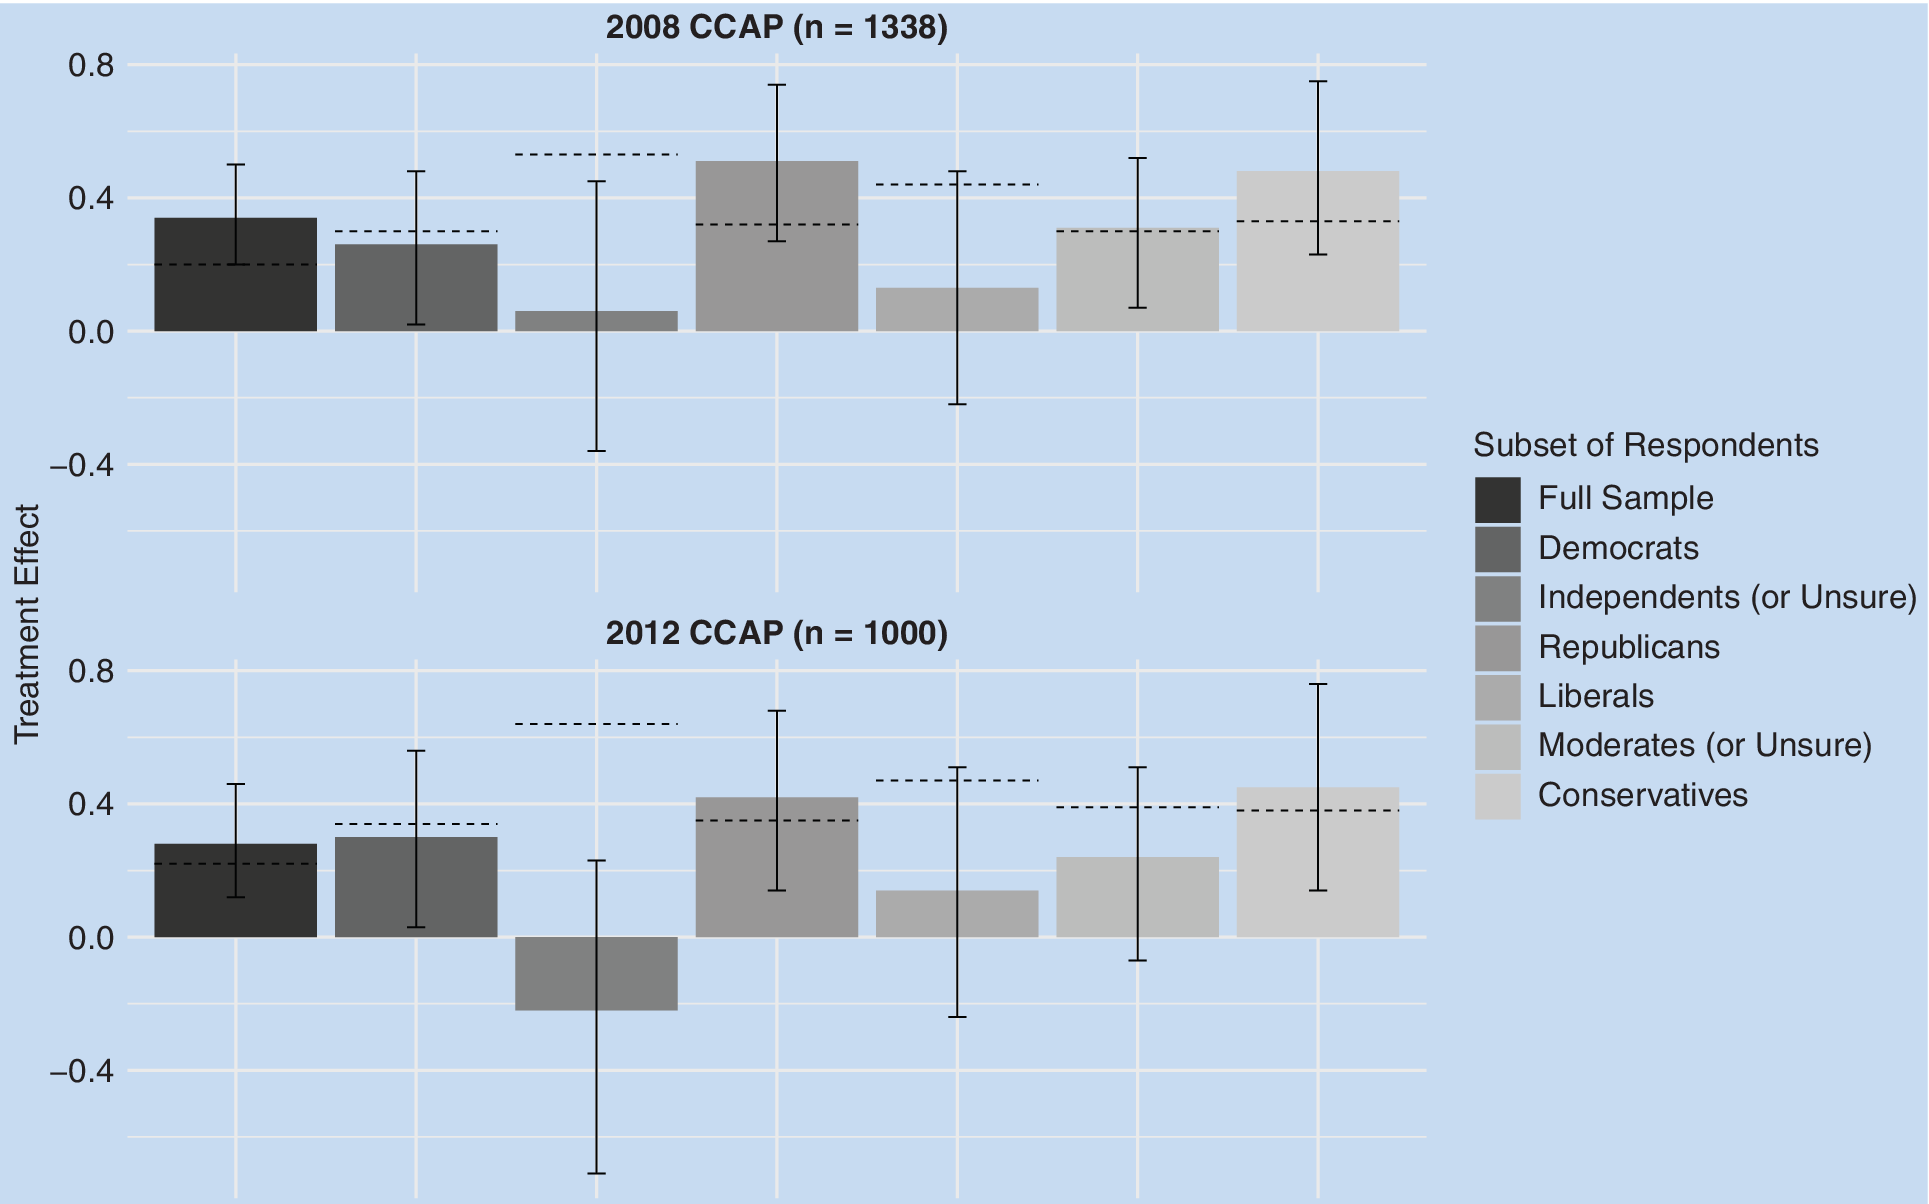
Figure 4 shows results for both 2008 and 2012 with 90% confidence intervals. For the full sample (in both 2008 and 2012), we rejected the null hypothesis of no bias against candidates from underrepresented groups. In both 2008 and 2012, we found significant bias among Democrats, Republicans, and conservatives; in 2008 (but not in 2012), the same held for moderates. If there were more self-identified liberals and independents in our samples, we potentially would register bias here as well. These results support our initial intuition: that both sides of the partisan–ideological divide are willing to reject candidates on the basis of their descriptive identities.
Generalized Prejudice, 2008 and 2012 CCAP: Estimated Proportions More Likely to Vote Against Candidates from Underrepresented Groups
Notes: Horizontal dashed lines indicate effect sizes that each comparison is equipped to detect (given the number of respondents in treatment and control) with 80% power (d=0.80); power analyses conducted using DeclareDesign (Blair et al. Reference Blair, Cooper, Coppock and Humphreys2019) Data from the 2008 (n=1,338) and 2012 (n=1,000) CCAP. Treatment effects are calculated by comparing respondents in the control condition (2008, n=260; 2012, n=185) to respondents in all four sensitive-item conditions (2008, n=1,078; 2012, n=815); treatment effects imply the proportion of the sample (or subsample) that was more likely to vote against a presidential candidate from an underrepresented group. Vertical lines indicate 90% confidence intervals produced using normal linear regression in zelig (Choirat et al. Reference Choirat, Gandrud, Honaker, Imai, King and Lau2016).

CONCLUSION
Our findings have implications for how we understand intergroup biases in American politics, manifestations of group-centrism in voting behavior, and the preponderance of out-group biases among Republicans and Democrats. Respondents indicated surprisingly low discomfort (in the abstract) with African American and female candidates. However, both Right- and Left-leaning voters indicated bias against specific types of candidates, with Republicans disproportionately reluctant to support a gay or Muslim presidential candidate and Democrats disproportionately reluctant to support a Mormon.
Especially striking are the asymmetries in Republicans’ and Democrats’ attitudes in 2012. In that cycle (and in 2008), Republicans did not signal a dramatic reluctance to support an African American. Yet, in 2012, our Democratic respondents harbored exactly that prejudice against Mormon candidates that Right-leaning voters might be expected to harbor against African American candidates. Thus, political science should not ignore the biases that left-wing voters bring to the ballot box—chief among them (perhaps) an aversion to deeply held and openly expressed religious faith (Bolce and DeMaio Reference Bolce and DeMaio2008; Conway et al. Reference Conway, Houck, Gornick and Repke2017).
More broadly, our analysis is intended to spark a conversation rather than represent the last word on prejudice in presidential politics. For example, some scholars may quarrel with our usage of the term “prejudice” as shorthand for voters’ unwillingness to support a candidate from an underrepresented group. Judgments of this nature might not be prejudice (per se) if group identities are heuristics for ideological or issue commitments. Furthermore, the sorting of group identities along partisan lines (Mason Reference Mason2018) implies that partisan bias is confounded with bias against specific, out-partisan groups. For now, we are agnostic about voters’ motivations for concluding that a member of an underrepresented group should not receive their vote. Nonetheless, this is an important question for future research—and one likely to confront political scientists in evermore dramatic fashion. Regardless of its origins or rationale, prejudice in presidential politics is not only here to stay; it also is likely to find continued expression on both sides of the partisan–ideological divide.
DATA AVAILABILITY STATEMENT
Replication materials can be found on Dataverse at https://doi.org/10.7910/DVN/5UVZOS.
SUPPLEMENTARY MATERIALS
To view supplementary material for this article, please visit http://dx.doi.org/10.1017/S1049096520000876.