Panel data allow researchers to control for unobservable individual-effects and effects of the past that cross-sectional data can neither identify nor control (Finkel, Reference Finkel and Menard2008; Hsaio, Reference Hsiao2014, 4–10). But researchers must attend to the model and estimation technique used (Stimson 1985). Researchers must account for the dynamic structure of their data and think carefully about controlling for individual-effects (Beck and Katz, Reference Beck and Katz1996, Reference Beck and Katz2001; Green et al., Reference Green, Kim and Yoon2001; Wawro, Reference Wawro2002; Wilson and Butler, Reference Wilson and Butler2007). Past literature reviews show that researchers have done a poor job of this (Wawro, Reference Wawro2002; Wilson and Butler, Reference Wilson and Butler2007). Our own more recent literature review suggests things have improved.Footnote 1 Researchers using panel data are more likely to address issues of autoregressive data or individual-effects but rarely both. This is a concern because solutions to one issue that do not consider the other can actually make point estimates worse (Plümper and Troeger, Reference Plümper and Troeger2019).
When researchers do address both autoregressive data and individual-effects, there is a lack of consensus on how to do so. This, in part, is because the otherwise very helpful political methodology literature on how to deal with unobserved individual-effects (inter alia, Shor et al. Reference Shor, Bafumi and Keele2007; Zhu, Reference Zhu2012; Bell and Jones, Reference Bell and Jones2015; Clark and Linzer 2015) within a (autoregressive) dynamic model (inter alia, Beck and Katz, Reference Beck and Katz1996, Reference Beck and Katz2001; Green et al., Reference Green, Kim and Yoon2001; Wawro, Reference Wawro2002; Wilson and Butler, Reference Wilson and Butler2007) provides insufficient guidance on this for short panel data—that is, data with as few as three waves and no more than ten. This is typical for but not limited to public opinion and political behavior dataFootnote 2 and 57 percent of the articles in our literature review used panel data in this range.Footnote 3 Under these circumstances, conventional estimators such as ordinary least squares fixed-effects (OLS-FE) and standard generalized least squares random-effects (GLS-RE) are biased (Nickell, Reference Nickell1981; Hsiao, Reference Hsiao2014), and common alternative generalized methods of moments (GMM) estimators can produce large random errors when T and/or N are small, and are sometimes biased (Blundell and Bond, Reference Blundell and Bond1998, Bond and Windmeijer, Reference Bond and Windmeijer2002). This is particularly true for the estimation of the long-run effect (LRE). Meanwhile, much less well-known transformed-likelihood estimators (TLEs) for dynamic panel models have recently become available. This can leave a researcher uncertain how to proceed.
This paper makes three contributions. First, it introduces TLEs for very small T, dynamic, fixed-effects models designed to address the problems of OLS-FE, GLS-RE, and GMM estimators. TLEs are unknown and hitherto unused in political science. Of these, the orthogonal reparameterization estimator (OPM) is also virtually unknown outside of political science. This is likely because it is only discussed in the most abstract terms—as an example demonstrating an approach to the statistical problem of incidental parameters (Lancaster, Reference Lancaster2002). It has been argued that the better-known TLE, the quasi-maximum likelihood estimator (QML-FE), is an improvement over GMM estimators in that it has better finite sample properties but that it runs into difficulties estimating the LRE of model covariates when T and N are small and the coefficient on the lagged dependent variable (LDV) is greater than 0.8 (Hsiao et al., Reference Hsiao, Pesaran and Tahmiscioglu2002).Footnote 4 The performance of OPM is unknown when the number of cases is not large—common in political science.Footnote 5 The second contribution of this paper then is to test the finite sample performance of TLEs. We demonstrate TLEs provide efficiency gains over GMM, and OPM in particular has very good finite sample properties and is an improvement over both QML-FE and GMM estimators, particularly when estimating the LRE. The third contribution is to describe how the gains made by TLEs are achieved by making distributional assumptions and to test the performance of these estimators when these distributional assumptions are badly violated. The robustness of TLEs to such violations is so far unknown. We demonstrate that OPM in particular is largely robust to common violations. Overall, OPM is always as good as the estimators currently being used and in circumstances important to political science researchers it is often better.
In making these contributions, this paper focuses on linear, single equation models estimated on short panels (T ≤ 10) with correlations within individuals but not across them.Footnote 6 We also assume that our hypotheses are focused on the effects of changes in time-varying independent variables. Appendix B provides a discussion of these assumptions.Footnote 7 We make additional assumptions about the homogeneity of effects over-time and across cases that may or may not hold with a particular dataset. Violations of over-time homogeneity have little effect when T is very small, as it does not have an opportunity to present itself. The potential for violations of cross-case homogeneity is a limitation that is discussed in the concluding section.
1 Unobservable individual-effects
The simplest panel data model is the pooled model:

where the subscript i indexes the case/individual and subscript t indexes time, so that y i,t is the value of y for case i at time t.
The μ i,t represent the errors in the model. Problems of unobservable individual-effects occur when the data generating process (DGP) for the errors is as follows:Footnote 8

In Equation 2, the structure of the errors is such that they contain a component that differs from case to case but does not vary over time: η i. These unobservable individual-effects (also known as unobserved heterogeneity) are time-invariant differences between cases not reflected in x i,t.Footnote 9 These unexplained differences may be characteristics of the cases that do not vary over time or that do vary over time but have different case specific averages over the period of the study. Such unobserved differences are plausible in most research situations (Rosenbaum, Reference Rosenbaum2005; Wilson and Butler, Reference Wilson and Butler2007).Footnote 10
The individual-effects (η i) have two consequences. First, they result in correlation in the errors across time leading to incorrect estimates for the standard errors of the parameters (e.g., the slopes) in the model. The second consequence of the individual-effects occurs if the DGP for x i,t also contains time-invariant differences: $x_{i, t} = \eta _{i}^x + \nu _{i, t}$
If $Corr( \eta _{i}\eta _{i}^x) \neq 0$ , the individual-effects in μ i,t are not independent of x i,t. Consequently, the zero conditional mean (exogeneity) assumption, E(μ i,t|x i,t) = 0, is violated and a pooled-OLS estimate of Equation 1 is biased. With individual-level data, this is often expected to be the case (Finkel, Reference Finkel and Menard2008).
The appropriate model to resolve the problems of unobservable individual-effects depends on the assumptions we can make about the relationship between the individual-effects in μ i,t and the covariates in the model—specifically, whether the individual-effects are independent of the covariates (Hausman and Taylor, Reference Hausman and Taylor1981): E(η i x i,t) = 0. If we can make this assumption, the η i are commonly called random-effects and typically a GLS-RE estimator (Balestra and Nerlove, Reference Balestra and Nerlove1966) is used. Otherwise, the η i are commonly called fixed-effects and typically an OLS-FE estimator is used.
2 The need for dynamic panel models
A dynamic process is one that includes one or more lags of the dependent variable on the right-hand side. For example:


The DGP described by Equation 3 contains a single lag of y i,t, reflecting the fact that y i,t is autoregressive. Higher order lags of y i,t are also possible but are very rarely employed in political science. For ease of exposition, we will assume only the first lag is of concern. A dynamic model may also include one or more lags of the independent variables.
A dynamic model is necessary if y i,t is autoregressive. We expect autoregression if we believe that subsequent to something happening that temporarily changes the value of the dependent variable (e.g., a temporary shift in an independent variable), the dependent variable will return partly but not entirely to its original value before the next observation. This autoregressive process is due to shocks in covariates (observed or unobserved) not dissipating by the next observation. For example, if we measure support for the president monthly, we might expect an event (such as a policy announcement) to produce a temporary shift in support. That announcement may still be in the minds of individuals the month after it was made and so the shift in support observed in the month of the announcement may not have entirely dissipated by the next monthly observation. There are often strong substantive reasons to expect such dynamics (Beck and Katz, Reference Beck and Katz1996; Finkel, Reference Finkel and Menard2008). In public opinion data in particular, the degree of autoregression is expected to be high (i.e., α → 1 in Equation 3).There may also be reasons to expect lags of some or all of the independent variables in the DGP, reflecting delayed effects on the dependent variable.
To evaluate the consequences of not accounting for an autoregressive dependent variable, consider the estimation of the following static data model:

when the true DGP is Equation 3.
An unbiased OLS-FE or GLS-RE estimation when T is small assumes: $E( \varepsilon _{i, t_1} \vert x_{i, t_2}) = 0,\; \, {\rm for\, all }\; t_1 \;{\rm and }\; t_2$ . The expected value of the error is assumed to be independent of any past, current, or future value of the covariates included in the model—strict exogeneity. A problem arises because Equation 4 does not include αy i,t−1 and so, the error term ɛ i,t is generated by: ɛ i,t = αy i,t−1 + ε i,t
By Equation 3, y i,t−1 and x i,t−1 are not independent (unless β 1 = 0) and since ɛ i,t is a function of y i,t−1, ɛ i,t and x i,t−1 are not independent. Therefore: $E( \varepsilon _{i, t_1} \vert x_{i, t_2}) \neq 0$ for t 2 = t 1 − 1 and the estimate of β 1 is biased.
A secondary problem is that the errors will be serially correlated: E(ɛi,t|ɛi,t−1) ≠ 0. Upon noting the serial correlation in the errors, it might be tempting to use a feasible generalized least squares estimator that accounts for the serial correlation (e.g. Prais–Winsten). Unfortunately, this does not resolve the problem of bias produced by not including y i,t−1, in the model.Footnote 11
3 The problem of unobservable individual effects in dynamic panel data
It is not the purpose of this paper to suggest that the inclusion of a LDV is always appropriate. However, given the problems created by not using a dynamic model when the DGP requires it, we need such models in our toolbox. Unfortunately, the problems of unobservable individual-effects are magnified by dynamic models.
In static models, if we can assume that the individual-effects are independent of the covariates, E(η i x i,t) = 0, the primary problem with ignoring the individual-effects is serial correlation in the errors. In a dynamic model, it is not possible to make this assumption because individual-effects cannot be independent of the LDV by definition. From Equation 3, y i,t−1 = αy i,t−2 + β 1 x i,t−1 + η i + ε i,t−1. The LDV is a function of the individual effects. Consequently, the OLS estimation of the coefficient on the LDV is biased upwards when individual effects are not included in the data model—i.e. the pooled model (Nerlove, Reference Nerlove1967; Trognon, 1978). This has consequences for the estimates of the other coefficients and the LRE. As this independence assumption is also necessary for GLS-RE (Balestra and Nerlove, Reference Balestra and Nerlove1966), its violation means this estimator is also biased in a dynamic model (Hsiao, Reference Hsiao2014). Specifically, it is biased toward the pooled model estimates. If the violation of the independence assumption is small, as may be the case in a static model, the bias of the GLS-RE estimator may also be small (Clarke and Linzer, Reference Clark and Linzer2015). However, because the assumption of independence is badly violated by the LDV, the bias of traditional GLS-RE for dynamic models can be substantial when T is very small—as we will see.Footnote 12
It is also well-established that under these circumstances, OLS-FE suffers from bias (Nerlove, Reference Nerlove1967). When T is small, events that affect y i,t just prior to the first observation will not have fully dissipated before the last observation. This will appear similar to fixed differences between observations, making it hard to distinguish between the fixed-effects and the autoregressive nature of the data. It has been shown that if the true autoregressive parameter, α, is positive, the bias will be negative even as α goes to zero (Nickell, Reference Nickell1981).
The political science literature contains useful advice on how to address individual-effects with dynamic models. Green et al. (Reference Green, Kim and Yoon2001) make a case for the need to control for individual-effects and they include OLS-FE dynamic models amongst the different panel models they estimate. However, they do not include a discussion of the bias that occurs when T is very small, except to note that they only include cases with a T greater than 20 to avoid the problem. Responding to Green et al. (Reference Green, Kim and Yoon2001), Beck and Katz (Reference Beck and Katz2001) recommend a random coefficients model as an alternative (Beck and Katz, Reference Beck and Katz2001, 493). In terms of dealing with individual-effects, this is equivalent to a random-effects estimation. For the moderately large T panel data considered in these two papers, this may be good advice but, again, the traditional GLS-RE estimator applied to a dynamic model exhibits substantial bias when T ≤ 10. Elsewhere, Beck and Katz (Reference Beck and Katz2011) suggest that when estimating a dynamic model, the bias from an OLS-FE estimator is relatively small when T > 20, but do not discuss the substantial bias when T ≤ 10. Zhu (Reference Zhu2012) usefully notes the problem of estimating dynamic models with a small T but her empirical example has a T of 17 avoiding (as she points out) the problems of a very small T. Wilson and Butler (Reference Wilson and Butler2007, 107–108) outline very well the problems of estimating a dynamic model with fixed-effects with a very small T. Unfortunately, they do not provide a solution to the problem. They note that the bias of OLS-FE is much larger for the coefficient on the LDV than on the other covariates in the model. As we will show below, the error on the coefficient for all covariates can be substantial when T is very small (≤ 10). Further, bias in estimating the LRE is not a trivial matter. We are typically interested in all effects of x i,t on y i,t, not just the short-run effect (SRE). The SRE is often small in magnitude, making it hard to detect, and the LRE is typically larger than the SRE. A downward bias on the estimate of α and so a downward bias on the LRE (see Appendix C) makes it hard to detect the LRE. Overall, this increases type II errors. Finkel (Reference Finkel and Menard2008)—in brief—outlines the family of GMM estimators proposed by Arellano and Bond (Reference Arellano and Bond1991), Arellano and Bover (Reference Arellano, Bond and Bover1995) and Blundell et al. (Reference Blundell, Bond, Windmeijer and Baltagi2000). These GMM estimators are designed to account for individual-effects in dynamic models without the problems of OLS-FE and GLS-RE when T is small. Wawro (Reference Wawro2002) provides an excellent description of these GMM estimators, spelling out the importance of testing the assumptions of the estimator. However, the GMM approach is not without problems, as we discuss below.
This is what the political science literature has covered. What it has not explored, to date, is the potential use of likelihood-based estimators for dynamic models that account for individual-effects. The challenge is that a consistent maximum likelihood estimation (MLE) relies on asymptotics as the number of observations relative to the number of parameters goes to infinity (i.e., a large number of observations relative to the number of parameters). When T is small, the only potentially available asymptotics are in N. However, in a fixed-effects model, for every case added, a parameter (the individual effect) is also added.Footnote 13 Therefore, there are no asymptotics available in N. As we are not interested in the values of the fixed-effects, we call them “incidental parameters” and the challenge they pose for a consistent MLE an “incidental parameters problem” (Neyman and Scott, Reference Neyman and Scott1948; Lancaster, Reference Lancaster2000).
We examine two likelihood-based estimators as a solution. These are the quasi-maximum likelihood fixed effects (QML-FE) estimator (Hsiao et al., Reference Hsiao, Pesaran and Tahmiscioglu2002) and the orthogonal reparameterization likelihood (OPM) estimator (Lancaster, Reference Lancaster2002). In both cases, the likelihood is transformed so that the incidental parameters are no longer included within it.
Even though these TLEs were proposed in 2002, they are far less known than GMM estimators. The papers introducing QML-FE (Hsiao et al., Reference Hsiao, Pesaran and Tahmiscioglu2002) and OPM (Lancaster, Reference Lancaster2002) have only 81 and 50 cites respectively (Web of Science), and citations of Lancaster are not for applications of OPM but rather reviews of the incidental parameters problem. The two papers that introduced the GMM estimators (Arellano and Bond, Reference Arellano and Bond1991; Arellano and Bover, Reference Arellano, Bond and Bover1995) have 9069 cites between them. This is in some part because statistical packages for TLEs have not been available. To help address this specific issue, we have made OPM available in R (Pickup et al., Reference Pickup, Gustafson, Cubranic and Evans2017).Footnote 14 The lack of familiarity with OPM is also because the estimator is only discussed as a proof of concept for a general approach to solving the incidental parameters problem (Lancaster, Reference Lancaster2002), its performance is only given brief consideration and there is a typographical error in the equation describing the estimator.Footnote 15 The general performance of OPM is not well understood. An additional barrier to the adoption of TLEs is that the finite sample properties (small N and T) of OPM and the robustness of both TLEs to violations of distributional assumptions are unknown. We address these issues now by introducing the reader to TLEs for very small T dynamic panel models, testing their performance against the more common GMM estimator, and explaining their trade-offs.
4 Transformed-likelihood estimators for very small T dynamic panel models
Before introducing TLEs, we briefly describe GMM estimators. Consider the following first difference transformation. If we assume the DGP in the process described by Equation 3, it is also true that:

If we subtract Equation 5 from Equation 3 we end up with an equation in first differences and without the individual effects:

or

Note: ε i,t−1 = y i,t−1 − αy i,t−2 − βx i,t−1 − η i by Equation 5. As both Δε i,t and Δy i,t−1 are functions of y i,t−1, E(Δε i,t|Δy i,t−1) ≠ 0, which is a requisite for an unbiased estimate of Equation 6. Anderson and Hsiao (Reference Anderson and Hsiao1982) propose using the second lag of either the first difference or level of the dependent variable (Δy i,t−2 or y i,t−2) as an instrument for the first differenced LDV, Δy i,t−1, in Equation 6. Arellano and Bond (Reference Arellano and Bond1991) proposed a generalized method of moments estimator based on a similar principle. To understand the GMM approach, consider a simple linear regression: y i,t = βx i,t + ε i,t
If we believe we can assume that x i,t is independent of ε i,t, this suggests the following population moment condition:Footnote 16 E(x i,tε i,t) = E(x i,t(y i,t − βx i,t)) = 0
The GMM estimation of β is calculated by replacing the assumed (and unobservable) population moment condition with the observable sample moment condition:

and solving for $\hat \beta$ .
If we believe that x i,t and ε i,t are correlated, but that we have an instrument z i,t, we can define the following population moment condition: E(z i,tε i,t) = E(z i,t(y i,t − βx i,t)) = 0 and use this to produce the GMM estimation of β.
These two examples produce estimators that are no different than OLS and instrumental variables regression. However, when more moment conditions are defined, there may be more moment conditions than unknown parameters. GMM proceeds by selecting the values for the parameters in the model that minimizes a weighted sum of the squared moment conditions. The intuition is to select values of the parameters that come closest to meeting the moment conditions on average. This requires estimating a weighting matrix and the efficiency (the relative variance of the estimator) of GMM depends, in part, on the matrix selected.Footnote 17
Arellano and Bond style GMM estimators for Equation 3 use moment conditions based on the levels of lagged variables as instruments in the first differenced Equation 6. The number of available moment conditions is determined by the number of waves of data. The moment conditions used are based on the assumptions the researcher is willing to make about the underlying DGP. The advantage of the Arellano and Bond GMM estimator is that it allows for a greater number of moment conditions than the Anderson and Hsiao approach, reducing random errors.
GMM is susceptible to the equivalent of the weak instruments problem (Stock et al., Reference Stock, Wright and Yogo2002). When the instrument correlates weakly with the instrumented variable, the estimator is biased toward the OLS estimate of Equation 6 and the sampling distribution is non-normal resulting in incorrectly estimated standard errors (and confidence intervals). The instruments in levels used by Arellano and Bond (Reference Arellano and Bond1991) are weak when the autoregressive parameter α is too close to 0 or 1 (Blundell and Bond, Reference Blundell and Bond1998) or the difference between cases is large relative to changes within cases (between variance is large relative to within variance) (Blundell and Bond, Reference Blundell and Bond1998). An extension to the Arellano and Bond GMM method was developed by noting that more moment conditions can be made available (Arellano and Bover, Reference Arellano, Bond and Bover1995; Blundell and Bond, Reference Blundell and Bond1998; Blundell et al., Reference Blundell, Bond, Windmeijer and Baltagi2000) by using a system GMM estimator. This estimator defines moment conditions based on level instruments for the equation in first differences (Equation 6) and first difference instruments for the original equation in levels (Equation 3). In addition to making more moment conditions available, the first difference instruments can be stronger than the level instruments when α is approximately 1.
Another issue with GMM is that the optimal weighting matrix can be difficult to estimate with limited information (Roodman, Reference Roodman2009), particularly for the system GMM estimator. This occurs when moments are based on weak instruments or when the number of moment conditions is large relative to N. The computational difficulty in estimating the matrix can produce (somewhat unpredictable) bias (Doran and Schmidt, Reference Doran and Schmidt2006) and reduce efficiency (increasing errors). This means larger standard errors and a greater probability of large random errors. Further, the many instruments problem on its own can result in bias. This occurs when the instrumented variable is over fitted as a consequence of the large number of instruments relative to N. As a result, the instrumenting purges less of the endogenous part of the instrumented variable and the estimation is again biased toward the OLS estimate. The result is that GMM has poor small N (finite sample) properties (Bond and Windmeijer, 2002). A final limitation of GMM is that the researcher can make many different choices regarding the moment conditions and these choices can produce substantially different results. This opens up the possibility of researchers selecting moment conditions that produce the results that match their theoretical expectations (a researcher degrees of freedom problem). Overall, GMM estimators are an improvement over OLS-FE and GLS-RE but they have limitations.
4.1 The OPM approach
As has been noted, the MLE of y i,t = αy i,t−1 + βx i,t + η i + ε i,t when T is small leads to an incidental parameters problem. Lancaster (Reference Lancaster2002) suggests a solution. We are not interested in the incidental parameters η i. We are interested in estimates of the common parameters: α and β (used to calculate the LREs and SREs of x i,t) and σ 2. We seek a reparameterization of the incidental parameters so that the incidental and common parameters are information orthogonal. To understand what reparameterization means, let us start with a simple example. If we have the following static model:

we can define a new set of incidental parameters as a function of the original incidental parameters and β 0: $\tilde {\eta }_{i} = \eta _{i} + \beta _0$
Our static model, expressed in terms of the new incidental parameters is:

Note that although the incidental parameters have changed and their interpretation differs, the common parameters have not changed and their interpretation remains the same.
The orthogonal reparameterization proposed by Lancaster (Reference Lancaster2002) is much more complex but like the above transformation, it changes the meaning of the parameters representing the individual effects but not the meaning of the other parameters. Unlike the above, the Lancaster reparameterization also allows us to write a likelihood in which the incidental parameters are informationally orthogonal from the other parameters. To break this concept down, we begin with the concept of orthogonality.
For Equation 3, we denote the likelihood function for the data for a single case as ℓi(η i, α, β, σ 2). Following Lancaster (Reference Lancaster2002), suppose the incidental parameters can be reparameterized so that the likelihood function factors as:

where ℓi1 and ℓi2 are themselves likelihood functions. If the parameters (η i) and (α, β, σ 2) are also variation independent, they are orthogonal.Footnote 18 It can then be shown that the application of maximum likelihood to the product of the ℓi2 for all cases produces consistent estimates of (α, β, σ 2) as N → ∞ when T ≥ 3 (Lancaster, Reference Lancaster2002). Lancaster (Reference Lancaster2002) provides the Poisson count model as an example of where this is possible. The likelihood of case i is:

If we define $\tilde {\eta }_{i} = \eta _{i} \sum _{t}{} {\rm e}^{\theta _{i}'x_{i, t}}$ , we can rewrite Equation 10 as:

This is an orthogonal reparameterization with respect to the incidental parameters because it expresses the original likelihood as the product of two likelihoods, the first of which, $\ell _{i1} = {\rm e}^{-\tilde {\eta }_{i}}\tilde {\eta }_{i}^{\sum _{t}{} y_{i, t}}$ , contains only the reparameterized incidental parameters and the second, $\ell _{i2} = {{\rm e}^{\theta _{i}'\sum _{t}{} y_{i, t}x_{i, t}}}/{( {\rm e}^{\theta _{i}'\sum _{t}{} x_{i, t}}) ^{\sum _{t}{}y_{i, t}}}$
 , only contains the common parameter θ Lancaster (Reference Lancaster2002).
Unfortunately, not all likelihoods can be transformed so that the incidental parameters are completely orthogonal. However, it may still be possible to reparameterize the incidental parameters so that they are information orthogonal. Informally, information orthogonality means no information about the values of the $\tilde {\eta }_{i}$ tell us anything about the values of the common parameters. Formally, if the incidental parameters are completely orthogonal as above, the following is true:

where ${\cal L}_i$ is the log of the likelihood for the data for case i. Information orthogonality is a weaker form of orthogonality where the above is true in expectations (Lancaster, Reference Lancaster2002):

This can be interpreted as meaning that the gradient (slope) of the log likelihood with respect to the $\tilde {\eta }_{i}$ is independent of the gradient of the log likelihood with respect to the common parameter θ.Footnote 19
The purpose of seeking a reparameterization that results in information orthogonality is that it means we can place priors on the parameters and integrate out the fixed-effects. This gives us the marginal posterior for the remaining parameters and we can use Monte Carlo methods to sample values from the marginal posterior to produce estimates and credible intervals for the parameters. The estimates are consistent as N → ∞. The approach relies on the Bayesian idea of integrating out the $\tilde {\eta }_{i}$ to give us the marginal posterior distribution for the remaining parameters—although, this has many similarities to the frequentist idea of a conditional likelihood (Cox and Reid, Reference Cox and Reid1987; Lancaster, Reference Lancaster2000). Note that the orthogonal-reparameterization is not necessary in order to place a prior on and integrate out the incidental parameters but the orthogonalization means that the marginal posterior produced by integrating out the incidental parameters does not depend on the choice of prior that we place on them. In other words: we do not require any information about the individual effects.
If we wish to estimate Equation 3, an orthogonal re-parameterization of the fixed-effects, placement of priors on α, β, σ 2, and the $\tilde {\eta }_{i}$ , and integrating out the reparameterized fixed-effects results in the following posterior density function (Lancaster, Reference Lancaster2002):

H is defined as an operator that subtracts the mean. π(α, β, σ 2) represents independent, flat priors on each of the parameters, except α for which we use a uniform (− 1, 1) prior. Monte Carlo methods can be used to draw sample values of the parameters from this density distribution and the sampled values can be used to produce point estimates and credible intervals (Appendix D provides details). This approach provides a method of estimating the LRE that differs from other estimators. Instead of dividing the point estimates for β by one minus the point estimate for α, the LRE can be calculated for each pair of sampled β and α values, and the distribution of these LREs used to provide the LRE point estimate and credible interval. Pickup et al. (Reference Pickup, Gustafson, Cubranic and Evans2017) describes the mechanics of using our R package for this estimator.
4.2 The QML approach
Although the MLE of model Equation 3 with a fixed T leads to an incidental parameters problem, one can apply MLE to the first difference version of the model, as used in the GMM estimator Equation 6. Following Hsiao et al. (Reference Hsiao, Pesaran and Tahmiscioglu2002), to derive the likelihood for Equation 6, we begin by writing the joint density of Δy i,t given Δx i,t as:

However, the density function is not defined for Δy i,1 because y i,0 is unobserved. Making no assumptions about the distribution of y i,0 and treating these as free parameters to be estimated, reintroduces the incidental parameters problem. There are as many of these free parameters as there are cases. To avoid this problem, it is necessary to assume a functional form for the distribution of Δy i,1. Hsiao et al. (Reference Hsiao, Pesaran and Tahmiscioglu2002) propose the following feasible representation:

where b is a parameter to be estimated and π s is a T × 1 vector of parameters to be estimated. The derivation of this representation makes assumptions about the covariates (e.g., x i,t). It is assumed they are trend—or first difference—stationary, and weakly exogenous. Violations of either assumption will cause biased estimates. Violations of the stationarity assumption can be addressed through variable transformations but endogeneity is an assumption about the DGP. The unmodelled part of y i,t can be a function of current and past values of x i,t but not future values. Hsiao et al. (Reference Hsiao, Pesaran and Tahmiscioglu2002) provide the log-likelihood function based on Equations 6 and 14, which can be maximized iteratively (Kripfganz, Reference Kripfganz2016).Footnote 20 Because of the iterative nature of this estimator, convergence on a solution is not guaranteed. This problem does not occur for the OPM approach, as a closed form expression of the posterior is available and so we do not need to use an iterative procedure to obtain estimates. It is also the case that the dimension of π s increases with T, resulting in additional parameters to be estimated. There is no equivalent set of parameters for OPM, meaning it may be more efficient than QML-FE as T increases.
4.3 Trade-off between GMM and likelihood-based estimators
GMM is efficient to the extent that valid moment conditions are included and the optimal weighting matrix can be estimated. However, not all moment conditions may be known to the researcher (Kiviet et al., Reference Kiviet, Pleus and Poldermans2017), and estimating the weighting matrix can be computationally difficult. Likelihood-based estimators contain all the information regarding moment conditions in the assumptions made regarding the distribution of the data when constructing the likelihood. Therefore, likelihood-based estimators have an advantage with regards to smaller random errors and smaller confidence intervals/standard errors. A disadvantage of likelihood-based estimators is that if the distributional assumptions are incorrect, the estimator may not be consistent. With GMM estimators, the distributional assumptions are only as strict as the moment conditions included. GMM estimators, as they are applied to panel data, relax assumptions about the distribution by trading off greater random errors, particularly when T and/or N is very small. The value of the trade-off, one way or the other, is unclear as the robustness of the OPM and QML-FE estimators to violations of distributional assumptions is unknown. Their finite sample properties are only partially known and it is unknown how well they perform on tasks typical to political science: estimating the LRE and SRE of covariates; and testing hypotheses regarding these covariates.
5 Estimator performance
5.1 General properties
To evaluate the performance of the TLEs, relative to other estimators, we conduct a series of Monte Carlo experiments. We apply the estimators of interest to data generated by known DGPs. For each DGP we simulate 1000 data sets and evaluate the overall performance of each approach. We begin with the DGP for which GMMs were designed as a solution to the problems encountered when using OLS-FE and GLS-RE:


We use a DGP with a LDV but not a lag of the independent variables because lagged independent variables do not introduce problems for estimation beyond those of contemporaneous independent variables. We also assume the DGP for the independent variable (x i,t) contains serial correlation due to the fixed-effects but is not otherwise autoregressive. Appendix E includes simulation results from the inclusion of an autoregressive DGP for x i,t. This appendix also tests the consequences of including time-specific effects in the DGP, which we have excluded from Equation 15 for the sake of convenience. Finally, this appendix includes simulations when the true value of α is 0. These variations in the DGP do not change the results for the TLEs reported below.
To explore the efficiency problems of GMM as T → 3 and the potential bias when α → 1, we generate data sets with an N of 1000 and a T of 3, 4 and 5 (Appendix E contains results for T = 10), an α of 0.5 and 0.9 and a ω of 1.15 (for a variance of 0.44) and 5 (variance of 8.3). We use β = 0.5. The y i,t and x i,t are both a function of the individual effects (η i), with x i,t containing 75 percent of the effect for y i,t.
For each data set, we estimate β (i.e., the SRE), α, and the LRE using the following estimators: GMM, QML-FE, and OPM. We also include OLS-FE and GLS-RE to demonstrate the problems that these common estimators encounter when T is very small. We specifically use three GMM estimators. The first is the difference estimator using Equation 6 (Arellano and Bond, Reference Arellano and Bond1991) and the second and third are the system estimator discussed earlier (Blundell et al., Reference Blundell, Bond, Windmeijer and Baltagi2000). These are the estimators outlined and denoted GMM-DIFF and GMM-SYS in Blundell and Bond (Reference Blundell and Bond1998).Footnote 21 For the difference estimator (GMM-Diff), we use all moment conditions available, assuming the exogeneity of x i,t. This includes lags 2 through T − 1 of y it and lags 1 through T − 2 of x it as instruments in the difference equation. The first system estimator (GMM-Sys1) adds a lag of the first difference of y it in the level equation. The second system estimator (GMM-Sys2) adds to this a lag of the first difference of x it in the level equation. These specifications are common in our literature review. Each GMM estimator uses a two-step procedure which uses parameter estimates from a non-efficient GMM in the first step to estimate the optimal weighting matrix (Arellano and Bond, Reference Arellano and Bond1991). This is known to increase efficiency (Roodman, Reference Roodman2009). However, it is also known to produce a downward bias in the estimated standard errors in small samples and so we use the standard error correction proposed by Windmeijer (Reference Windmeijer2005). Given the DGP used for the simulations, these moment conditions are all valid. As a test, we apply a Sargan test to the system estimators. In each set of simulations, we reject the null hypothesis that the instruments (moment conditions) are valid in approximately 5 percent of the cases when using a 0.05 rule. This is the expected false rejection rate, if the instruments are valid. Deleting the cases for when the null hypothesis is rejected makes little difference to the results (Appendix E).
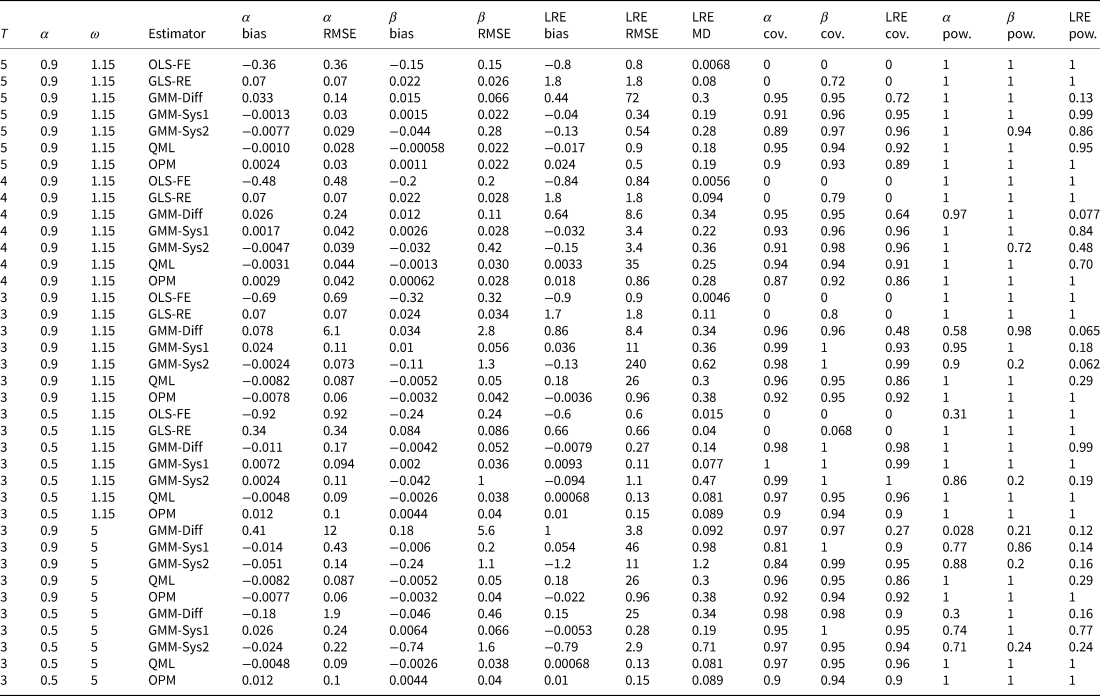
Table 1 presents the results from the Monte Carlo experiment. The mean biases for β and α are both reported. The α coefficient is important because β is only the estimate of the SRE and the full LRE is a function of α: β/(1 − α). The division by (1 − α) means that small errors in α can translate into large errors in the estimated LRE. To demonstrate this, Table 1 also reports the LRE bias. Note that because the estimates of α and β are not independent, the bias in the LRE cannot be determined simply by dividing the β bias by one minus the α bias. Also note that because the LRE is a nonlinear combination of parameters, its distribution is not necessarily symmetric and so we report the median bias in place of mean bias. The root mean squared error for β, α, and the LRE are also reported. The RMSE is an indicator of efficiency and is important because even if an estimator produces the correct answer on average, if it produces a wide range of values, many falling far from the truth, it may be of less value to us than an estimator with a small bias but a narrower range of values. For the LRE, we also report the median deviation from the median estimate (MD). The table reports the biases, RMSEs, and MDs as proportions of the true value. The absolute values are reported in Appendix E. Finally, the proportion of 95 percent confidence intervals that include the true value (the coverage probability statistic) and exclude 0 (the power statistic) are reported. An unbiased estimator that produces accurate standard errors should include the true value within this confidence interval 95 percent of the time and ideally exclude 0, when that is not the true value, 100 percent of the time. These measures reflect the value of the estimator for testing hypotheses regarding the parameter values.
Large N properties (N = 1000)

We begin with a summary of the problems encountered by OLS-FE and GLS-RE. The α bias for each is substantial. For OLS-FE, it ranges from 36 to 69 percent of the true value of the parameter. For GLS-RE, it can be as small as 7 percent but can also be as large as 19 percent of the true value. For β (the SRE), the biases are smaller but still up to 32 percent for OLS-FE. Further, biases in α translate into large LRE bias tables for both estimators. It gets up to 1.8 times the true value for GLS-RE.
Beyond bias, the coverage statistics for α, β, and the LRE are always below the 0.95 target for both OLS-FE and GLS-RE, often close to or equal to zero. These problems remain whether α = 0.5 or 0.9. In contrast, TLEs outperform OLS-FE and GLS-RE in each and every way. It is to these estimators and GMM we now turn.
We start with α = 0.9 and ω = 1.15 and note that the RMSEs for β are greatest for GMM-Diff and GMM-Sys2. The RMSEs increase as T decreases from 28 percent of the true value to 130 percent for GMM-Sys2 and from 6.6 to 280 percent for GMM-Diff. This means this estimator regularly produces SRE estimates that are one to three times too large or small. For the TLEs and the GMM-Sys1 estimator, the biases and RMSEs for β are generally always small, although the OPM RMSEs and biases are always equal to or smaller than the GMM and QML-FE estimators. Larger differences between the estimators are apparent in the estimates of α and therefore the LRE.
As T decreases from 5 to 3 (α = 0.9; ω = 1.15), the α bias(RMSE) for GMM-Diff increases from 3.3 percent(14 percent) to 7.8 percent(6 times the true value). This is due to the weakness of the moment conditions available to GMM-Diff when α is close to 1 (Stock et al., Reference Stock, Wright and Yogo2002) and T is small. Because of the weak instrument problem, GMM-Diff periodically produces a very poor estimate for α. Because of the division by (1 − α) when estimating the LRE, the result is large biases (44 to 86 percent) and extreme RMSEs (many times the true value). Note that unlike the rest of the simulation statistics, the LRE RMSE can be somewhat sensitive to the initial conditions of the simulations. However, it is only sensitive to the extent that when the RMSE is many times the true value, the choice of initial conditions affects how many times greater (but the RMSE is always very large). Under these circumstances it is useful to look at the MD. This is much smaller. However, this does not negate the fact that GMM-Diff periodically produces very poor estimates. This also sometimes results in low power for the LRE (as low as 6.5 percent).
At T = 5, the α and the LRE results for the TLEs and GMM-Sys estimators look much better. The biases are small; the RMSEs are many times smaller than for GMM-Diff; the coverage statistics are around 0.95; and the power is about 1.0 (0.86 for GMM-Sys2). As T is reduced to 4 and then 3, GMM-Sys1 and GMM-Sys2 exhibit only moderate RMSEs for α (up to 11 percent) but this translates into large RMSE (many times the true value) and poor power (as low as 6 percent) for the LRE. QML-FE also has a high RMSE and low-power for LRE. Hsiao et al. (Reference Hsiao, Pesaran and Tahmiscioglu2002) notes that QML-FE does not estimate the LRE well when α is greater than 0.8 and both T and N are small. It would appear that this is also the case when N is large and T is small. Importantly, OPM shows no such biases, has relatively small RMSEs and full power for all parameters. Perhaps because of the way it estimates the LRE, OPM appears much more robust to the problems GMM and QML-FE estimators encounter when T < 5 and α → 1.
When α = 0.5, all GMM and TLE estimators perform well even when T = 3, confirming the problems are a result of α → 1. However, when ω is increased, the RMSEs for all GMM parameter estimates increase (sometimes significantly) regardless of α, while the TLEs are unaffected. This is consistent with the finding that GMM can encounter weak instrument problems when the between variance is large relative to the within variance.
Previous work in Political Science (e.g. Wawro, Reference Wawro2002, 47) suggest 4–5 waves of data are preferable for GMM. With T = 5, and N is large, GMM-Sys1 (and GMM-Sys2 to a lesser extent) resolves many of the problems GMM-Diff exhibits when α is close to 1. GMM-Sys1 is, so far, the optimal GMM estimator, given the DGP. However, all three GMM estimators used valid moment conditions and pass the Sargan test with the expected false rejection rate. Further, even GMM-Sys1 has poor properties for the LRE when T < 5 and α is close to 1. Given one can never know the true value of α in the DGP of real-world data, researchers should consider OPM when they only have 3 or 4 waves of data. This is not an uncommon situation. Of the studies in our literature review 23 percent of them had just three waves. OPM not only performs better under these circumstances, it performs at least as well as other estimators when T > 4 and α is not close to 1.
These conclusions are based on a DGP with a large N but many political science examples of small T panel data do not have a large N. Of the studies in our literature review with T ≤ 10, 38 percent had an N < 500 and in almost half of these, N was less than 50.
5.2 Finite sample properties
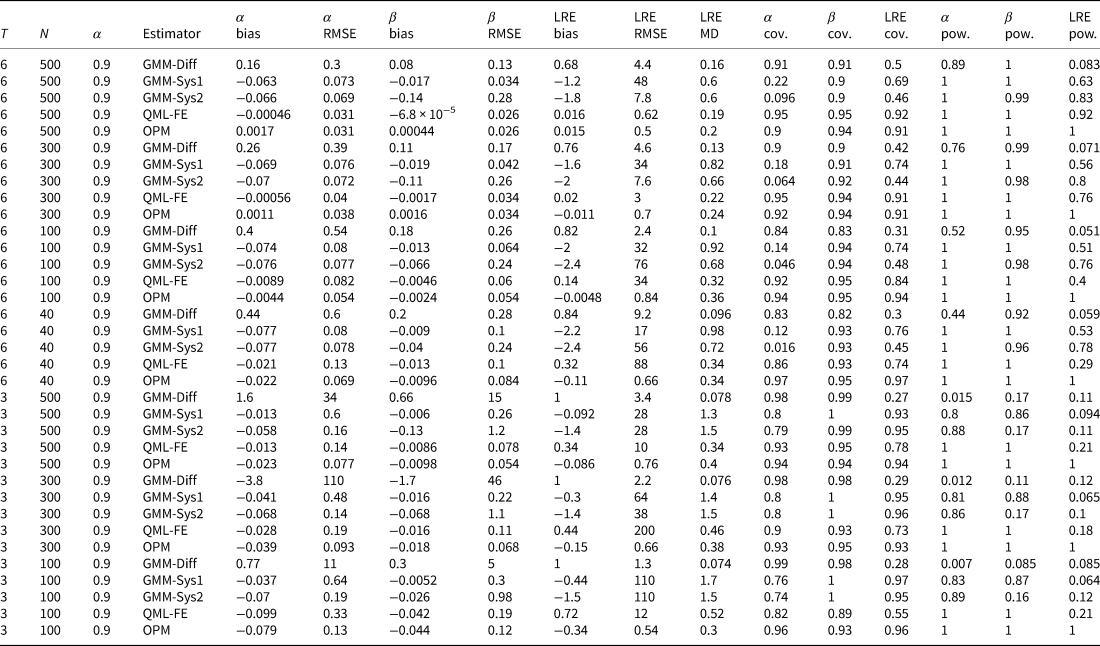
GMM is known to have poor finite sample properties (Bond and Windmeijer, 2002) and Hsiao et al. (Reference Hsiao, Pesaran and Tahmiscioglu2002) find that QML-FE consistently performs better than GMM when both T and N are small. However, they also find that when α > 0.8, QML-FE performs poorly when estimating the LRE. QML-FE sometimes does not even converge under such circumstances. The finite sample properties of OPM are entirely unknown. We repeat our simulations with the same DGP as before but with N = 40, 100, 300, and 500; T = 3 and 6; and α = 0.9. We use ω = 5, making between variance 60 percent greater than within variance—not unusual in political science examples. Appendix E contains the results for ω = 1.15. The results are the same but muted. GMM-Sys1 sometimes ran into problems when optimizing the weighting matrix. When this occurred, the results for that particular data set were dropped from the analysis. In principle, QML-FE could run into convergence problems but it did not during our simulations.
With T = 6 and α = 0.9, GMM-Diff exhibits increasing bias for α and the LRE, as N decreases from 500 to 40. The bias in α increases from 16 to 44 percent. The bias in the LRE increases from 68 to 84 percent. The LRE RMSE increases from 4.4 to 9.2 times the true value. When T = 3, the LRE bias is 100 percent and even at T = 500, the RMSEs for all parameters (including β) are many times the true values. The improved performance of GMM-Sys1 and GMM-Sys2 relative to GMM-Diff in estimating α is similar to that demonstrated by Blundell and Bond (Reference Blundell and Bond1998) but GMM-Sys2 exhibits increasing β RMSEs as T decreases—around 24 percent when T = 6 and 110 percent when T = 3. Also, as demonstrated by Hsiao et al. (Reference Hsiao, Pesaran and Tahmiscioglu2002), the QML-FE RMSEs for α and β are often smaller than they are for the GMM estimators but not consistently for α. The OPM RMSEs are consistently the smallest of all estimators. This efficiency of OPM relative to the GMM estimators as $T \& N \rightarrow 0$ is evident but the starkest differences are in the LRE estimates.
Starting with T = 6, N = 500, the overall best-performing GMM estimator (GMM-Sys1) exhibits a downward LRE bias of 120 percent. As N decreases to 300, then 100 and then 40, the bias increases to 160 percent, then 240 percent. Meanwhile, the RMSEs are many times the true value, and the power drops from 63 to 31 percent. QML-FE exhibits a similar pattern, although with smaller biases. This is consistent with Hsiao et al. (Reference Hsiao, Pesaran and Tahmiscioglu2002). QML-FE also has smaller MDs than the GMMs. OPM biases and RMSEs are consistently many times smaller than even QML-FE, and like QML-FE, the MDs are smaller than the GMMs. Even when N = 40, the LRE bias is only 11 percent, the RMSE 66 percent, and the MD 34 percent. Noticeably, the power never drops below 100 percent.
When T = 3 and N drops to 500, 300, and then 100, the pattern is similar except more extreme. The GMM RMSEs reach 110 times the true value for the LRE, and the power is about 6 percent. For QML-FE, the LRE bias increases from 34 to 72 percent, the LRE RMSE increases from 10 to 12 times the true value, and the LRE power is about 20 percent. For OPM, the LRE bias and RMSE are much smaller. The LRE bias does increase from 9 to 34 percent but even then the RMSE is only 54 percent and the MD 30 percent. Unlike the other estimators, the power for the OPM LRE always remains at 100 percent.
Overall, we see GMM-Diff has poor finite sample properties when α → 1. GMM-Sys1 (and GMM-Sys2 to a lesser extent) is an improvement but has problems estimating the LRE, and as $T \& N \rightarrow 0$ , it exhibits increasing RMSEs for all parameters. (And note, we have used a moderate between- to within-variance ratio. As this gets larger, the GMM RMSEs for all parameters are expected to increase further, while the TLEs are unaffected.) QML-FE is somewhat more efficient than GMM when estimating α and β under these conditions but runs into the same trouble estimating the LRE. OPM appears to improve on both the QML-FE and GMM estimators by being more efficient and much more robust in estimating the LRE when α is close to 1 (Table 2).
Finite sample properties

5.3 Violations of distributional assumptions
Up to this point, the DGPs we have used meet the distributional assumptions of TLEs. It is not known how well these estimators perform when these distributional assumptions are violated. Next we use DGPs that violate these assumptions in ways that we might expect to encounter in real-world analyses: outliers in the data; skewed variables; bimodal variables; and heteroskedastic errors.
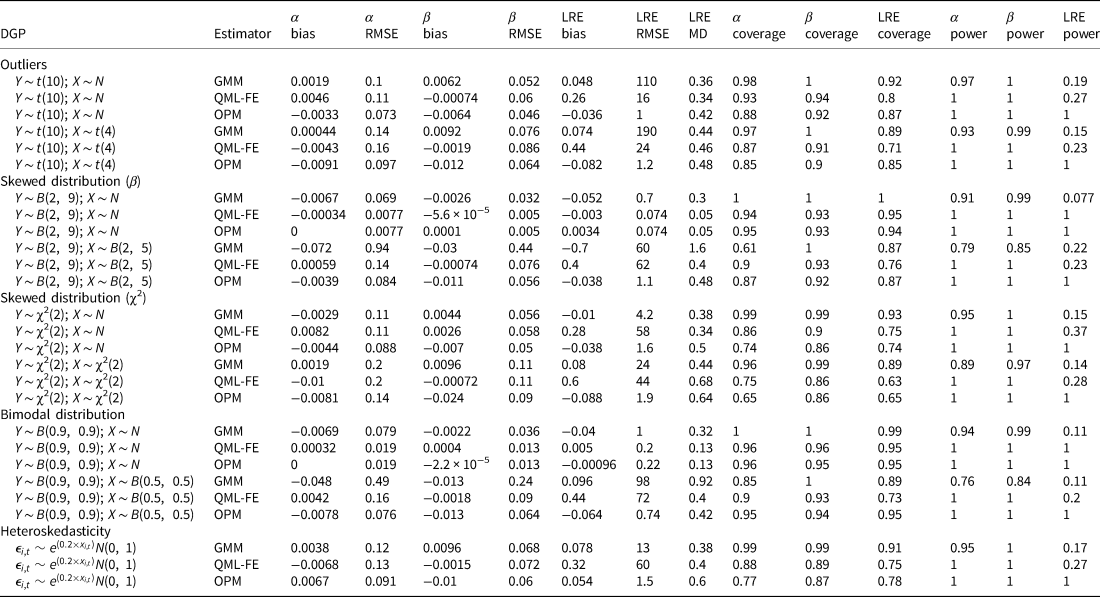
To test the consequences of outliers, we: (1) use the same DGP as in Equation 15 with α = 0.9, and T = 3 but we use a t-distribution with 10 degrees of freedom to generate the error term for Y it; and (2) we use a t-distribution with 10 degrees of freedom to generate the error term for Y it, while using a t-distribution with 4 degrees of freedom to generate the error term for X it. These distributions have the very fat tails that would result from outliers. To test the consequences of skewed data, we: (1) use a beta(2,9) distribution for Y it; (2) use a beta(2,9) distribution for Y it and a beta(2,5) distribution for X it; (3) use a χ2(2) distribution for Y it; and (4) use a χ2(2) distribution for Y it and a χ2(2) distribution for X it. To test the consequences of a bimodal distribution, we: (1) use a beta(0.9,0.9) distribution for Y it; and (2) use a beta(0.9,0.9) distribution for Y it and a beta(0.5,0.5) distribution for X it. To test the consequences of heteroskedastic errors, we generate ε 1,i,t as $e^{( 0.2 \times x_{i, t}) } N( 0,\; \, 1)$ .
In each case (Table 3), OPM is largely unbiased and has good power but there are instances (heteroskedastic and χ2 distributed errors) when the coverage statistics are as low as 65 percent. QML-FE, on the other hand, sometimes exhibits large LRE bias (60 percent when both Y it and X it are χ2 distributed) and large RMSEs (although MDs are not large). GMM exhibits such biases less often than QML-FE but the LRE RMSEs are just as large. When OPM exhibits poor coverage statistics, GMM does not but the trade-off is that GMM under these same circumstances has poor power, while OPM does not. For the distributional assumption violations we have identified, it would appear that OPM is largely (but not entirely) robust, while QML-FE and GMM exhibit the same problems of estimating the LRE when T = 3 and α → 1, as they did without the violations.
Violations of distributional assumptions (T = 3; N = 1000)

6 Empirical applications
In Appendix F, we apply the GMM, QML-FE, and OPM estimators to three empirical examples, demonstrating the consequences of using the different estimators in commonly used data sets and for published research.
7 Concluding thoughts and limitations
We have outlined and tested TLEs for dynamic panel models of very short panel data (T ≤ 10). As N → 0, QML-FE is somewhat more efficient than GMM but encounters the same issues of bias and large RMSEs for the LRE when α is close to 1, and T → 3. OPM is an improvement on both estimators. It is robust to the problems encountered by GMM and QML-FE when estimating the LRE. It is large N consistent, typically has the smallest RMSEs, best power, best finite sample properties, and is largely robust to violations of distributional assumptions. In all tests conducted in this study, OPM performs as well as or better than the more commonly used GMM estimator. Further, the empirical applications of these estimators in Appendix F demonstrate that the TLEs are different from those of the estimators traditionally used in political science in substantively meaningful ways. That said, it must be kept in mind that we have only been able to explore a finite number of possible data generating processes. Also, while we have attempted to use the most common and best performing (difference and system) GMM estimators, there are other GMM estimators out there that might perform differently. We are not stating that GMM estimators should be abandoned for OPM or QML-FE estimators. We do believe that if a researcher has only three or four waves of data and/or 500 or fewer cases, they should seriously consider the use of OPM as an estimator.
The greatest limitation of the TLEs is the assumption that effects are homogenous across cases (also true of the other estimators considered here). Unfortunately, while basic solutions such as interaction effects can be included, all advanced solutions (to date) require a large T to estimate individual equations for each unit or subsets of units to at least some degree (Pesaran, Reference Pesaran2015). Therefore, the estimators we have discussed are appropriate when the researcher is more concerned with the autoregressive nature of the data and individual-effects than with heterogeneous effects. This does not mean they have to believe effects do not vary across individuals. It does mean they must be aware that to the extent that the effects do vary, these estimators will deviate from the true DGP. Of course, this is true of every empirical model and the issue is more about by how much than if it does. Accounting for cross case heterogeneity with a small T is an important avenue for future research, whether the solution is a TLE or some other approach. In the meantime, OPM clearly provides improvements upon existing estimators for small T dynamic models that include fixed-effects.
Supplementary material
The supplementary material for this article can be found at https://doi.org/10.1017/psrm.2020.30.
Acknowledgments
The authors would like to thank Paul Gustafson, Chris Muris and Vera Tröger for providing feedback on manuscript drafts and the journal editors and reviewers for their constructive comments.