1. INTRODUCTION
Accurate recognition of hand-drawn input is one of the unresolved fundamental requirements for computer-based sketch tools to reach their full potential. Many of the existing recognizers work well for the specific context for which they were designed, but lack flexibility for general use. In this project a systematic approach is used to examine existing data mining techniques built within WEKA (Witten & Frank, Reference Witten and Frank2005) to compose a gesture (single stroke) recognizer for diagram recognition. Such a recognizer allows accurate stroke recognition results to be passed to the other parts of the recognition process such as joining related strokes and deciphering semantics. With this approach we are able to retain accuracy while increasing the generalizability of the recognizer.
One of the main approaches to ink recognition is to compute features of the ink and use these features to discriminate between different classes of strokes. Many research projects use this approach and improve the accuracy by selecting features and fixing the threshold of each feature statistically (Patel et al., Reference Patel, Plimmer, Grundy and Ihaka2007) or heuristically (Yu & Cai, Reference Yu and Cai2003). Although this approach can improve results for a particular context, it is time consuming and the resulting recognizer is inflexible. These “hard coded” (Johnson et al., Reference Johnson, Gross, Hong and Do2009) recognizers require significant work to recognize new shapes, because appropriate ink features and new thresholds need to be found manually. Because there are essentially an infinite number of gestures, designing a recognizer for each diagram set is impractical. An alternative is to support a range of common shape types to allow more flexibility (Fonseca et al., Reference Fonseca, Pimentel and Jorge2002; Paulson & Hammond, Reference Paulson and Hammond2008). However, including shapes that are not required is likely to reduce accuracy (Fonseca et al., Reference Fonseca, Pimentel and Jorge2002).
Another approach is template matching, where processed input strokes are compared with given templates on the pixel (or ink data reduced to a set of pixels) to find the similarities (Gross, Reference Gross1994; Kara & Stahovich, Reference Kara and Stahovich2004; Wobbrock et al., Reference Wobbrock, Wilson and Li2007). New shapes can be simply added by specifying new templates. Because this approach relies mainly on the pixel data, it does not fully exploit the rich temporal data contained in digital ink.
Machine learning techniques that automatically find relationships between features can result in extensible recognizers that are capable of utilizing rich feature sets (e.g., Rubine, Reference Rubine1991; Willems et al., Reference Willems, Niels, Gerven and Vuurpijl2009). This is a promising approach that avoids the disadvantages of hard-coded and pattern matching recognizers. However, there are two major limitations to current diagram recognition research using this approach: first, the number of features used in each project has been limited; second, there is no guarantee that the machine learning algorithms employed are the best as most projects have focused on one or two algorithms.
In this project we use WEKA (Witten & Frank, Reference Witten and Frank2005), a data mining tool that provides many machine learning algorithms to explore the performance of different algorithms using a large set of computable ink features. A set of well performing algorithms was identified, with each one in turn tuned to their best configuration. From this set, four algorithms have been combined into an ensemble to provide an accurate trainable recognizer: RATA.Gesture. RATA.Gesture is an enhanced version of RATA.SSR (Chang et al., Reference Chang, Plimmer and Blagojevic2010). We have deliberately scoped this project to simple gestures, ignoring joining and/or splitting which are a usual part of basic shape recognizers, so that we can accurately measure the single stroke recognition success rates. Furthermore, although our focus is diagram recognition, the RATA.Gesture recognizer can also be applied to functional gestures: our evaluation considers both drawing and functional gestures. For the purposes of this project a single digital ink stroke is both a gesture and a shape so we use the terms stroke, gesture, and shape interchangeably.
The rest of this paper is organized as follows. Section 2 presents a summary of related literature on diagram ink recognition. Section 3 presents the methodology used to develop our recognizer. Following this, Section 4 describes the data and ink features used in our study. Section 5 provides the details of our data mining analysis performed to identify the most suitable algorithms for our diagram recognition problem. We then present the results of an evaluation of RATA.Gesture against four other recognizers in Section 6. Finally the paper ends with the discussion and conclusions.
2. RELATED WORK
Obtaining information about the digital ink strokes is the key to recognition; the way this information is deduced decides the mechanism used in recognizers. Some use similar approaches to image processing by matching shape templates against input (e.g., Gross, Reference Gross1994; Kara & Stahovich, Reference Kara and Stahovich2004; Wobbrock et al., Reference Wobbrock, Wilson and Li2007). Others hard-code the threshold of ink features for each gesture (Sezgin et al., Reference Sezgin, Stahovich and Davis2001; Calhoun et al., Reference Calhoun, Stahovich, Kurtoglu and Kara2002; Fonseca et al., Reference Fonseca, Pimentel and Jorge2002; Yu & Cai, Reference Yu and Cai2003). A third group also uses features, but they combine the features with machine learning algorithms to train the recognizers (e.g., Rubine, Reference Rubine1991; Fonseca et al., Reference Fonseca, Pimentel and Jorge2002; Hammond et al., Reference Hammond, Eoff, Paulson, Wolin and Dahmen2008).
Template matching approaches are similar to many image processing techniques: a user creates a number of example shapes that are used as templates. These templates are constructed by standardizing the number of points, rotating to a standard position, and scaling to a standard size. Data to be recognized is manipulated using the same process and then pixel matched to the templates. Examples of recognizers using this approach are (Gross, Reference Gross1994; Kara & Stahovich, Reference Kara and Stahovich2004; Wobbrock et al., Reference Wobbrock, Wilson and Li2007). Although these recognizers are extendable, they do not utilize the full information of the ink strokes and the pre-processing limits the range of shapes that can be recognized. For example the rotation makes it difficult to differentiate rectangles from diamonds. Other image-based recognizers include (Ouyang & Davis, Reference Ouyang and Davis2009; Fu & Kara, Reference Fu and Kara2011). Reported recognition rates vary from 87% (Kara & Stahovich, Reference Kara and Stahovich2004) to 99.02% (Wobbrock et al., Reference Wobbrock, Wilson and Li2007).
Both hard-coded and trainable recognizers use computable features of the ink (such as stroke length and curvature), as opposed to pixel data used by template matchers. Hardcoded recognizers (Fonseca et al., Reference Fonseca, Pimentel and Jorge2002) apply fixed thresholds to the different features to differentiate the classes of interest. For example, closed shapes such as a circle have the start and finish points “close together.” The thresholds have been arrived at either heuristically (Sezgin et al., Reference Sezgin, Stahovich and Davis2001; Yu & Cai, Reference Yu and Cai2003) or by statistical methods (Fonseca et al., Reference Fonseca, Pimentel and Jorge2002; Patel et al., Reference Patel, Plimmer, Grundy and Ihaka2007). Although such an approach is effective in distinguishing lines and arcs in segmentation problems (Sezgin et al., Reference Sezgin, Stahovich and Davis2001; Calhoun et al., Reference Calhoun, Stahovich, Kurtoglu and Kara2002; Yu & Cai, Reference Yu and Cai2003), they have limited flexibility for application to more complex recognition tasks. Furthermore, systems built this way are cost ineffective: a lot of effort is required to extend the number of supported shapes (Apte et al., Reference Apte, Vo and Kimura1993; Fonseca et al., Reference Fonseca, Pimentel and Jorge2002).
Training based approaches support flexibility by converting ink data to features, and applying machine learning techniques to find relationships (Rubine, Reference Rubine1991; Fonseca et al., Reference Fonseca, Pimentel and Jorge2002; Hammond et al., Reference Hammond, Eoff, Paulson, Wolin and Dahmen2008). Many different features are reported but few have applied a large number of features, except (Willems et al., Reference Willems, Niels, Gerven and Vuurpijl2009) which has 758 features (although these are a recombination of a base set of 48 features). The other part of the training-based approach is the machine learning algorithms employed. Most studies have reported on the use of one or two algorithms. Reported recognition rates for trainable recognizers are in the range 95.1% (Fonseca et al., Reference Fonseca, Pimentel and Jorge2002) to 99.2% (Willems et al., Reference Willems, Niels, Gerven and Vuurpijl2009). This approach is promising, yet not fully explored. A similar area, multimedia machine learning, reports many successful applications. They suggest the application of rich feature sets (Basili et al., Reference Basili, Serafini and Stellato2004; Vogt & Andre, Reference Vogt and Andre2005) and comparing different algorithms to rank the effectiveness of each (Connell et al., Reference Connell, Sinha and Jain2000; LaViola & Zeleznik, Reference LaViola and Zeleznik2004; Tay, Reference Tay2008).
Many recognizers have high classification rates reported, however, results of a comparative evaluation conducted show that these rates are very hard to replicate (Schmieder et al., Reference Schmieder, Plimmer and Blagojevic2009). Schmieder et al. evaluated $1, Rubine, CALI and PaleoSketch, among other basic shape recognizers, using two different data sets. These recognizers were unable to reach the classification rates reported independently. This suggests a lack of flexibility in such recognizers.
Data mining tools such as WEKA (Witten & Frank, Reference Witten and Frank2005) and RapidMiner (Mierswa et al., Reference Mierswa, Wurst, Klinkenberg, Scholz and Euler2006) provide many data mining algorithms. A large variety of features have been used in different ink recognition projects, and most are assembled into the feature library in DataManager (Blagojevic et al., Reference Blagojevic, Plimmer, Grundy and Wang2008). In this project we combine the feature library of DataManager with the algorithms in WEKA to identify the most suitable algorithms for gesture recognition.
3. METHODOLOGY
This section describes the methodology adopted to apply data mining to digital ink gesture recognition. Data mining requires computable features, data, and algorithms. We describe our data collection method: we collected data that represented the diagram domain and construct a data set using a feature library. The next section outlines the systematic approach taken to select and tune appropriate algorithms for analysing the data and find patterns distinguishing gestures using data mining techniques. Finally, the evaluation method for the resulting recognizer against others is described.
3.1. Data collection
The first step of this study is to collect training data. There is no way to collect data that represents the complete hypothesis space for the diagram domain because it includes an infinite number of different diagram types and shapes. Instead we carefully select multiple types of diagrams to capture different perspectives of the diagram domain.
Our requirements are that the collected diagrams must be real diagrams that are used in the real world. They must contain a good variety of characteristics and complexity, which is important for training data mining algorithms well. In addition, in keeping with the gesture recognition problem, all shapes that are contained in the diagrams must be drawn with a single stroke.
Once the targeted diagram types are determined, training data is collected and labeled. Two methods exist for collecting data; they can either be collected as complete diagrams (in situ collection) or as isolated shapes (isolated collection). In situ collection requires the user to plot a whole diagram of the targeted diagram domain. Isolated collection considers only the individual shapes. In comparison, isolated collection is easier: participants only need to know how to plot these shapes. Furthermore, in situ collection takes more processing time because the collected data needs to be labeled manually, whereas in isolated collection, because the shapes are already separated, this process is not required.
Studies have shown that in situ collection of data can have a significant positive effect on recognizer accuracy (Schmieder et al., Reference Schmieder, Plimmer and Blagojevic2009), especially when user data is included in training (Field et al., Reference Field, Gordon, Peterson, Robinson and Stahovich2009). Therefore, although most of our data are collected using this method, one set is similar to most other publically available data set of individual shapes.
Each stroke is manually labeled so that the data mining algorithms can train classifiers based on these classifications. Ink features are calculated from these labeled strokes using the DataManager feature library (Blagojevic et al., Reference Blagojevic, Chang and Plimmer2010). These features provide data mining algorithms with computable information regarding the characteristics of the stroke to use for training the classifiers.
3.2. Data mining
Once all features are assembled into a data set they are ready for data mining. Data mining is the process of using machine learning algorithms to find patterns in data. These patterns are used to classify data into the classes of interest, in this case, into shape classes. We use WEKA (Witten & Frank, Reference Witten and Frank2005), a data mining tool, to perform our analysis. WEKA has over 100 machine learning algorithms that can be used for such an analysis.
Our analysis consists of four steps:
1. algorithm exploration,
2. tuning,
3. feature selection, and
4. 3nsembles.
Although WEKA provides many algorithms, not all of them are suitable for our data set. In addition, an exhaustive search of all algorithms and their corresponding parameters would be impossible given the size of the search space, the computational resources available, and time required. Therefore, to identify the most suitable algorithms for the diagram recognition domain we first explored a large number of algorithms and used a systematic approach to narrow them down to the best performing algorithms. An algorithm may not be suitable for many reasons: for example, it may lack accuracy for digital ink recognition problems due to its simplicity, or it may be designed to only support nominal attributes when most of our calculated features are numeric.
The second step of our analysis is to tune the chosen algorithms by experimenting with various parameter settings and comparing a tuned algorithm to one with default settings. Performance of a classifier can be judged by three aspects: the accuracy, the time required to test input data, and the time required to train it. The accuracy is the most important attribute, since a classifier that cannot classify accurately is of little use. Because we aim to build recognizers for eager recognition, there is little tolerance for the time to test input data; it needs to be fast enough so users will not have to wait before drawing the next stroke. Time to train a classifier is relatively unimportant, because it happens only once in the life cycle of a classifier; however, if a classifier takes much longer to train without producing significantly greater accuracy, the faster versions would be considered better in this study.
In the third step we investigate the use of feature selection. An algorithm may consider all the given features. However, there may be misleading or duplicated information in these features which can potentially affect the performance of the generated classifier. We believe selecting better features has the potential to improve the algorithms. Instead of finding better features and removing them heuristically, WEKA provides a special meta classifier called “attribute selected classifier,” which allows users to specify an attribute evaluator and an algorithm to use, and it will apply the evaluator to find the better features first and use them in the algorithm.
The fourth and final stage of our analysis involves the exploration of algorithm ensembles to further improve recognition results. Previous studies (Connell et al., Reference Connell, Sinha and Jain2000; Alimoglu & Alpaydin, Reference Alimoglu and Alpaydin2001; Kara & Stahovich, Reference Kara and Stahovich2004) have shown that accuracy may be improved by combining algorithms. However, this was not the case with Blagojevic (Reference Blagojevic2011), where the ensembles produced worse results. Two methods of combining the algorithms are explored. The first is voting: this method takes a group of algorithms and combines their individual classifications together by a probability based vote. The classification with the highest vote wins. The second method is stacking, where each algorithms results are weighted based on their performance in different areas. Various combinations of algorithms and methods are considered during the experiment, because each algorithm performs differently, and even a worse performing algorithm can aid recognition if it has strengths in an aspect that is not so well covered by other algorithms.
3.3. Evaluation
To test the performance of our new recognizer we evaluate it against existing recognizers supported in the Evaluator (Schmieder et al., Reference Schmieder, Plimmer and Blagojevic2009). The evaluation includes data sets that are not used in the data mining analysis process, to ensure the resulting recognizer from our analysis can be applied not only to the training domains but also to other diagram domains. If our recognizers overall performance is superior to others then data mining is shown to be a good approach in sketched diagram recognition. Even if, on particular data sets, there is no significant difference between our recognizer and the recognizer designed for that data set, our recognizer is still beneficial because of its flexibility.
4. DATA AND INK FEATURES
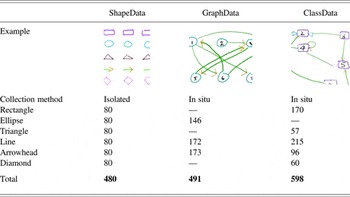
A data set of feature vectors is required to run an initial trial on the algorithms; data sets are also necessary for the remaining data mining analysis steps. For the initial identification of possible algorithms a small simple data set of graph drawings was used. For the more critical algorithm tuning, feature selection and ensemble investigations, three diagram sets were collected from 20 participants. As we concentrate on single stroke recognition, the participants were asked to draw each component in a single stroke. A summary of the data in each is shown in Table 1.
Data sets used for our analysis

Note: A colour version of this table can be viewed online at http://journals.cambridge.org/aie
Shapes data set (ShapeData) includes six shapes, each drawn in isolation with no relationship with other shapes. This simulates isolated collection as described in Section 3.1. All shape classes used in other data sets can be found within ShapeData. Directed graph data set (GraphData) includes three shape classes, in which a certain relationship is present between them. Although the diagram is relatively simple, it includes arrowheads, which are well known as a difficult component to recognize (Kara & Stahovich, Reference Kara and Stahovich2004; Freeman & Plimmer, Reference Freeman and Plimmer2007). The class diagram data set (ClassData) includes five shapes with relationships between them. They represent more difficult diagrams: more shape classes and more complex relationships.
The data sets are roughly differentiated by the number of shape types and the collection method. A variety of data sets should ensure the tuned algorithms can be applied to different diagram types.
These data sets were collected and labeled in DataManager (Blagojevic et al., Reference Blagojevic, Plimmer, Grundy and Wang2008). From the labeled sketches we used DataManager's feature library to compute ink features; with the current version it is capable of generating 114 features (Blagojevic et al., Reference Blagojevic, Chang and Plimmer2010). These features measure aspects of individual strokes such as curvature, size, density, and spatial and temporal relationships to other strokes in the diagram. They can be calculated in 0.087 s for each stroke (Intel® Core™2 Duo Processor E8400 and 4 GB of RAM). Data Manager's feature library is available online at http://www.cs.auckland.ac.nz/research/hci/downloads/.
Additional data was collected for our final evaluation; these data sets are described in Section 6.
5. DATA MINING ANALYSIS
Several steps were used in our analysis and training of algorithms to build a recognizer. First the full range of suitable WEKA algorithms was tested (Section 5.1) and a set of well performing algorithms were selected for tuning (Section 5.2). The tuning process used feature data from the three different data sets described in Section 4. In the next step we applied feature selection (Section 5.3) in an attempt to eliminate features that are not useful. After ranking (Section 5.4), the tuned algorithms were used together with the data sets to explore ensemble strategies (Section 5.5), again using WEKA algorithms.
These experiments require a lot of computational power. Initially only one machine, an Intel® Core™2 Duo Processor E8400 and 4 GB RAM, was used. In the later stages three machines with similar specifications, and two virtual machines based on Intel® Xeon® Processor E7330 and 2GB memory were employed. However, on any of these machines there are experiments that can take weeks to complete.
The details of each step in our analysis and the results obtained are described in the following sections.
5.1. Algorithm exploration
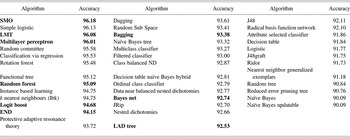
WEKA (Witten & Frank, Reference Witten and Frank2005) was selected to supply the data mining algorithms: it is an open source tool that provides many data mining techniques. Because WEKA is developed to support different data mining problems, each algorithm exposes settings that can be altered for tuning. WEKA includes many algorithms and not all are suitable for ink feature data. We analyzed all possible algorithms provided by WEKA, with their default settings, on a simple graph data set. Among those algorithms, 40 stood out as having higher accuracy than the others (greater than 90%); the results from these algorithms are shown in Table 2. Algorithms which failed to classify the data set or achieved poor accuracy were not considered further.
Algorithm exploration results for those over 90%

Note: Final candidates are in bold. Details of the algorithms are available in Witten and Frank (Reference Witten and Frank2005).
Although many algorithms were filtered off, there were still 40 algorithms remaining. For practical reasons we needed to narrow this set further: tuning and testing each algorithm took many hours of computation time (some 10-fold cross validation runs took 3 weeks). We could have simply picked the top performing ones from this stage of our analysis. However, it is clear from related research that algorithm performance varies depending on the data set. In addition, some algorithms respond well to tuning of parameters therefore we did not want to rule them out at this stage. Furthermore, because we planned to explore combining algorithms with ensemble techniques, algorithms with strengths in different aspects are desirable.
Eight algorithms were selected as worthy of further investigation. These algorithms represent a range of different approaches, including tree generating algorithms, a support vector machine, a neural network and meta-algorithms. In addition we added the Bayesian network (BN) as it was applied in a previous study (Sezgin & Davis, Reference Sezgin and Davis2007). Although there are classifiers that appear to have better performance, they were excluded either because they have limited tuning capabilities or are very similar to other algorithms that are included.
To summarize, our selection process was a combination of performance on the initial data set, tune-ability of the algorithm, covering a range of techniques and including some algorithms that had been used by others for digital ink. The nine selected algorithms are the following:
1. bagging (BAG; Breiman, Reference Breiman1996).
2. BN (Ben-Gal, Reference Ben-Gal, Ruggeri, Faltin and Kenett2007).
3. ensembles of nested dichotomies (END; Frank & Kramer, Reference Frank and Kramer2004; Dong et al., Reference Dong, Frank and Kramer2005).
4. alternating decision tree (using the LogitBoost strategy; LAD; Holmes et al., Reference Holmes, Pfahringer, Kirkby, Frank and Hall2002).
5. LogitBoost (LB; Friedman et al., Reference Friedman, Hastie and Tibshirani2000).
6. logistic model trees (LMT; Landwehr et al., Reference Landwehr, Hall and Frank2005; Sumner et al., Reference Sumner, Frank and Hall2005)
7. multilayer perceptron (MLP; Minsky & Papert., Reference Minsky and Papert1969; Rumelhart et al., Reference Rumelhart, Hinton and Williams1986).
8. random forest (RF; Breiman, Reference Breiman2001).
9. sequential minimal optimization (SMO; Hastie & Tibshirani, Reference Hastie and Tibshirani1998; Platt, Reference Platt1999; Keerthi et al., Reference Keerthi, Shevade, Bhattacharyya and Murthy2001).
5.2. Tuning
Most algorithm in WEKA contains settings which can be adjusted to alter the nature of that algorithm. The tuning conducted on each algorithm was a five step process:
1. measure base performance from default settings,
2. tune each parameter setting independently,
3. combine optimal individual parameters to produce a tuned algorithm,
4. compare the tuned algorithm with base algorithm, and
5. select the more promising one.
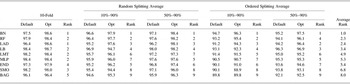
In the first step the data sets were used to train and test each algorithm with the default settings using 10-fold cross validation. The results for this are shown in Table 3 in the 10-Fold: Default column.
Tuned algorithm results and rankings

Mean of tests over the three data sets described in Section 4.
Next we looked at the parameter settings available for each algorithm in turn (WEKA makes different parameters available depending on the algorithm: e.g., users can specify the number of trees for RF). Where algorithms have multiple parameters each was considered individually; default values were used with the exception of the one being analyzed. Most parameters are binary or numeric; both states were applied if they were binary, and a series of different values was used for numeric parameters. The settings were applied to each data set independently. For each setting, the accuracies generated by changing its value were compared, and the value that returned the highest accuracy at the lowest cost was taken as the optimal value. In most cases the optimal setting was the same or had the same trend across data sets. If a setting had different effects on different data sets, the average of the data sets was taken.
The tuned algorithm is that with all the individual parameters set at their average optimal value. The detail of the tuning of each algorithm is described in Subsections 5.2.1–5.2.9. Many parameter settings did not make large differences to the results we obtained; we only report those that did.
We did not consider the effect of different combinations of settings because of practical time and computational constraints. Although each individual setting performs well with its optimal value, combining optimal values does not necessarily give the best results. Hence for each tuned algorithm we repeated the 10-fold cross validation (Table 3, 10-Fold: Opt column).
However, while 10-fold cross validation can reduce the effect of overfitting, it is not perfect for diagram recognition because cross validation randomly selects training examples from the data set, and therefore each participant could participate in training data as well as testing data. Such situations are too optimistic for “out of the box” recognizers where users are different from the ones who provided training data. Based on this consideration two splitting experiments, random splitting and ordered splitting, were conducted. For each experiment, the data is split into training and testing. A 10% splitting indicates 10% of the data was selected for training and the remaining 90% for testing. Nine different splits were chosen, from 10% to 90% with 10% intervals.
Random splitting selects training examples randomly from the input data. To remove the noise the average of all rounds is taken. Although a participant can still appear in both training and testing, this experiment shows the relationship between the number of training examples and the accuracy. Ordered splitting selects training examples from the start of the data set. For example, with a data set of 500 strokes, 10% splitting will take the first 50 strokes as training examples, while the rest become testing examples. Because our data sets were organized in the order of participants, and the numbers of strokes drawn by each of the 20 participants is similar, we can assume that each 10% in ordered splitting is equivalent to two participants, which ensures the training examples are from different participants who presented testing examples. The average results for the random and ordered splitting results are presented in Table 3. We noted that all algorithms had increased accuracy with more data, and all reached their maximum accuracy with less than 50% of the data.
In the following subsections we detail the tuning of each algorithm. We report those parameters that were effective and compare the training and classification times for the tuned and untuned algorithm.
5.2.1. BAG
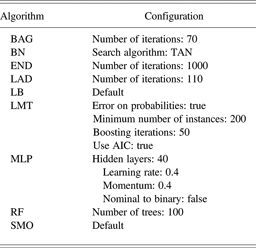
Several parameters are available in WEKA for BAG (Breiman, Reference Breiman1996). We investigated each parameter; the only one to make a noticeable difference to the accuracy was the number of iterations. Bagging uses an ensemble of trees for classification. One tree is generated during each iteration of the BAG algorithm; in other words the more iterations Bagging runs the larger voting committee it will have. With our data, a steady state was achieved between 50 and 100 iterations (depending on data set); we chose to use 70 iterations.
Using 70 iterations, as opposed to the default setting of 10 iterations, results in an increase in accuracy by 0.4% on average. A z test shows that this difference is not significant (SD < 0.01, p = 0.53). In contrast, the training time is eight times longer. Because with both settings the classification time is <0.01 s and the tuned algorithm results in improvements for all data sets, we believe altering the number of iterations can be considered. However, it is not necessary as the difference in accuracy is not statistically significant.
5.2.2. BN
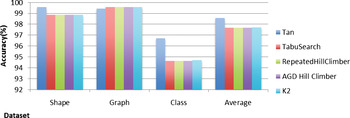
A BN (Ben-Gal, Reference Ben-Gal, Ruggeri, Faltin and Kenett2007) uses a directed acyclic graph to perform classification. A search method must be used to construct the network during training. We tuned the BN by investigating different search algorithms. Five search methods were investigated. We found that compared with K2, the default algorithm, TAN performs significantly better on average, according to a z test (SD < 0.01, p < 0.01). Based on these results we selected this setting for further tests (see Fig. 1).
The accuracy of the Bayesian network versus search algorithms. [A color version of this figure can be viewed online at http://journals.cambridge.org/aie]

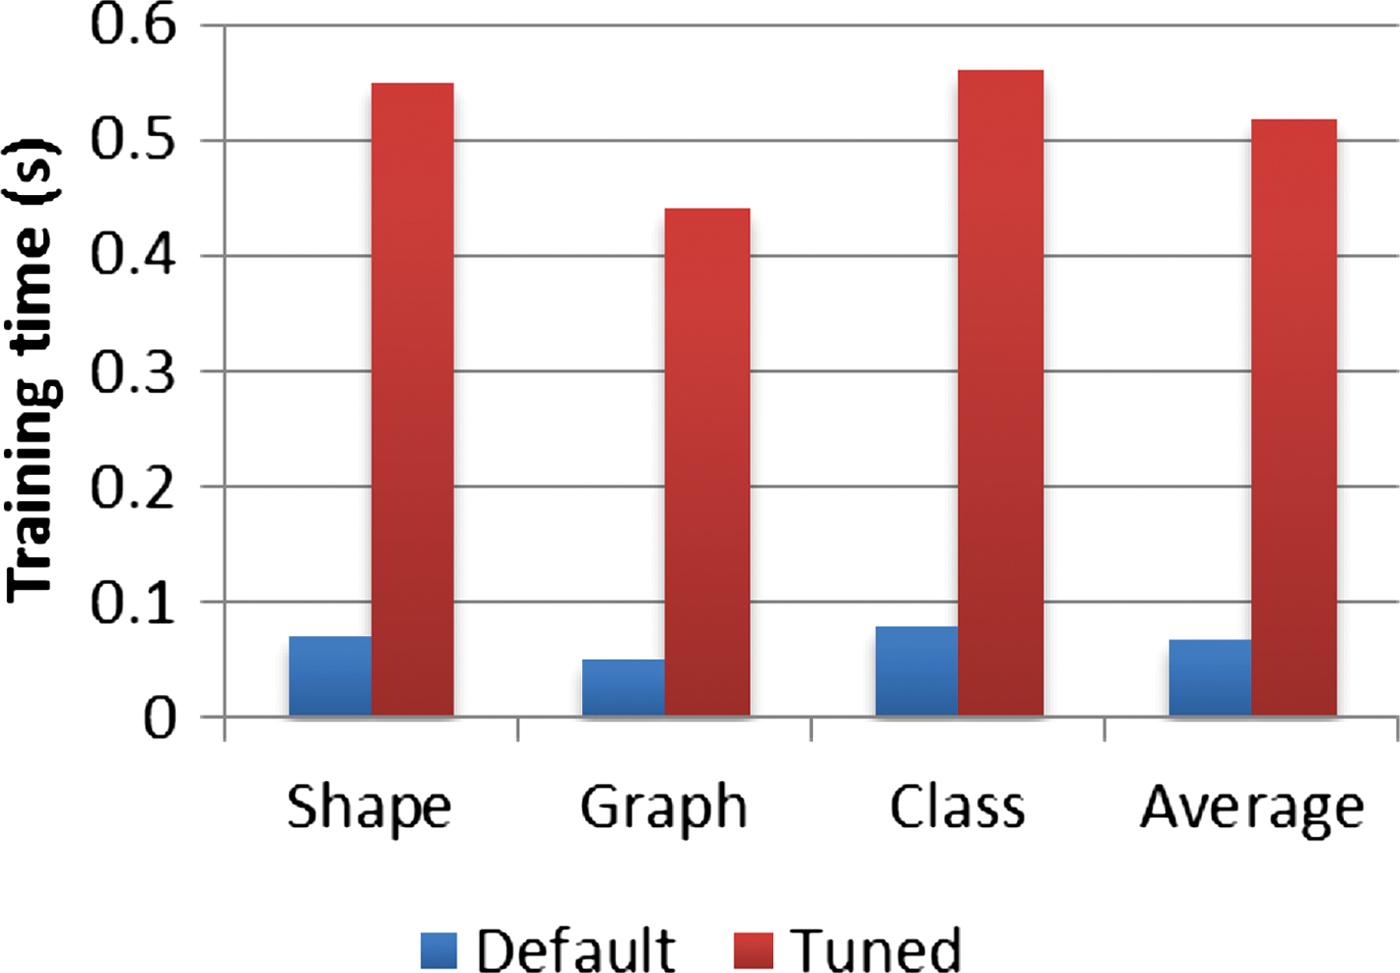
Greater improvements in accuracy are observed for the more complex data set, class diagrams. Although training time is higher than with the default search method (see Fig. 2), compared with other algorithms the training time of BN is relatively small. The maximum classification time observed is <0.01 s. We did not observe great differences in performance when investigating other parameters of the BN.
The training time of the Bayesian network with default and tuned settings. [A color version of this figure can be viewed online at http://journals.cambridge.org/aie]
5.2.3. END
END (Frank & Kramer, Reference Frank and Kramer2004; Dong et al., Reference Dong, Frank and Kramer2005) uses an ensemble of trees. We tuned this algorithm by varying the number of trees produced, which is set by the number of iterations performed. We tried iterations between 0 and 1000 (the default setting is 10).
We compared the accuracy of END with three settings: the default 10 iterations, 50 iterations, which is when the algorithm reaches good performance, and 1000 iterations which is the average best performing setting. We found that the accuracy for tuned algorithms is higher than the default for all data sets, although our z test between the default and 1000 iteration models showed no significant difference (SD < 0.01, p = 0.12). Training times for the tuned models are also higher.
We observed large differences in classification times with 50 and 1000 iterations, where average classification time for 1000 iteration is 0.48 s as opposed to 0.01 s for 50 iterations. The classification time is also related to the number of targeted classes in each data set. For example with 1000 iterations END requires only 0.2 s for the simple GraphData data set, but more for the other data sets.
Because during the experiment END with 1000 iterations demonstrated better accuracy (although not statistically significant), it was selected to be further analyzed in the following experiments. We investigated other parameters for END, however none had a noticeable effect on its performance.
5.2.4. Alternating decision tree (using LAD)
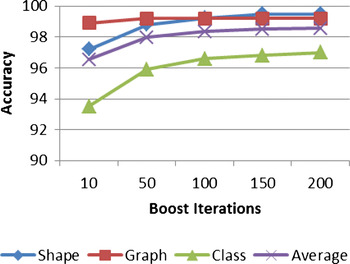
LAD (Holmes et al., Reference Holmes, Pfahringer, Kirkby, Frank and Hall2002) constructs a tree for classification. The size of the tree is specified by the number of boosting iterations. We tuned this parameter by trying values between 0 and 200. We observed that levels of accuracy reached a maximum around 110 iterations on average (see Fig. 3).
The accuracy of alternating decision tree (using the LogitBoost strategy) versus the number of boosting iterations. [A color version of this figure can be viewed online at http://journals.cambridge.org/aie]

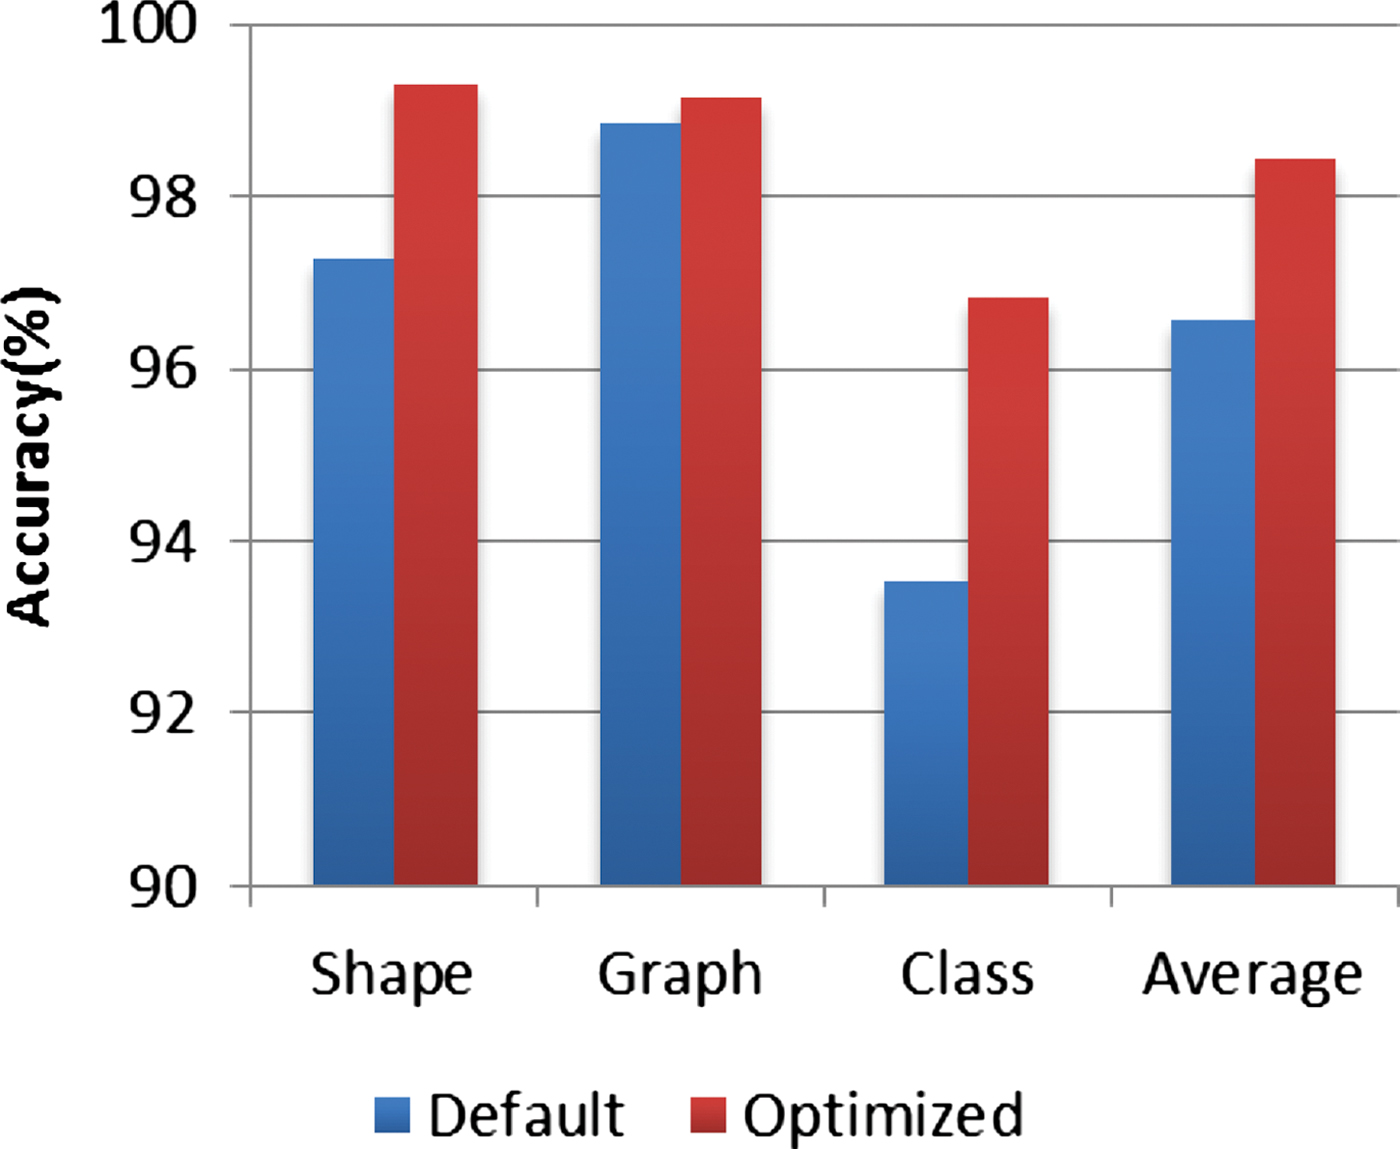
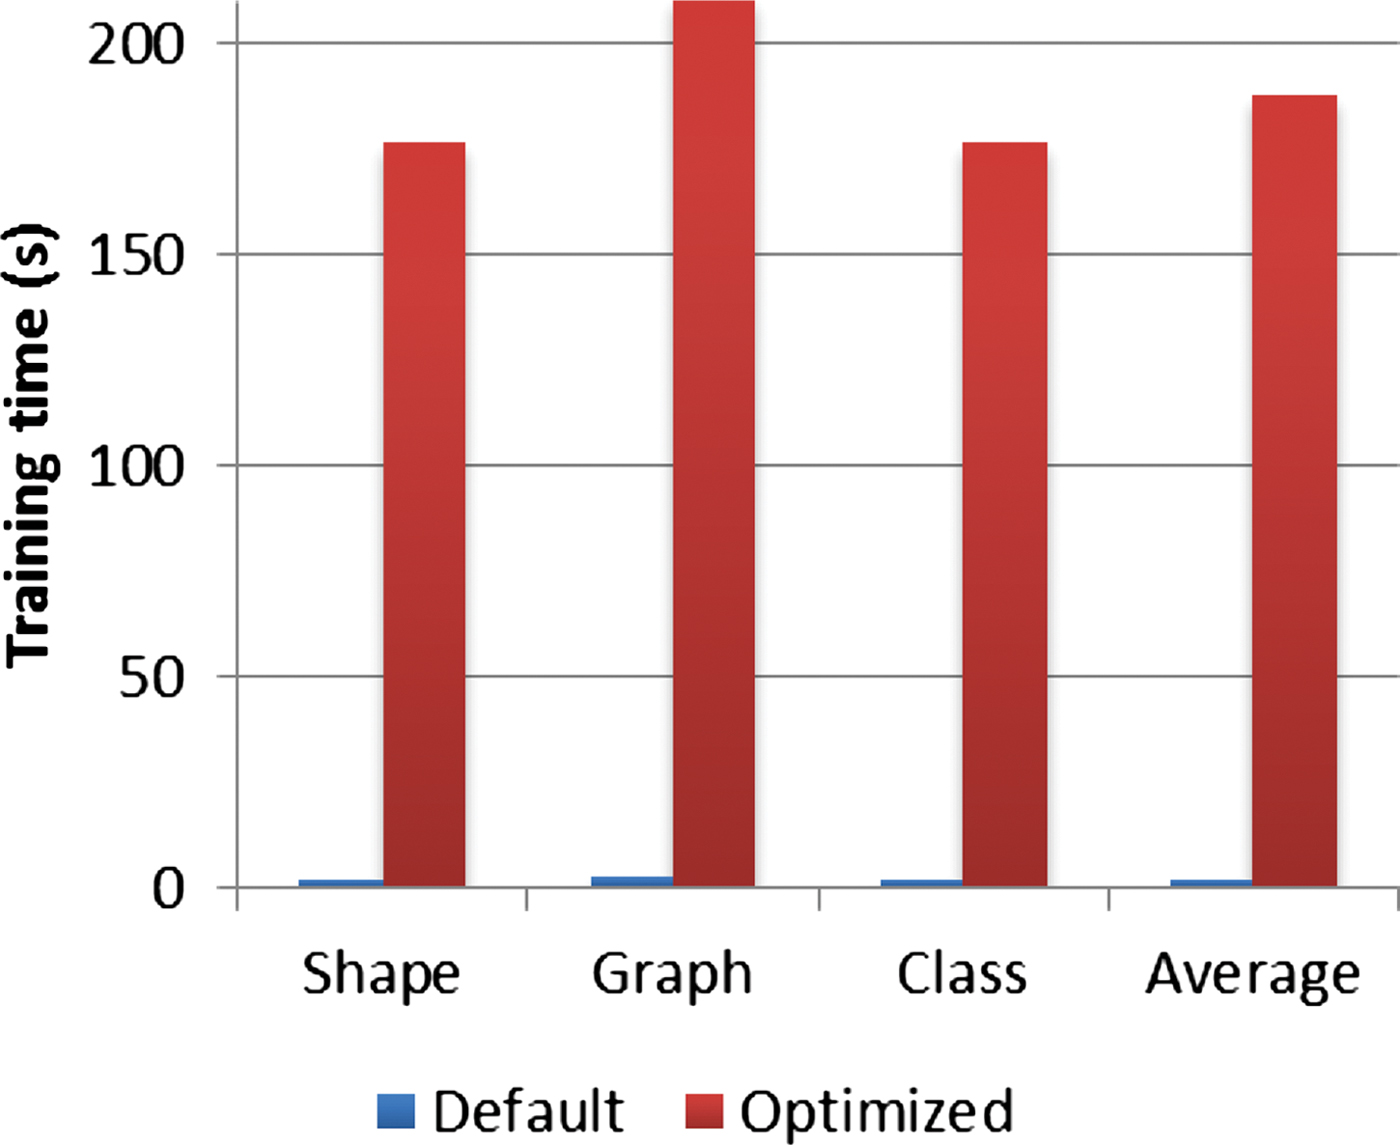
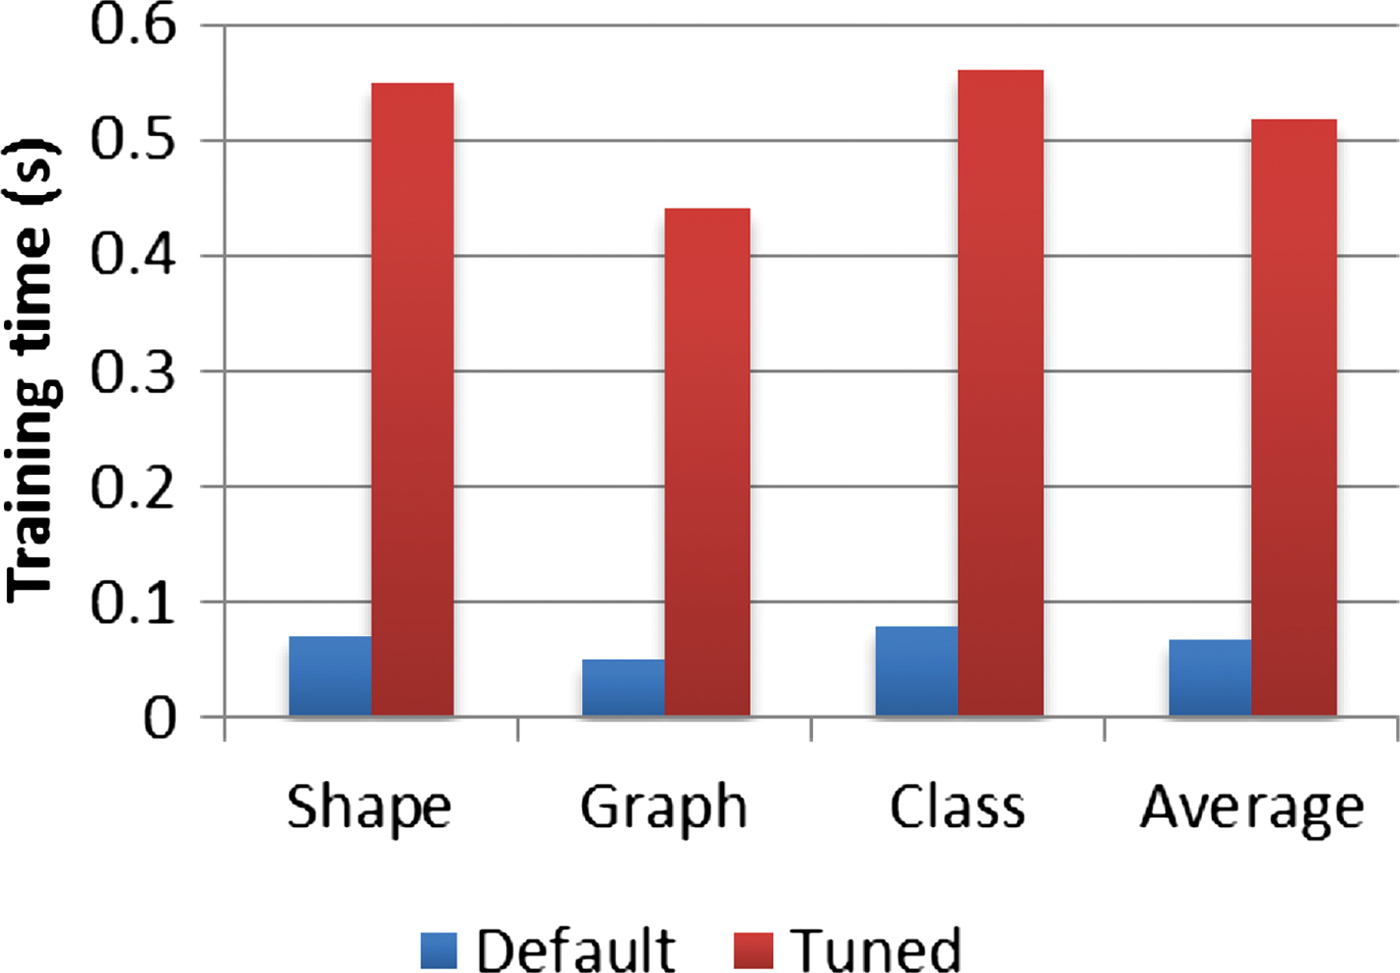
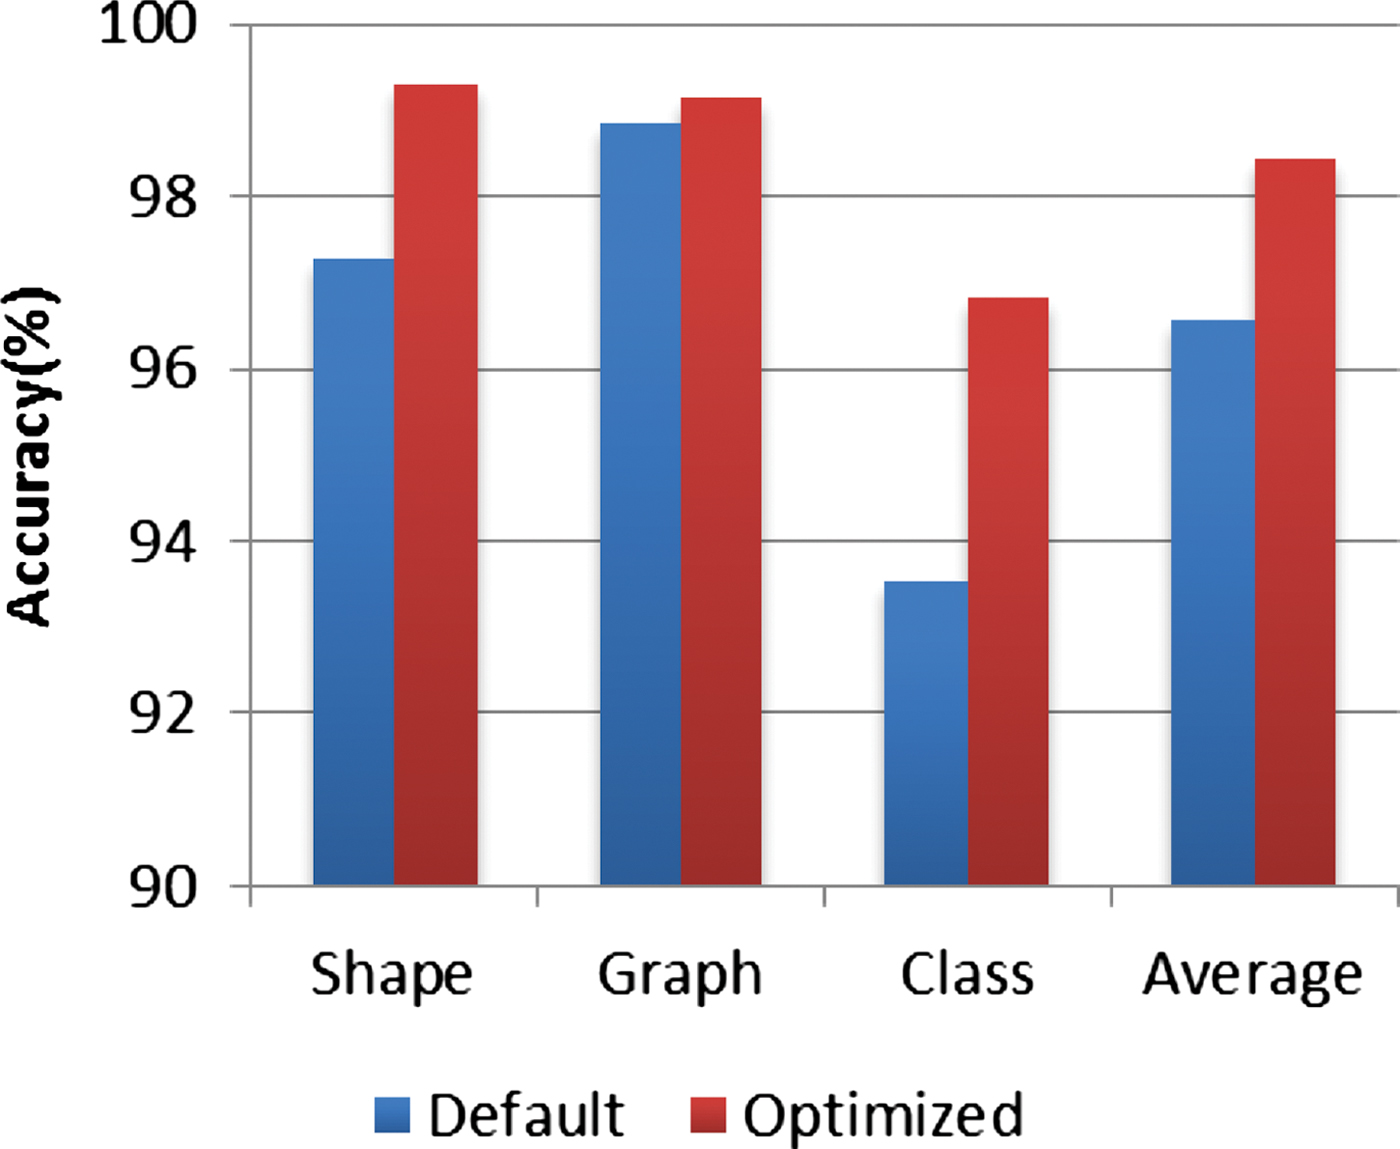
In comparison to the default value of 10 boosting iterations, this setting gives significantly more accurate, results on average according to a z test (SD < 0.01, p < 0.01; see Fig. 4). However, the training time also increased by a large amount (see Fig. 5). Because the maximum classification time in both cases is <0.01 s, we believe this tuned model is suitable for eager recognition. However, users must be aware of the long training time required.
The accuracy of alternating decision tree (using the LogitBoost strategy) with default and tuned settings. [A color version of this figure can be viewed online at http://journals.cambridge.org/aie]
The training time of alternating decision tree (using the LogitBoost strategy) with default and tuned settings. [A color version of this figure can be viewed online at http://journals.cambridge.org/aie]
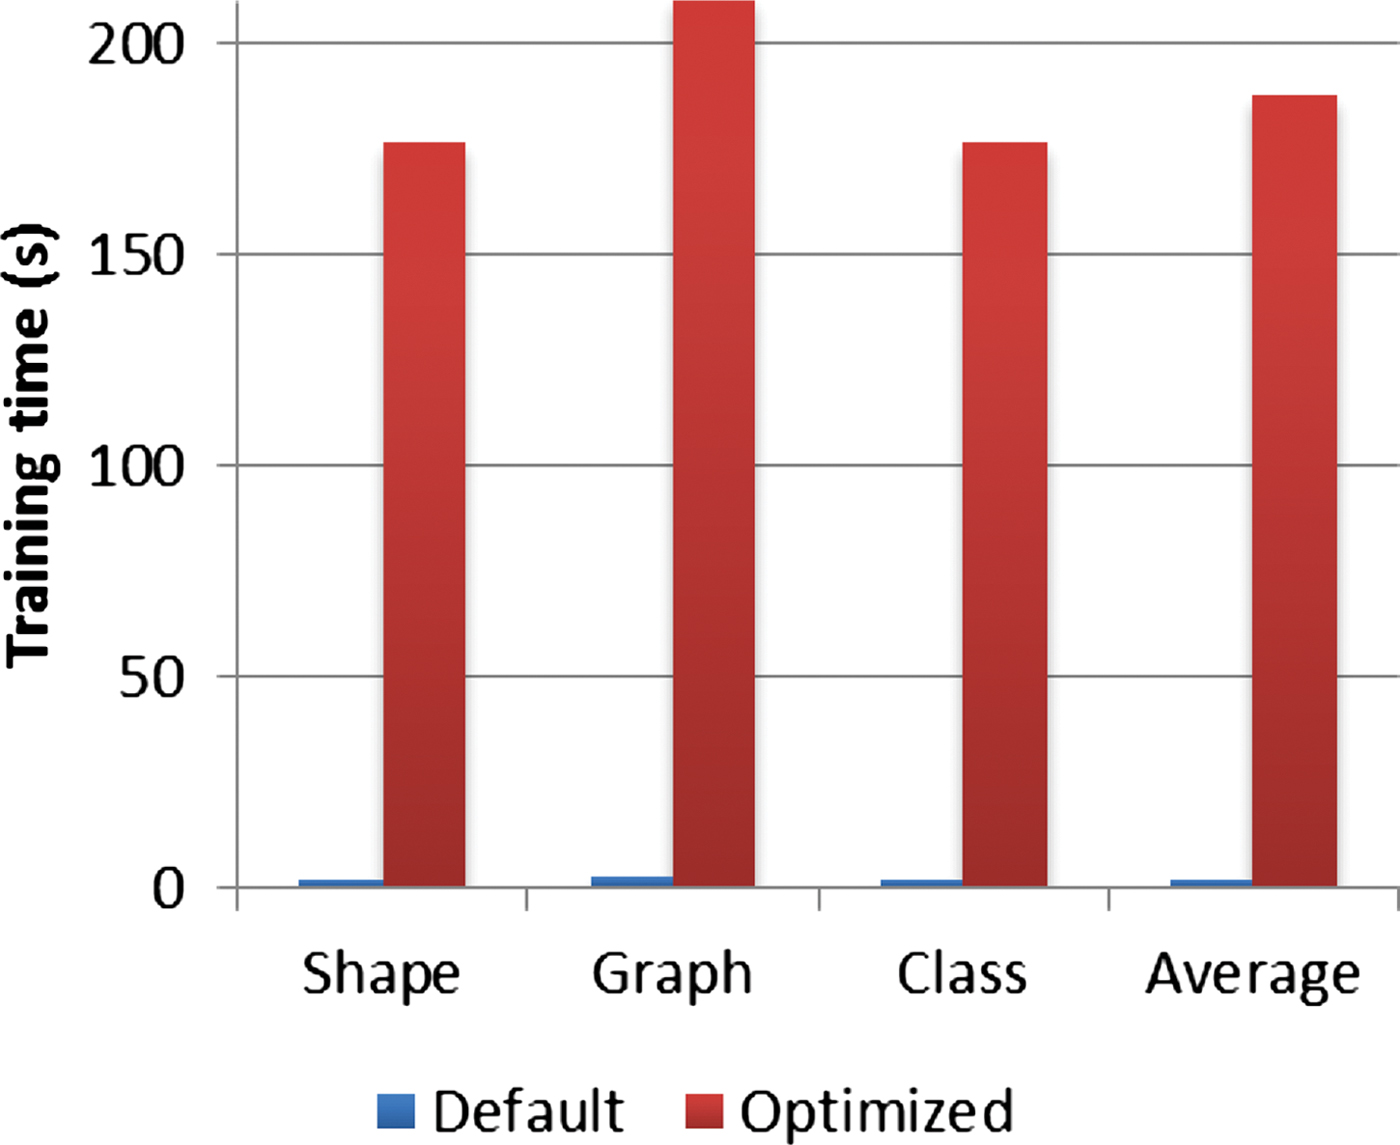
Furthermore the improvements observed for complex diagrams are larger. Although the improvement in GraphData is small, ClassData has accuracy levels over three percent higher using the tuned setting over the default configuration. According to Figure 3, the classification accuracy of ClassData is still increasing with more iterations; hence we believe with more complex data sets, potentially even more iterations can be applied.
5.2.5. LB
LB (Friedman et al., Reference Friedman, Hastie and Tibshirani2000) is an ensemble of trees. A new tree is constructed for each iteration of the algorithm during training. We tuned this algorithm by varying the number of iterations performed between 0 and 1000. We found that on average, 70 iterations is optimal.
We compared LB with its default configuration (10 iterations) to our tuned setting of 70 iterations. The accuracy for ClassData shows the most improvement with our tuned setting, while there are no large differences observed for the other data sets. ClassData is more complex than the other data sets in both the number of shapes and the way data is collected. We believe the reason it shows the greatest improvement is because a higher number of iterations is able to model this complex data set more accurately. A z test showed no significant difference on average between the default and tuned algorithm (SD < 0.01, p = 0.32).
The maximum classification time observed is <0.01 s. Other parameters were investigated for possible tuning, however we did not observe great differences with these experiments. Based on these results we decided to use the default configuration for LB in further tests.
5.2.6. LMT
LMT (Landwehr et al., Reference Landwehr, Hall and Frank2005; Sumner et al., Reference Sumner, Frank and Hall2005) is a tree with regression functions at each leaf, built using LB. Several parameters are available in WEKA for LMT. We investigated each parameter to determine if the algorithm's accuracy could be improved from the default settings in WEKA.
Four parameters were found to effect accuracy. The first parameter was the error on probabilities. This allows users to select the kind of error for the algorithm to minimize during training. Because each method of minimizing errors focuses on different perspectives, they behave differently; however, the difference between them should be marginal. According to our results, the default setting (false), which minimizes the misclassification error, is more suitable for complex data therefore we chose to set this parameter to minimize the root mean squared error instead (true).
The second parameter is the minimum number of instances for which a node is considered for splitting (default value = 15). We tried settings between 0 and 700 and found that the average maximum performance occurs at 200; therefore we selected this as the optimal setting.
The third parameter is the number of boosting iterations, indicating the number of iterations of LB performed throughout the tree. Values less than 1 (default value = –1) indicate cross validation will be used to find the optimal number of iterations. This setting aims to allow the algorithm to find the best configuration suitable for the input data. However, according to the results we believe this default setting is not optimal in our case. Furthermore, the cross validation adds additional overhead to the training process. We set this parameter to 50 based on our analysis results.
The last parameter tuned was “Use AIC” (default: false). The Akaike information criterion (AIC) is used for model selection to find the fitness of a statistical model. It is used by LMT to decide the best number of LB iterations. It has a positive effect toward more complex models, but has no effect on GraphData that is relatively simple therefore we chose to set this to true.
We compared LMT with the best settings we found for each of the four parameters described above to LMT with default settings. For most data sets the accuracy levels are higher with the tuned algorithm. However, a z test shows that there is no significant difference (SD < 0.01, p = 0.54). The training time is similar to the default or lower in some cases. Although there is no statistically significant difference in accuracy we decided to use the tuned LMT algorithm in further tests. The maximum classification time observed is <0.01 s.
5.2.7. MLP
MLP (Minsky & Papert., Reference Minsky and Papert1969; Rumelhart et al., Reference Rumelhart, Hinton and Williams1986) is an artificial neural network model which can represent nonlinear classifications. It has an input layer, hidden layers and an output layer. We investigated many parameter settings for MLP and found four parameters that we believed were worth tuning.
The first was the number of hidden layers. We tried values between 0 and 100. According to our data we observed that generally 10 or more hidden layers are enough for MLP to perform well. It appears to be complexity dependent, as we see the maximum accuracy for GraphData occurs at 20, ShapeData is slightly above 20 while ClassData is at 50. WEKA provides several wildcards for dynamic decision based on the number of features (used as the default setting). However, according to our data, these wildcards do not return the best result. We decided to fix the value at 40.
The second parameter is the learning rate (default value = 0.3). The learning rate defines the amount by which the weights for each connector are updated. A small learning rate is inefficient, requiring a long time to train, while a large learning rate emphasizes the impact of noise. Our results suggest that the learning rate should be below 0.6. The results also show that higher learning rates have a greater effect on more complex data sets. Based on our experiments we decided on a learning rate of 0.4.
The third parameter is momentum. The momentum value can smooth the weight changing process. A large momentum causes the weight to be updated rapidly and vice versa. We observed a decrement in accuracy with momentum over 0.8; we believe that this is because when a new training sample is introduced the weights can change very rapidly to overfit the model to this particular sample. We set momentum to 0.4 based on these observations.
The fourth and last parameter is the nominal to binary filter (default is true). Although this is intended to accelerate the process, it also affects the accuracy measure. Our results show that turning it off can result in higher accuracy.
We compared MLP with our tuned parameter settings to the default MLP algorithm. Although there is no difference in the results, the tuning speeds up the training time. This is a desirable characteristic considering that the accuracy is not affected. The maximum classification time is 0.1 s.
5.2.8. RF
RF (Breiman, Reference Breiman2001) is an ensemble of random trees. We tuned this algorithm to find the optimal number of trees to construct. We tried values between 10 and 1200 trees and found that, although more trees can increase the power of voting, the accuracy stabilizes for our data after 100 trees.
On average the level of improvement can be associated with the number of shape classes; the more classes the larger the improvement. This is because more relationships can be captured with a larger amount of trees.
We compared RF with default values (10 trees) and with 100 trees and found that the accuracy is higher with 100 trees. Although a z test showed that this difference is not statistically significant (SD < 0.01, p = 0.14). We also observed that 100 trees take 11 times longer to train than the default setting. Although the improvement in accuracy is not significant, we suggest using 100 trees because the level of accuracy was higher and stabilized at about this level, in addition the time to train is acceptable. With more data the differences may be statistically significant. The maximum classification time observed is 0.01 s.
5.2.9. SMO
After an investigation of the parameters of SMO (Hastie & Tibshirani, Reference Hastie and Tibshirani1998; Platt, Reference Platt1999; Keerthi et al., Reference Keerthi, Shevade, Bhattacharyya and Murthy2001) we found the algorithm performs well with the default settings. However, we decided to explore how the parameter to build logistic models behaves, because it returns probability measures that can be useful in many situations for further recognition steps. According to the experiment results, the accuracy decreases while the training time increases. A z test shows that there is no significant difference between the default and tuned models (SD < 0.01, p = 0.56). The maximum classification time is 0.03 s.
5.2.10. Summary of algorithm tuning
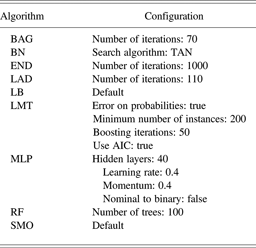
In summary, the effects of tuning varied among the algorithms. We found a significant difference between tuned and default algorithms for the BN and the LAD Tree. In most other cases the tuned models, although they had a higher accuracy, were not significantly different to the default models: in part this is because, although there is sufficient data for training, the data sets are not large, hence our decision to use some tuned algorithms regardless of the lack of significant improvement. The default configuration was chosen for only two algorithms, LB and SMO; their accuracy levels were not consistently higher for the tuned models in all tests (including ordered and random splitting tests). For all other algorithms the tuned models were chosen. Table 4 summarizes the configurations used for further testing based on our tuning analysis step.
Final algorithm configurations used for further analysis
5.3. Feature selection
The next step was an attribute selection experiment. As all 114 features were used, we were concerned about computation time for on-line, real-time recognition. Although it takes only 0.087 s to calculate on a desktop with an Intel® Core™2 Duo Processor E8400 and 4 GB of RAM, we reasoned that ineffective features should be discarded; furthermore, the addition of new features in the future will most likely increase the calculation time.
The AttributeSelectedClassifier with wrapper (Kohavi & John, Reference Kohavi and John1997) from WEKA was applied with all the selected algorithms using the final configurations shown in Table 4. WrapperSubsetEval, implemented in WEKA, was used as the evaluator. This allows the same classifier to be used for evaluating features and building a final model for classification. This evaluator is a suitable approach for attribute selection and it has been successfully applied to diagram recognition (Paulson & Hammond, Reference Paulson and Hammond2008). BestFirst was chosen as the search algorithm for its good performance.
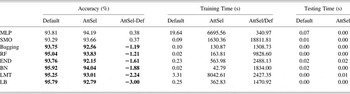
We compared the attribute selected algorithms with their default version. We used 20% random splitting where 20% of the data set was used for training and the remainder of the data for testing. The results are presented in Table 5; they show that most algorithms have poorer accuracy when attribute selection is applied (in bold) except MLP and SMO. There are two reasons that may explain this behavior. First, most of our selected algorithms applied a voting algorithm, which requires variation. Selecting a subset from the original feature set may eliminate effective features and reduce this variation, and further reduce the accuracy. Second, most of these algorithms generate tree structures, which split based on the more valuable features, hence attribute selection is not only redundant but can also accidentally remove useful features. In contrast, Multilayer Perceptron and SMO do not have the properties stated above; hence, by eliminating bad attributes they show improvement in accuracy. However, our z tests show that these improvements are not statistically significant (MLP SD < 0.01, p = 0.53; SMO SD < 0.01, p = 0.55). Unfortunately the experiment failed to run with LAD Tree; however, given the poor results obtained with the other algorithms we do not believe significant differences would be found with this algorithm.
Results of default settings versus attribute selected classifiers

Training times are consistently longer compared with the default, with factors from 340 to 18,800. This is due to the process of selecting attributes which uses 10-fold cross validation. In contrast, for some algorithms, MLP, SMO, and BN, the testing time is reduced. This is because the attribute selected algorithms used less features than the default versions, reducing the time taken for classification.
In summary, two algorithms had marginally improved accuracy, although not statistically significant. The training times increased considerably for all algorithms. We hence decided not to apply attribute selection any further in this study.
5.4. Algorithm ranking
In order to rank the algorithms we combined results from the different evaluations. We used the tuned algorithm except for SMO and LB for the reasons described above.
As noted above, the splitting experiments suggested algorithms have better performance with more training data. Reasoning that in real world usage more training examples will be available, rankings from splitting experiments with training data from 50% to 90% are included separately. However, because they are using the same information as used by random splitting (RS) and ordered splitting (OS), we decided not to treat RS50 and OS50 as equal weight. The ranking was calculated by applying a nominal ranking score (as shown in Table 3) to each algorithm for each experiment, and applying the following formula:

BN demonstrates the best overall performance, as shown in Table 3. LB is an interesting case: although it generally performs well, it produces a comparatively poorer performance with the full splitting experiments. Investigation suggested that this is because it tends to overfit with less training examples.
5.5. Ensembles
Two ensemble strategies were explored: voting and stacking. Voting combines classifiers by averaging the probability estimates of each class and making decisions on the highest possible classification. Stacking is more sophisticated: it applies two levels of classification by using a metaclassifier to classify the results returned by each contributing algorithm. As the metaclassifier should be relatively simple (Witten & Frank, Reference Witten and Frank2005), we tested Zero R, Naïve Bayes, J48, and Simple Cart; among which Naïve Bayes has the best performance. Surprisingly, the results show that voting has higher accuracy (about 1% more). Because voting also requires less training time, we focused on applying it as the ensemble strategy.
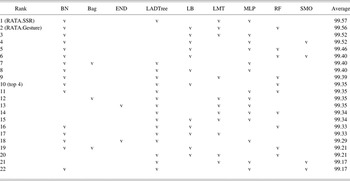
Different combinations of the base nine algorithms were explored (using the configurations shown in Table 6) to maximize the recognition rate and minimize the computation time; because nine algorithms have 502 possible combinations it was impractical to do an exhaustive search. After exploring a variety of strategies we applied the following steps using 10-fold cross validation:
1. Find the best number of algorithms by starting with all algorithms and progressively removing the lowest ranked algorithm. By comparing all the results, we found four contributing algorithms to be optimal.
2. Swap the worst performing of the four algorithms with a lower ranked algorithm and compare the results. If it improves the recognition rate retain it.
3. Repeat 2 for all algorithms.
Results of voting combinations with four algorithms

We found four algorithms provided the best results: the results of the 22 combinations with four algorithms we investigated are shown in Table 6. Our previous recognizer, RATA.SSR (Chang et al., Reference Chang, Plimmer and Blagojevic2010), was the ensemble that produced the highest results. However, after further use of this model we found it to be unstable.
We examined these faults and found its instability is a direct result of using the LAD Tree algorithm, which we could not easily correct to handle some types of missing values. The second ensemble, using BN, LB, LMT, and RF, is not significantly different to RATA.SSR with an average accuracy of 99.56%. There is very little difference between the results obtained for each combination tested.
A statistical z test was performed between this ensemble and the best performing individual algorithm, BN. On the average of all tuned results, it was confirmed that the difference was statistically significant (SD < 0.01, p = 0.01). We named this ensemble RATA.Gesture.
6. EVALUATION
To evaluate RATA.Gesture we have compared it with four other recognizers using one of our own data sets and two data sets that have been used to evaluate other recognizers.
The other recognizers used in the evaluation are $1 (Wobbrock et al., Reference Wobbrock, Wilson and Li2007), Rubine (Reference Rubine1991; as implemented in InkKit; Plimmer & Freeman, Reference Plimmer and Freeman2007), PaleoSketch (Paulson & Hammond, Reference Paulson and Hammond2008), and CALI (Fonseca et al., Reference Fonseca, Pimentel and Jorge2002). $1 and Rubine are trainable recognizers so any data set can be used. PaleoSketch and CALI, however, are hardcoded; thus, to be fair we must consider their effectiveness on the classes that we can reasonably map between the data sets used in the evaluation and what they can recognize.
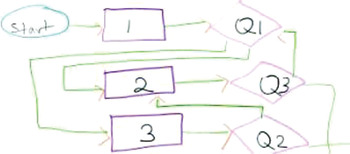
The data sets used in the evaluation are our own Flow-Chart data set, a $1 data set, and a PaleoSketch data set. The flowchart data set (Fig. 6) was collected at the same time and from the same participants as the data set described in Section 4. From the 20 participants there are 683 strokes which broken down by class are rectangle 99, ellipse 42, line 242, arrow-head 239 and diamond 61. They were collected and labeled in DataManager (Blagojevic et al., Reference Blagojevic, Plimmer, Grundy and Wang2008). With five shape classes, this data set represents difficult diagrams: more shape classes and more complex relationships.
An example diagram from the flowchart data set with strokes color coded by class. [A color version of this figure can be viewed online at http://journals.cambridge.org/aie]

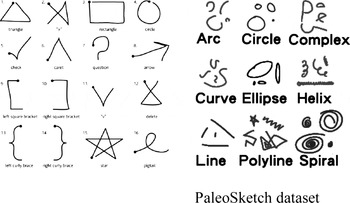
The $1 data set downloaded from (Wobbrock et al., Reference Wobbrock, Wilson and Li2009) has 16 different classes (Fig. 7). It has been collected as isolated shapes, in a similar way to our ShapeData, from 11 participants. The 16 shape classes have 330 examples per class. We converted the data to the DataManager format for the evaluation.
Data sets from other research: $1 data set from Wobbrock et al. (Reference Wobbrock, Wilson and Li2007).

The PaleoSketch data set with 9 classes (Fig. 7) was provided by (Paulson & Hammond, Reference Paulson and Hammond2008). It was also collected as isolated shapes and has data from 20 participants, with each drawing having approximately 10 examples of each shape. The shape classes are arc, circle, complex, curve, ellipse, helix, line, polyline, and spiral. Complex and polyline are catchall classes that do not represent any particular visual element; for example, the adjacent star and random shape in Figure 7 are both categorized as five line polygons. There are some corruptions in this file that we have not managed to identify, therefore we have 50% of the data for the evaluation. This provides ample examples for accurate results.
For the trainable recognizers, RATA.Gesture, $1 and Rubine, we split each data set in half, trained on one half and tested on the other, and then reversed the sets for another round. There were small differences between the results for each round, which are averaged for each data set.
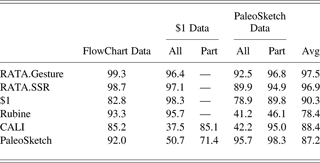
Evaluating the fixed recognizers, CALI and PaleoSketch, presented some problem; the raw tests when we did very simple mappings of obviously related shapes (such as ellipses and circles) resulted in very poor recognition rates 37.5% and 50.7%, respectively. For these recognizers we also report success rates for those shapes that appear in both the data set and recognizer. The FlowChart data set can be fully evaluated as there are matching classes for each class in CALI and PaleoSketch; however, they do classify some shapes as classes that do not exist in the flowchart, for example spirals. For the $1 data set, we removed Check, LeftCurly, Pigtail, RightCurly, and Star for PaleoSketch, using only Caret, Circle, LeftCurly, Rectangle, RightCurly, V and Triangle for CALI. For the PaleoSketch data set, CALI can only handle Arc, Circle, Ellipse and Line; and for other recognizers, because of the variable nature of the PaleoSketch complex and polyline classes we also report results with these two classes removed.
The evaluation was conducted with the evaluator implemented within DataManager (Schmieder et al., Reference Schmieder, Plimmer and Blagojevic2009). The results are shown in Table 7. On average, RATA.Gesture clearly outperforms all other algorithms. For the flowchart data set, a z test showed that RATA.Gesture is significantly more accurate than the next best algorithm (excluding RATA.SSR), Rubine (SD = 0.01, p < 0.01).
Evaluation results for recognizers ink feature data
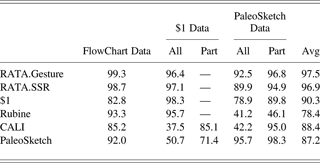
Note: All indicates all shape classes are used and Part means some are removed as described. Note CALI on PaleoSketch Part used even less classes than the others.
It is not surprising that the $1 algorithm on the $1 data set, and PaleoSketch algorithm on the PaleoSketch data outperform RATA. For the $1 data set, there is a significant difference between RATA.Gesture and the $1 algorithm (SD < 0.01, p < 0.01). There is no significant difference between RATA.Gesture and the next best algorithm (excluding RATA.SSR) on this data set, Rubine (SD < 0.01, p = 0.06). All the trainable recognizers suffer from the catchall polyline classes in the raw PaleoSketch data set, although RATA.Gesture does achieve 92.5%. Tests without these classes (PaleoSketch data: Part) show that RATA.Gesture is not significantly different to the PaleoSketch recognizer (SD < 0.01, p = 0.07). It also outperforms the other trainable recognizers.
Results of RATA.SSR on these data sets are also shown in Table 7. RATA.Gesture outperforms RATA.SSR on average and for the flowchart and PaleoSketch data sets. Although no statistically significant differences were found for the flowchart data set (SD < 0.01, p = 0.27) or the PaleoSketch data set (SD = 0.01, p = 0.07). The exception is the $1 data set where there is a weak statistical difference between them (SD < 0.01, p = 0.04).
7. DISCUSSION
In this project we use algorithms from an existing machine learning library. With careful analysis, algorithms were selected and tuned to configure an ensemble recognizer that is accurate and flexible.
The first step was to explore a wide range of trainable algorithms using a large feature set and three sets of diagram data. When exploring WEKA we found that there were many algorithms that gave good results. We could not fully explore all of them; we chose nine that performed well and represented a variety of different artificial intelligence techniques. Although this was not an exhaustive exploration of available artificial intelligence algorithms, it is more comprehensive than has been reported elsewhere.
The nine selected algorithms were then individually tuned using three data sets. WEKA offers many tuning attributes for each algorithm. Computational constraints meant we could not try combinations of attributes; instead we found the optimal value for each attribute and then combined all optimum values. Retesting the tuned algorithms showed that most had improved about 1%. Two algorithms (BN and the LAD Tree) showed statistically significant improvements; five performed better but not at a significant level. Although two (LB and SMO) displayed worse performance in some tests, for these algorithms we carried the original configuration through to the next phases.
Further tuning of the individual algorithms may be possible by tuning the combination of settings. We believe these values are related to the nature of the input data. More data sets and a lot of computational power are needed for further analysis. An area worth exploration is ways to dynamically find the best configuration for each data set. In addition it is possible that some of the algorithms we did not consider would produce similar results to the nine we used in the second stage of analysis. However, as we have representative algorithms of the major approaches and consistently high recognition rates, significant improvements are unlikely. Another interesting observation is that many of the better performing algorithms are tree based. Our feeling is that this is because they are nonparametric so cope well with real-word data and that because they are weak learners they combine well in ensembles.
We found the attribute selection algorithms in WEKA had very limited effect on the accuracy. It is likely this is because many of the algorithms are already applying attribute selection type behavior such as a tree structure or a voting mechanism. Comparatively SMO and MLP had better performance with attribute selection; they apply neither tree structures nor voting mechanisms. The improvement, however, is not statistically significant. Considering the lengthened training time, in most situations we believe the application of attribute selection is not required. However, while recognition time with the current 114 features is within real-time requirements, if more features are added, minimizing the number of features to be calculated would be sensible. Similar results were found in a study of feature selection for text-shape division in diagrams (Blagojevic, Reference Blagojevic2011), in this work no significant improvements were made with attribute selected classifiers in comparison to using the full feature set with the same algorithms.
The ensemble proved effective with a statistically significant improvement in the recognition rate compared to the best performing individual algorithm. To build the ensemble we tried voting and stacking, and we found that the voting algorithms consistently perform better. It may be because the meta-algorithm used in stacking is not effective; however, four different meta-algorithms were used and none returned better result than voting. We speculate the reason is because the algorithms to be combined are all strong algorithms, and the errors they generate are not caused by their inability in a whole area but are due to noise in the data. Thus even when assigning the best performing algorithm for a section, misclassification would still occur. Furthermore, trying to find the best algorithm may result in overfitting. In comparison, voting is more robust because it considers the probability returned by different algorithms which may filter the noise. As the algorithms we selected are all reasonably accurate, the probability based voting resulted in improved accuracy.
It is interesting that the combination of the best algorithms does not produce the best performing ensemble (combination 10 in Table 6). This shows that different algorithms have different strengths. The experiment data shows that BAG, the worst performing algorithm we used, sometimes can correctly recognize shapes that the top performing BN cannot.
Although ensembles work well for this problem, they were not so successful in a previous study for developing text-shape dividers (Blagojevic, Reference Blagojevic2011). The main difference between shape recognition and text-shape division is the nature of the classes of interest. Shape recognition commonly deals with many homogeneous classes (we have three to six classes in our training data set). In contrast, text-shape division has two classes that have a large within-class variation. Schmieder's (Reference Schmieder2009) work on evaluating basic shape recognizers showed that they generally perform better when there are fewer classes of interest. In the case of our shape recognizers, possibly the individual algorithms are not able to perform as well as ensembles due to the number of classes, in comparison to text-shape division where individual algorithms perform as well as ensembles.
Although there are still areas where further exploration is possible, we evaluated our best ensemble against four other recognizers using three data sets. Of particular note is the performance of RATA.Gesture against $1 on the $1 data set and RATA.Gesture against PaleoSketch on the PaleoSketch data set. These recognizers were designed for their respective data sets, with the characteristics of the data set in mind. RATA.Gesture performed almost as well as these recognizers on their associated data sets and outperformed them on the other data sets.
$1 is a trainable recognizer that has the potential to recognize different types of data. However its recognition approach ignores much of the rich spatial and temporal information that is available for digital ink. The data transformations performed by $1 (rotation and scaling) are a weakness of this approach that is evident in the flowchart data set results where $1 was the worst performing algorithm.
PaleoSketch has hard coded modules for each shape it can recognize. Although it is possible to provide more shape types to cover all possible shapes (Paulson & Hammond, Reference Paulson and Hammond2008), such implementation can also lead to a decrease in performance as the increase in classes provides a higher potential for mistakes to occur (Rubine, Reference Rubine1991). Furthermore, although the heuristic based approach is easy to reason and program, we contend that when the underlying relationships are more complex they may not be humanly observable.
When measuring the evaluation results we were generous to the nontrainable recognizers PaleoSketch and CALI. The advantage of trainable recognizers is evident when one considers the widely varied performance of nontrainable algorithms against the different data sets.
The success of our ensemble recognizer, developed through the use of a comprehensive feature library and a systematic analysis of data mining techniques, demonstrates the value of such an approach. We believe other digital ink recognition problems would benefit from a similar study.
RATA.Gesture's performance is due not only to the strength of its algorithms but also to the wide range of features that capture the characteristics of the classes more comprehensively than in the other recognizers. It may be hard to add these relationships into hard coded or template matching approaches; however, they can be easily encapsulated into features and used with unmodified training algorithms.
RATA.Gesture has been developed and evaluated in the context of diagram recognition, as this is our principle area of interest. RATA.Gesture as presented here is also likely to produce a very good gesture recognizer for functional gestures in the context of touch screen technology. The techniques may also be useful for the following stages of diagram recognition such as joining or splitting strokes and discerning relationships between basic shapes and components.
8. CONCLUSION
In this study we undertook an extensive evaluation of a wide range of data mining algorithms for recognizing digital ink. We examined individual algorithms, the use of attribute selection and ensemble strategies using a rich feature set. The RATA.Gesture recognizer created as a result of this exploration is an ensemble of four algorithms: BN, LB, LMT, and RF. Our comparative evaluation shows RATA.Gesture to be more flexible and accurate on average than all other algorithms tested. In addition the results presented for the algorithms we investigated and the evaluation against other recognizers provide some benchmarks against which similar algorithms can be measured.
ACKNOWLEDGMENTS
Thanks to Associate Professor Eibe Frank for expert advice on using data mining techniques. This research is partly funded by Microsoft Research Asia and Royal Society of New Zealand, Marsden Fund.
Samuel Hsiao-Heng Chang is a PhD candidate in computer science at the University of Auckland. His research interests include human–computer interaction and data mining.
Rachel Blagojevic is a Postdoctoral Research Fellow in the Department of Computer Science at the University of Auckland. Her research interests include multimodal interfaces, gesture recognition, user experience design, and applied data mining.
Beryl Plimmer researches and teaches human–computer interaction at the University of Auckland. Her particular interest is in pen and touch interaction. This work includes the cognitive effects of different representations of information (hand-drawn or formally rendered), interaction design and usability, and recognizers for digital ink and touch gestures.