


Introduction
Glaciers and ice sheets flow downhill at a speed determined by the balance between the gravitational driving force and the resistance to motion due to the ice stiffness. in the simple case of a uniform slab of ice resting on a smooth sloping bed, the driving stress increases linearly with depth due to the increasing weight of the ice above. The relationship between applied stress and the resulting strain rate is described by an empirical flow law of the form:

where  is the strain rate,
 is the applied stress and A is a constant which depends on temperature and properties of the ice such as crystal fabrics (see, e.g., Reference GlenGlen, 1955; Reference Budd and T. H.Budd andJacka, 1989). If the exponent of the (low law is 3, as found by various laboratory experiments, the rate of shear deformation increases as depth cubed, ice sheets will have small rates of shear deformation in the upper layers, and the most rapid shear will be in the ice close to the bedrock. in real glaciers, however, flow parameters vary with depth due to temperature variation and the development of anisotropic crystal fabrics. The cold, stiff upper layers smooth out variations in the surface velocity which result in complex stress variations in the lower parts of the ice sheet as the ice flows around bedrock hills. It is important to determine icc-shcet flow patterns because a knowledge of flow velocity varies with depth is needed for a variety of studies. These include model simulations of past and future ice-sheet configurations, calculations of age/depth relationships for dating ice-core environmental records, and determinations of ice outflow for ice-sheet mass-balance studies by measurement of ice-sheet surface movement.
We report here on measurements of the variation of shear rate with depth at the Dome Summit South (DSS) site on Law Dome, East Antarctica.
Data
DSS is a deep drilling site 4.7 km (~4 ice thicknesses) south-southwest of the summit of Law Dome (Morgan and others, 1997). The DSS borehole extends from the surface to a layer of silty ice at a depth of 1199.0.3 m. This ice thickness is calculated from the measured length of the core (1195.56 m) by correcting for snow accumulation and ice-column compression during the 5 year drilling period. Hereafter in this paper, depths are given in terms of an ice equivalent obtained by assuming the upper firn layers are compressed io the density of glacier ice  . For convenience in computation we use the empirical density/depth relationship of Schylt (1958):

where  is the density at depth z, psur
is the surface density and k is a constant. The values for
 and k (0.02384) are chosen for best fit to the measured DSS density profile.
The ice-equivalent depth (zice_eq ) is obtained by inlegrating the density over depth and dividing by the density of ice:

i.e.

The ice-equivalent thickness at DSS is 1176.43 m.
In January 1994 and again in February 1996 the DSS borehole was logged for inclination and direction of inclination. in 1994 the logger was attached to the electronics module of the mechanical drill, and the drill electronics were used for communication to the surface computer. in 1996, a self-contained logging module was used with improved electronics which gave better resolution of the inclination (0.03°Compared with 0.1°). The 1996 measurements were made at smaller depth intervals than in 1994, so the 1996 data were smoothed over a depth of ~2.5 m and interpolated to obtain inclinations at depths corresponding to the 1994 measurements. The difference in borehole inclination, at the same depth, between the two loggings was used to calculate the ice-sheet strain rate as a function of depth. Data were obtained as orthogonal sets giving strain in the north-south and east-west directions. For interpretation, strain rates were projected onto planes parallel and normal to the direction of the surface velocity vector. The surface velocity, measured using the global positioning system (GPS) over a 4 month period in 1995-96, is 2.04 ± 0.11 m a−1 at 225 ± 3°.
Strain rate  at depth z is given by:

where u is the horizontal velocity at depth z (see, e.g. Budd and Jacka, 1989). We calculate  from the difference in inclination of the borehole (θ2-θ1) between successive loggings, time (t2 — ti) apart,
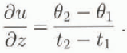
To be valid, this equation requires that the borehole inclination (Θ) is sufficiently small for θ ≈ tan θ and for the contribution to borehole-inclination change by longitudinal strain or vertical advection to be negligible. The DSS borehole inclination is everywhere <5.1°, which results in an inclination change due to longitudinal and vertical strain <2% of that due to shear.
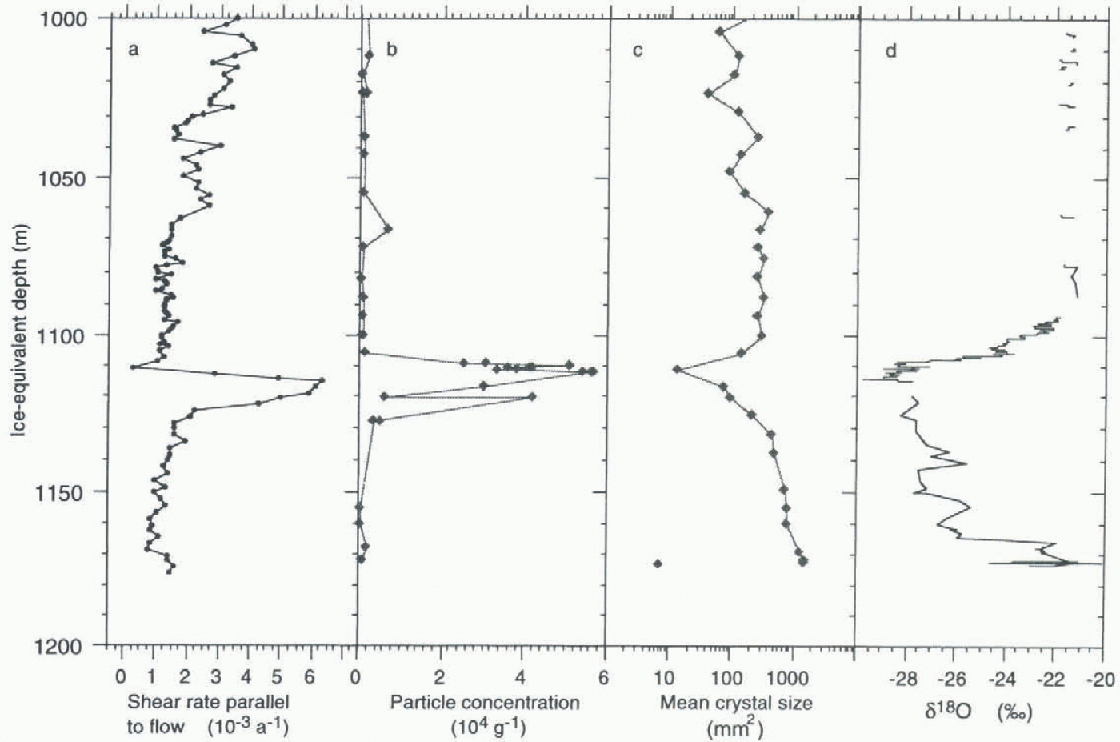
There is an uncertainty, estimated at up to 4 m in relative depth, between the borehole data (strain rates) and the ice-core data. This arises from uncertainty in the core-depth scale due to errors in the assumed length of broken cores from the brittle zone and uncertainly in the depth of the logger due to cable stretch and calibration error of the depth counter. Logging-depth error is responsible for a 2.5 m discrepancy in the depth of the shear-rate spike at 1117 m (discussed later) between the measurements in 1994 and 1996. This difference is not due to compression in the ice below, because the annual layer thickness (and hence the vertical movement in lyear) at this depth is only ~7mm. It can be seen in Figure 2 flow the depth error appears as a phase error in the data, producing a dip in shear rate on the upper side of the spike at 1110 m, and a shoulder on the lower side at 1127 m. We have avoided adjusting the depths for the computed shear rates, because the error has a negligible effect on the bulk of the record and we have no way of knowing which of the loggings is the more accurate.
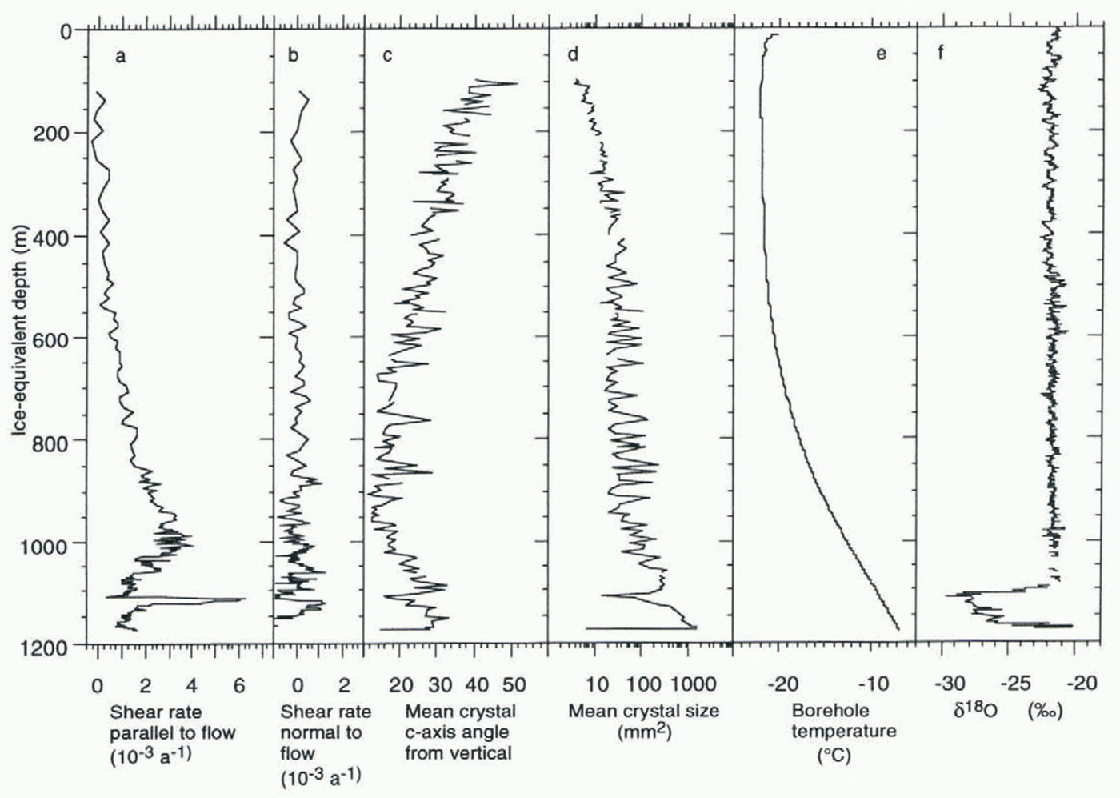
Borehole and ice-core data. Depths are ice equivalent (adjusted assuming an equivalent ice thickness for the low-density firn in the top ~100 m). (a, b) Shear rates projected on planes normal and parallel to the surface flow. (c, d) Data from crystal thin sections. About 100 crystals are measuredfor each section, (e) Measured temperature in the borehole, (f) Smoothed oxygen-isotope ratio with respect to Standard Mean. Ocean Water.
Uncertainty in the shear-rate data is difficult to estimate because of the multiplicity of inputs used in the determination. in 1994, only one measurement run was carried Out, whereas several runs were made during the 1996 season. Comparing the different 1996 runs with the single run in 1994 gives essentially the same result. The 0.13 resolution of the 1994 logger introduces appreciable rounding error in t be small inclination change We believe that the fluctuations in the upper part of the record (where the ice deformation is expected to be small) reflect the overall measurement noise, and that any systematic errors are small.
Results
Figure 1 shows the data obtained over the full ice thickness: strain rate parallel and normal to the How, crvstal-fabric strength (mean oaxis inclination from vertical), crystal size (mean crystal area in a thin section), borehole temperature, and the smoothed oxygen-isotope ratio profile from the ice core (as an indicator of local air temperature and hence climatic conditions at the time of deposition of the ice).
From the surface down to ~1000 m, strain rate increases and ice-crystal c-axis verticality shows the normal development of stronger fabrics with depth (Reference AlleyAlley, 1992). Shear rates are small at depths less than 500 m where stresses are low and advection keeps temperatures below -20°C. Below 500 m, shear rates increase as expected with increasing stress and temperature. There is a broad maximum around 1000m, below which shear rates decrease with depth. Crystal-fabric strengths also decrease below this depth, and crystal size, which remained approximately constant with the increasing shear rate and fabric strength between 300 and 900 m, starts to increase again (sec Morgan and others, 1997, Fig. 8). in DSS, Holocene ice, which at this site has exceptionally low impurity levels due to the high accumulation, extends to a depth of 1090 m. The drop in shear rate at 1000 m therefore does not appear to be associated with any know n property of the ice chemistry.
The spike of enhanced shear between 1110 and 1124 m has a maximum shear rate ~5 times that of the ice above Or below. The coincidence between the spike and the high-dust-content, small-crystal LGM ice is shown in Figure 2. The shear-rate spike and the dusty ice both occur over the same depth interval (14m), but the dusty ice appears to be offset to a slightly greater depth. We believe this is due to errors in the relative depth scales as discussed above, and that the high-dust-concentration, small-crystal ice is exactly coincident with the shear-rate spike.
In summary, the DSS results show two separate deviationss from a simple increase in shear rale with depth: the decreasing shear rate below 1000 m and the narrow spike of high shear rate at 1117 m. The former occurs in Holocene ice and is riot associated with any known variation in ice chemistry or dust content. The latter, on the other hand, corresponds, with in the accuracy of the dala, to the dusty ice deposited at the Last Glaciol Maximum (LGM).
The Shear-Rate Decrease Below 1000 m
Shear-rale profiles with a maximum some distance above the bed have been observed on Law Dome at BHF (Reference Russell-Head and BuddRussell-Head and Budd, 1979) and at BHC-1 and BHC-2 (Reference EtheridgeEtheridge, 1989). These sites lie approximately on a Bowline, in relatively thin ice near the coastal edge of the ice sheet. At BHF :ice thickness 385 m) the shear peak is about 170 m above the bed. At BHC-2 (ice thickness 350 m) the shear maximum is 120 m above the bed, and at BHC-1 (ice thickness 300 m) it is only 80 m above the bed. BHC-1, however, is located over the crest of a 50 m high bedrock hill, 350 m directly upstream of BHC-2. This means the maximum at BHC-1 is actually 80 + 50 = 130 m higher than the bedrock at BHC-2, and hence roughly in line horizontally with the BHC-2 maximum. in other words, the shear-rate maximum in all the coastal cores occurs at about the same height above the envelope of the bedrock. The new results from DSS, showing a similar profile with a maximum in shear rate 180 m above the bed, suggest that this pattern, previously only observed in the thin coastal ice, extends over a substantial part of Law Dome.
Data around the shear-rate spike. Depths of the ice-core data are internally consistent but may have up to 4 m offset with respect to the shear-rate data.
Budd and Rowdcn-Rich (1985) presented results obtained using finite-clement analysis to model flow in the coastal area of Law Dome. Their model was limited to two-dimensional flow and did not take into account the development of anisotropic crystal structure, but it did show that an upper layer of cold stiff ice (which tends to reduce horizontal velocity variations), in combination with a less viscous lower layer flowing over bedrock hills, could result in a zone of stress concentration and hence a shear-rate maximum at a height ~100 m above the top of the bedrock hills.
There is only a limited amount of shear-rate data available for other ice sheets. in the Northern Hemisphere, Dye 3 in Greenland (Dahl-Jenscn and Gundestrup, 1987) shows generally high shear rates in all the ice below the LGM (and even higher rates in the silty layer of basal ice). For Antarctica, the only published data apart from Law Dome are from Byrd Station (Reference Hansen, Kelty and GundestrupHansen and others, 1989). The Byrd data, however, only extend down to just past the LGM, because hole blockage prevented logging at greater depth.
The Shear-Rate Spike
Shear enhancement at the LGM is observed in a number of Northern Hemisphere ice-sheet records — Agassiz Ice Cap (Reference Fisher and KoernerFisher and Koerner, 1986), Barnes Ice Cap (Reference HookeHooke, 1973), Dye 3 (Reference Dahl-Jensen and N. S.Dahl-Jensen and Gundestrup, 1987) - and also at Byrd Station in Antarctica (Hansen and others, 1989). Pater-son (1991) reviewed these results in the context of “why ice-age ice is sometimes soft". He concludes that the impurities, principally chloride, are responsible for influencing the flow parameters, but indirectly by restricting crystal size. He suggests that the resulting small crystals facilitate the development of single vertical-pole fabrics favourable for shear deformation, and that positive feedback then acts to amplify the effect. Dust concentrations in DSS LGM ice are about 100 times the level in the Holocene ice, and although this is only about 1/4 of the level found in Dye 3 LGM ice, Lijun and others (1998) show that this level is sufficient to inhibit crystal growth. The examples given by Patcrson (1991) show a sharp decrease in strain rate at the end of the LGM, but do not clearly show the low strain rates in the early Glaciol ice as observed in DSS. This may be because, for the Northern Hemisphere examples, the dust content is relatively high throughout the Glaciol and only drops during the transition to the Holocene.
Ice-Sheet Velocity Profile
Integration of the shear rate over the depth of the borehole allows calculation of ice velocity as a function of height above bedrock. The results are shown in Figure 3. The velocity normal to the surface flow fluctuates around zero, and while there may be some transverse component of flow, particularly near the bedrock, we draw no conclusions since the estimated error is of the same order as the velocity magnitudes. The parallel flow velocity shows a jump at 1117m due to the shear spike, a concave down section below 1000 m due to the reduced strain rate there, and the normal decreasing strain rate with decreasing stress above 1000 m depth. The velocity at the surface is 1.98 ± 0.03 m a−1 , which is consistent with the value of 2.04 ± 0.11 ma−1 obtained by repeated GPS measurements. The DSS borehole did not reach the ice/rock interface, but penetrated ~50 mm into a layer of basal ice discoloured by fine silt and containing a few particles of rock ~1 mm in size. Measurements of shear deformation in the basal ice at Dye 3 (Dahl-Jensen and Gundestrup, 1987) show that this ice, which has very high dust concentrations, also has high shear rates, ~2 times those in the Glaciol ice immediately above. Shear rates were not measured in the bottom metre or so at DSS, but the silty ice has small crystals with strong vertical c-axis fabrics which suggest it is undergoing relatively rapid shear deformation. Since the drilling did not reach solid rock, the thickness of the silty ice is unknown, but it is thought to be a few metres. Shear deformation of a few metres of basal ice at a rate similar to that in the shear spike would not be inconsistent with the velocity measurements.
Borehole movement obtained by integrating strain rate over depth.

Mass-Balance Implications
The mass balance of an area of an ice sheet is the difference between the mass input (net accumulation plus inflow) and the ice outflow (Reference PatersonPaterson, 1994, p. 42). The ice-flow terms are usually calculated from measurements of surface velocity and ice thickness, but to do this the surface velocity must be converted to an average column velocity by multiplying by a factor (k). It can be shown (see Paterson, 1994, p. 252) that in the case of laminar shear flow, if the exponent of the flow law is 3 the value of k is 0.8. Since the calculation assumes constant temperature, no ice-crystal fabric development and no basal sliding (all of which act to increase k, values of 0.8 or larger are generally used in mass-balance calculations. The DSS borehole data allow a value of A; to be calculated by integrating velocity over depth and dividing by the depth of the borehole. Avalué of 0.74 is obtained, the smaller value resulting from the reduced flow below 1000 m.
We can examine the value of k in terms of the local mass balance. Several independent lines of evidence indicate that the Law Dome summit region is close to balance and has been for a considerable time. Evidence includes the isotope record (Morgan and others, 1997), levelling and gravity surveys (Young and others, 1989) and measurements of air trapped in ice cores (Dclmotte, 1997). If the ice sheet is in balance, the annual snow accumulation A should balance the divergence of the average column velocity V times the ice thickness Z,


where  is the longitudinal surface strain rate,
 is the transverse surface strain rate and Vs
the surface velocity. Surface strain rates were measured by change in a strain grid centred near the borehole with arms 0.2, 0.4, 0.8, 1.0 and 2.0km long aligned parallel and normal to the flow. The strain grid was set up in 1994 and remeasured in 1996. The short arms did not provide reliable data, because the movement due to strain was of the same order as the error due to pole tilt. Average strain rates determined from the 1 and 2 km arms were (3.22 ± 0.016) x 10−4 a−1 parallel to the flow and (4.50 ± 0.027) x 10−4 a−1 normal to the flow. We use an accumulation value of 0.69 m a−1 ice equivalent, as determined from ice-core annual layer thicknesses corrected for measured strain. This is slightly lower than the 0.70 quoted by Morgan and others (1997) since it does not include the high values of the last few decades. For z we use the calculated ice-equivalent thickness of 1176.43 m. A large-scale value of 2.7 x 10⁻³ for
 was estimated from radio-echo sounding data along the flowline upstream of DSS (see Morgan and others, 1997, Fig. 3). This value results in a
 term which is negligible in comparison with the accumulation or horizontal divergence terms. With these values, balance is obtained with k = 0.76, which is in close agreement with the value of 0.74 obtained by integration of shear rate over the borehole depth.
Conclusions
Deformation data from the DSS borehole show an apparently normal increase in shear strain rate down to 1000m depth, decreasing strain rate from 1000 m to the bedrock and a spike of very high shear in the dusty ice deposited at the LGM. The reduction in shear rate below 1000 m is presumed to be due to a reduction in shear stress in the lower part of the ice sheet due to flow-blocking by local bedrock hills. The existence of the shear spike is attributed to properties of the LGM ice, which has relatively high levels of dust and chemical impurities and small crystals with strong, vertically oriented, single maximum fabrics. The reduced strain rate below 1000 m results in a column/surface velocity ratio of 0.74. This value is close to the ratio of 0.76 obtained by assuming the local ice sheet is in mass balance (data from long-term surface-elevation observations) and matching accumulation, averaged over the last ~50 years, with the outflow around DSS determined by surface strain data.



