INTRODUCTION
The deglacial period, ca. 22,000–12,500 before present, was a period of rapid change in composition and structure of terrestrial environments that coincided with a major extinction of large mammals (Alroy, Reference Alroy2001; Barnosky et al., Reference Barnosky, Koch, Feranec, Wing and Shabel2004; Koch and Barnosky, Reference Koch and Barnosky2006; Fiedel, Reference Fiedel2009; Barnosky and Lindsey, Reference Barnosky and Lindsey2010; Villavicencio et al., Reference Villavicencio, Lindsey, Martin, Borrero, Moreno, Marshall and Barnosky2016). At the end of the Pleistocene, ~59 species of megafauna, accounting for 79.6% of animals weighing >44 kg went extinct in South America (Barnosky et al., Reference Barnosky, Koch, Feranec, Wing and Shabel2004; Wroe et al., Reference Wroe, Field, Fullagar and Jermiin2004). In fact, the only large herbivore in Brazil that survived this mass extinction event was the tapir (tapirus terrestris) (Steadman et al., Reference Steadman, Martin, MacPhee, Jull, McDonald, Woods, Iturralde-Vinent and Hodgins2005). The proportion of megafauna lost from the South America fauna was higher than on any other continent (Bartlett et al., Reference Bartlett, Williams, Prescott, Balmford, Green, Eriksson, Valdes, Singarayer and Manica2016), and the loss of grazers and browsers may have contributed to changes in vegetation cover (Doughty et al., Reference Doughty, Faurby and Svenning2016). Representatives of megafauna were major ecosystem engineers crucial for ecosystem functions such as seed dispersal (Janzen and Martin, Reference Janzen and Martin1982; Giombini et al., Reference Giombini, Bravo and Tosto2016; Sridhara et al., Reference Sridhara, McConkey, Prasad and Corlett2016), reduction of fuel load (Knapp et al., Reference Knapp, Blair, Briggs, Collins, Hartnett, Johnson and Towne1999), and nutrient cycling (Feeley and Terborgh, Reference Feeley and Terborgh2005; Doughty et al., Reference Doughty, Wolf and Malhi2013). The loss of these animals may have induced transformations in the landscape, including the formation of no-analog communities (Gill et al., Reference Gill, Williams, Jackson, Lininger and Robinson2009), and had repercussions that are still felt today (Owen-Smith, Reference Owen-Smith1987; Doughty et al., Reference Doughty, Wolf and Malhi2013).
The cause of the megafaunal extinction has been debated for many decades (e.g., Martin, Reference Martin1973; Barnosky et al., Reference Barnosky, Koch, Feranec, Wing and Shabel2004; Cione et al., Reference Cione, Tonni and Soibelzon2009; Feranec et al., Reference Feranec, Miller, Lothrop and Graham2011). Multiple conflicting hypotheses have been proposed ranging from widespread autoimmune diseases (Stevens, Reference Stevens1997) to a meteorite impact that triggered abrupt climatic changes such as the rapid cooling of the Young Dryas Event ca. 12,500 calibrated 14C years before present (hereafter cal yr BP) (Firestone et al., Reference Firestone, West, Kennett, Becker, Bunch, Revay and Schultz2007). The two most widely cited hypotheses are that humans induced the extinction (Martin, Reference Martin1973; Mosimann and Martin, Reference Mosimann and Martin1975; Brook and Bowman, Reference Brook and Bowman2004; Koch and Barnosky, Reference Koch and Barnosky2006) or that it was caused by climatic changes (Coltorti et al., Reference Coltorti, Ficcarelli, Jahren, Espinosa, Rook and Torre1998; Cione et al., Reference Cione, Eduardo and Soibelzon2003). Of these causes, extraterrestrial impact (Firestone et al., Reference Firestone, West, Kennett, Becker, Bunch, Revay and Schultz2007) seems the least likely (Kerr, Reference Kerr2007), and the other three need not be mutually exclusive. A modern analog to megafaunal loss is perhaps found in the decline of amphibians that results from the effects of human-induced habitat loss (Stuart et al., Reference Stuart, Chanson, Cox, Young, Rodrigues, Fischman and Waller2004), climate change, and chytridiomycosis (Kilpatrick et al., Reference Kilpatrick, Briggs and Daszak2010). Although it can be argued that all three of these agents of population decline are the product of human activity, it is the synergy of these different forces that is detrimental to a wide range of amphibian species. Such ecological synergy weighing on the megafaunal populations was suggested by Diamond (Reference Diamond1989). More recently, a multiproxy approach study carried out in Patagonian Chile also identified warm wet conditions coincident with human presence as synergistic causes for the extinction of the Pleistocene megafauna (Metcalf et al., Reference Metcalf, Turney, Barnett, Martin, Bray, Vilstrup and Orlando2016; Villavicencio et al., Reference Villavicencio, Lindsey, Martin, Borrero, Moreno, Marshall and Barnosky2016).
Although the extinction of the megafauna is well-documented globally, most studies conducted in South America have been limited to descriptions of undated fossil remains (Cartelle and Hartwig, Reference Cartelle and Hartwig1996; Dantas et al., Reference Dantas, Zucon and Ribeiro2005, Reference Dantas, de Oliveira Porpino, Bauermann, do Nascimento Prata, Cozzuol, Kinoshita, Oliveira Barbosa and Baffa2011; Hubbe et al., Reference Hubbe, Hubbe and Neves2007; Lopes et al., Reference Lopes, Buchmann, Caron and Itusarry2009; Weinstock et al., Reference Weinstock, Shapiro, Prieto, Marín, González, Gilbert and Willerslev2009; Ghilardi et al., Reference Ghilardi, Fernandes and Bichuette2011; Lima-Ribeiro et al., Reference Lima-Ribeiro, Nogués-Bravo, Terribile, Batra and Diniz-Filho2013; Villavicencio et al., Reference Villavicencio, Lindsey, Martin, Borrero, Moreno, Marshall and Barnosky2016). Despite the importance of the investigations carried out in Brazil, most studies have focused on the latest survival of taxa, rather than on the ecological aspects and geographic patterns of the extinction. Although well-dated remains are very limited, at least nine megafaunal species are thought to have survived into the early Holocene, such as Catonyx cuvieri, Smilodon populator, Megatherium americanum, and various edentates (Borrero et al., Reference Borrero, Za, Miotti and Massone1998; Long et al., Reference Long, Martin and Lagiglia1998; Neves and Pilo, Reference Neves and Pilo2003; Hubbe et al., Reference Hubbe, Hubbe and Neves2007).
Paleoecological archives are a powerful tool for understanding ecological change. Fossil pollen data can be used to evaluate whether a given community or population underwent compositional or structural changes. Glacial-age sediment records from lakes in southeastern (SE) Brazil suggest that cool and humid forest, rich in Podocarpus, Myrsine, and Araucaria dominated this area (De Oliveira, Reference De Oliveira1992; Ledru, Reference Ledru1993; Behling, Reference Behling1995, Reference Behling1997a, Reference Behling1997b, Reference Behling2002; Ledru et al., Reference Ledru, Montade, Cedex, Cedex and Pratique2015). Toward the end of the Pleistocene, warming caused glacial retreat as early as 21,000 cal yr BP in the Andes (Seltzer et al., Reference Seltzer, Rodbell, Baker, Fritz, Tapia, Rowe and Dunbar2002). In southern Brazil, however, the deglacial period was marked by the replacement of cold forest indicator species with those of warmer systems, a transition that began ca. 16,000 cal yr BP and was largely complete by 11,000 cal yr BP (De Oliveira, Reference De Oliveira1992; Ledru et al., Reference Ledru, Braga, Soubis, Fournier, Martin, Suguio and Turcq1996, Reference Ledru, Mourguiart, Ceccantini, Turcq and Sifeddine2002). The presence of cold-tolerant taxa at numerous palynological settings in SE Brazil suggested a ~5°C cooling during the late glacial period relative to modern (Barberi et al., Reference Barberi, Salgado-Labouriau and Suguio2000; Pessenda et al., Reference Pessenda, De Oliveira, Mofatto, Medeiros, Garcia, Aravena, Bendassoli, Leite, Saad and Etchebehere2009); observations consistent with temperature estimates based on noble gas concentrations (Stute et al., Reference Stute, Forster, Frischkorn, Serejo, Clark, Schlosser, Broecker and Bonani1995). Isotopic data from speleothems collected in Botuverá cave provided the first detailed reconstruction of precipitation change from SE Brazil. These data demonstrated the long-term precessional control of summer (December, January, and February) insolation over precipitation in southern Brazil (Cruz et al., Reference Cruz, Burns, Karmann, Sharp and Vuille2006, Reference Cruz, Burns, Jercinovic, Karmann, Sharp and Vuille2007; Bernal et al., Reference Bernal, Cruz, Stríkis, Wang, Deininger, Catunda, Ortega-Obregón, Cheng, Edwards and Auler2016) and suggested that the late glacial period was a relatively wet period, with the early Holocene being drier.
During the termination of the last ice age, no-analog floras were reported from North America, the Andes, and the Amazon basin (Overpeck et al., Reference Overpeck, Webb and Webb1992; Colinvaux et al., Reference Colinvaux, De Oliveira, Moreno, Miller and Bush1996; Hooghiemstra and Van der Hammen, Reference Hooghiemstra and Van der Hammen2004; Bush et al., Reference Bush, Hansen, Rodbell, Seltzer, Young, León, Abbott, Silman and Gosling2005; Cárdenas et al., Reference Cárdenas, Gosling, Sherlock, Poole, Pennington and Mothes2011; Hermanowski et al., Reference Hermanowski, da Costa and Behling2012; Velásquez-R. and Hooghiemstra, Reference Velásquez-R. and Hooghiemstra2013). These combinations of currently allopatric taxa living in sympatry during glacial stages may have reflected no-analog climates (Williams and Jackson, Reference Williams and Jackson2007), differential migration rates (Gill et al., Reference Gill, Williams, Jackson, Donnelly and Schellinger2012), or a general disequilibrium of climate and vegetation change in response to rapid warming (Harrison and Sanchez Goni, Reference Harrison and Sanchez Goni2010; Correa-Metrio et al., Reference Correa-Metrio, Bush, Hodell, Brenner, Escobar and Guilderson2012).
Sporormiella and megafauna
Ascospores of Sporormiella, a coprophilous fungus that grows and reproduces in the dung of herbivorous animals (Bell, Reference Bell1983), has been used to assess changes in megafaunal abundance through time (Davis, Reference Davis1987; Robinson et al., Reference Robinson, Pigott Burney, Burney, Louis and Biological2005; Davis and Shafer, Reference Davis and Shafer2006; Gill et al., Reference Gill, Williams, Jackson, Lininger and Robinson2009; van der Kaars et al., Reference van der Kaars, Miller, Turney, Cook, Nürnberg, Schönfeld, Kershaw and Lehman2017). In modern settings, Sporormiella has been shown to be a reliable proxy for the presence, and to some extent the abundance, of large herbivores (Raper and Bush, Reference Raper and Bush2009; Gill et al., Reference Gill, Mclauchlan, Skibbe, Goring, Zirbel and Williams2013). Comparison among lakes with different levels of usage by livestock activities demonstrated that Sporormiella was a consistent component of surface sediments at locations frequently visited by livestock (Raczka et al., Reference Raczka, Bush, Folcik and Mcmichael2016). On longer time scales (>1000 yr), Sporormiella became an important tool for detecting the past presence of large herbivores (Davis, Reference Davis1987; Davis and Shafer, Reference Davis and Shafer2006; Gill et al., Reference Gill, Williams, Jackson, Lininger and Robinson2009). Similarly, extinction events were identified through falling values of Sporormiella (Burney et al., Reference Burney, Robinson and Burney2003; Gill et al., Reference Gill, Williams, Jackson, Lininger and Robinson2009; Wood and Wilmshurst, Reference Wood and Wilmshurst2012). The extinction identified using Sporormiella data is a functional extinction, which is when the animals become so rare as to cease imposing a signal on the landscape, as opposed to a final extinction, which is the death of the last individual. In North America, the consensus was that the Sporormiella decline coincided with the onset of the Bølling-Allerød warm period at ca. 14,000 cal yr BP (Gill et al., Reference Gill, Williams, Jackson, Lininger and Robinson2009), but in the high Andes, researchers found a much earlier decline, first occurring at ca. 21,000 cal yr BP, with local extinction occurring as early as 15,800 cal yr BP (Rozas-Dávila et al., Reference Rozas-Dávila, Valencia and Bush2016). The two step decline of megafauna in the high Andes was attributed primarily to ecological changes in the environment (Rozas-Dávila et al., Reference Rozas-Dávila, Valencia and Bush2016).
The collapse of megafaunal populations was linked to the formation of no-analog plant communities (Gill et al., Reference Gill, Williams, Jackson, Lininger and Robinson2009, Reference Gill, Williams, Jackson, Donnelly and Schellinger2012). Those changes may have come about as a result of altered seed dispersal, fire regimes, or invasions (Janzen and Martin, Reference Janzen and Martin1982; Jansen et al., Reference Jansen, Hirsch, Emsens, Zamora-Gutierrez, Wikelski and Kays2012; Giombini et al., Reference Giombini, Bravo and Tosto2016).
Here we investigate the megafaunal decline through analysis of fossil Sporormiella, pollen, and microscopic particles of charcoal recovered from ancient lake sediments that spanned the time of megafaunal extinction and human arrival in SE Brazil. We seek to answer three questions: (1) Did climate change cause the megafaunal extinction? (2) Was the decline of Sporormiella spores coincident with the formation of no-modern-analog assemblages in the pollen spectra? (3) Did the decline in Sporormiella abundance occur before the arrival of humans to the Lagoa Santa region?
STUDY AREA
The Lagoa Santa region is a karstic landscape located in the south of Minas Gerais State, SE Brazil. The climate of the region is primarily controlled by the southern subtropical jet stream and polar air masses (Nimer, Reference Nimer1989). During winter, the dominance of the South Atlantic anticyclone and the absence of the Atlantic polar frontal system result in reduced regional cloud cover and monthly average temperatures ranging from 13°C to 15°C. In summer, regional temperatures rise and cloud cover increases because of the more southerly position of the Intertropical Convergence Zone and deep convection over Amazonia (Marengo, Reference Marengo1995). Summer average temperatures reach 27–28°C. Precipitation is strongly seasonal with ~88% of the 1500 mm annual precipitation falling between November and March (Lucas and Abreu, Reference Lucas and Abreu2004).
Prior to European colonization in the sixteenth century, the vegetation was dominated by a mosaic of semideciduous forest and cerrado (Warming and Ferri, Reference Warming and Ferri1973). The most abundant woody species were Acacia polyphylla (Fabaceae), Astronium fraxinifolium (Anacardiaceae), Cassia ferruginea (Fabaceae), Cedrela fissilis (Meliaceae), Chorisia speciosa (Malvaceae), Hymenaea stilbocarpa (Fabaceae), Protium heptaphyllum (Burseraceae), Tapirira guianensis (Anacardiaceae), Vochysia tucanorum (Vochysiaceae), and, more locally, Caryocar brasiliensis (Caryocaraceae), Qualea grandiflora (Vochysiaceae), and Kielmeyera coriacea (Clusiaceae).
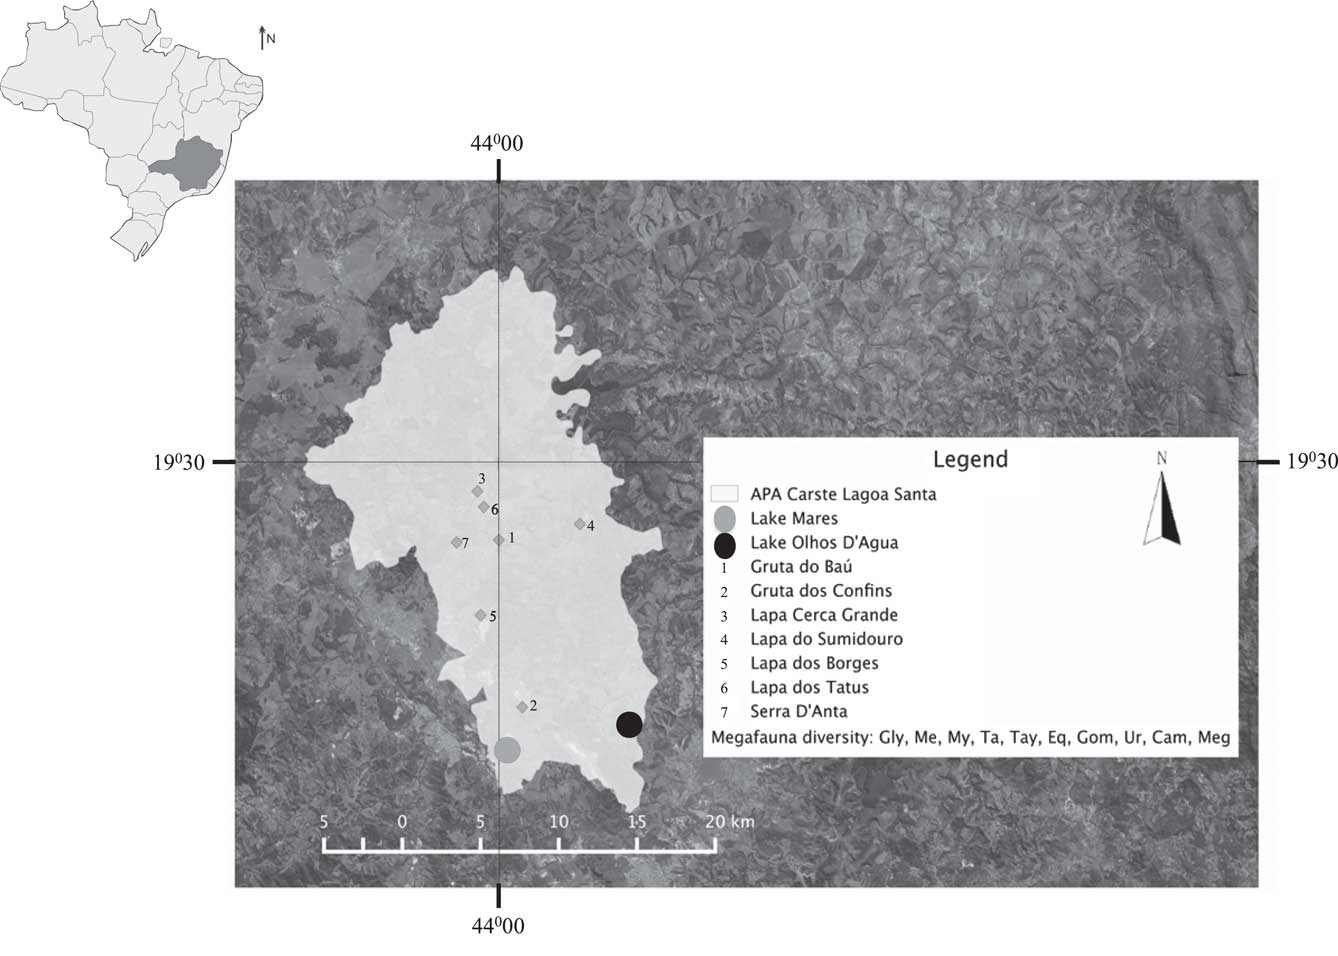
The karst landscape of the Lagoa Santa region has been a target of paleontological and archaeological studies for more than 150 yr, starting with the Danish naturalist Peter W. Lund (Lund, Reference Lund1844; Cartelle, Reference Cartelle1994). This region is rich in caves and sink holes, where bones have been collected, and it continues to be one of the most important locations for paleontological and archaeological studies in South America (Berbert-Born, Reference Berbert-Born2002). The oldest records of human occupation in Brazil (16,000–12,700 yr ago) come from caves within the region (Neves et al., Reference Neves, Powell, Prous, Ozolins and Blum1999; Neves and Hubbe, Reference Neves and Hubbe2005; Feathers et al., Reference Feathers, Kipnis, Piló, Arroyo-Kalin and Coblentz2010). The Lagoa Santa region is also distinguished by the vast diversity of paleontological sites with co-occurring megafaunal and human remains (Hubbe et al., Reference Hubbe, Hubbe and Neves2013). Despite an immense diversity of megafaunal fossils in such a small area, the majority of data are descriptive (Cartelle and Hartwig, Reference Cartelle and Hartwig1996; Lessa et al., Reference Lessa, Cartelle, Faria and Gonçalves1998; Dantas et al., Reference Dantas, Zucon and Ribeiro2005; Cartelle et al., Reference Cartelle, De Iuliis and Pujos2008; Marinho Silva et al., Reference Marinho Silva, Cordeiro Filgueiras, Franca Barreto and Oliveira2010). Few quantitative studies assess the landscape (Ghilardi et al., Reference Ghilardi, Fernandes and Bichuette2011; Pires et al., Reference Pires, Galetti, Donatti, Pizo, Dirzo and Guimarães2014) or climatic conditions within which these animals lived. Some examples of megafauna recovered from the caves of Lagoa Santa include: Glyptodontidae, Megalonichidae, Mylodontidae, Tapiridae, Tayassuidae, Equidae, Gomphortheriidae, Ursidae, Camelidae, and Megatheridae (Fig. 1) (Dutra et al., Reference Dutra, Horta and Berbert-Born1998). A causal linkage of human and megafaunal co-occurrence beyond taphonomic coincidence or that caves were favored by both entities, has yet to be made.
Map of the study area in Minas Gerais state showing the locations of Lake Mares and Lake Olhos d’Agua, as well as the major paleontological sites inside the Lagoa Santa protected area. The diversity of the megafauna found at the sites consists of the following: Glyptodontidae (Gly), Megalonichidae (Me), Mylodontidae (My), Tapiridae (Ta), Tayassuidae (Tay), Equidae (Eq), Gomphortheriidae (Gom), Ursidae (Ur), Camelidae (Cam), Megatheridae (Meg) (Dutra et al., Reference Dutra, Horta and Berbert-Born1998).

The lakes on which this study is based, Lake Mares (19°39′46.54″S, 43°59′17.67″W) and Lake Olhos d’Agua (19°38′53.24″S, 43°54′35.24″W), are both shallow, 2.6 m and 3.5 m at the deepest point, respectively. The modern lakes are similar in size, both occupying ~2 km2, and are thought to be oligotrophic (De Oliveira, Reference De Oliveira1992).
MATERIAL AND METHODS
Sediment cores were recovered using a Colinvaux–Vohnout coring rig operated from a floating platform (Colinvaux et al., Reference Colinvaux, De Oliveira and Moreno1999). The Lake Olhos d’Agua core was collected in 2005 and the one from Lake Mares in 2008. The lithologies of the cores were described, and sediments subsampled for palynological analysis.
Fossil pollen was prepared following standard procedures as described by Faegri and Iversen (Reference Faegri and Iversen1989). An exotic marker, Lycopodium clavatum, was added to calculate pollen concentration (Stockmarr, Reference Stockmarr1971). A total of 300 pollen grains were counted per sample. Microscopic particles of charcoal and Sporormiella were counted alongside pollen. Every microscopic particle of charcoal >25 µm was tallied. Smaller pieces were not included to minimize the impact of particles that might have broken during chemical preparation. The age of each core was established with 14C (accelerator mass spectrometry) dating performed by Beta Analytic Inc., and the chronology was established using the package Bchron (Parnell, Reference Parnell2016) with statistical program R (R Core Team, Reference R2015). Pollen diagrams were made using Tilia/TiliaGraph version 2.0.41. The detrended correspondence analysis (DCA) was calculated using every taxon found with an abundance greater than 1% of the total pollen sum. The DCA was performed with the R package vegan (Oksanen et al., Reference Oksanen, Kindt, Legendre, O’Hara, Simpson, Solymos, Stevens and Wagner2007), and the species evenness calculation was completed using every taxon found, including rare taxa, with the software PAST version 3.11 (Hammer et al., Reference Hammer, Harper and Ryan2001).
RESULTS
Chronologies and lithology
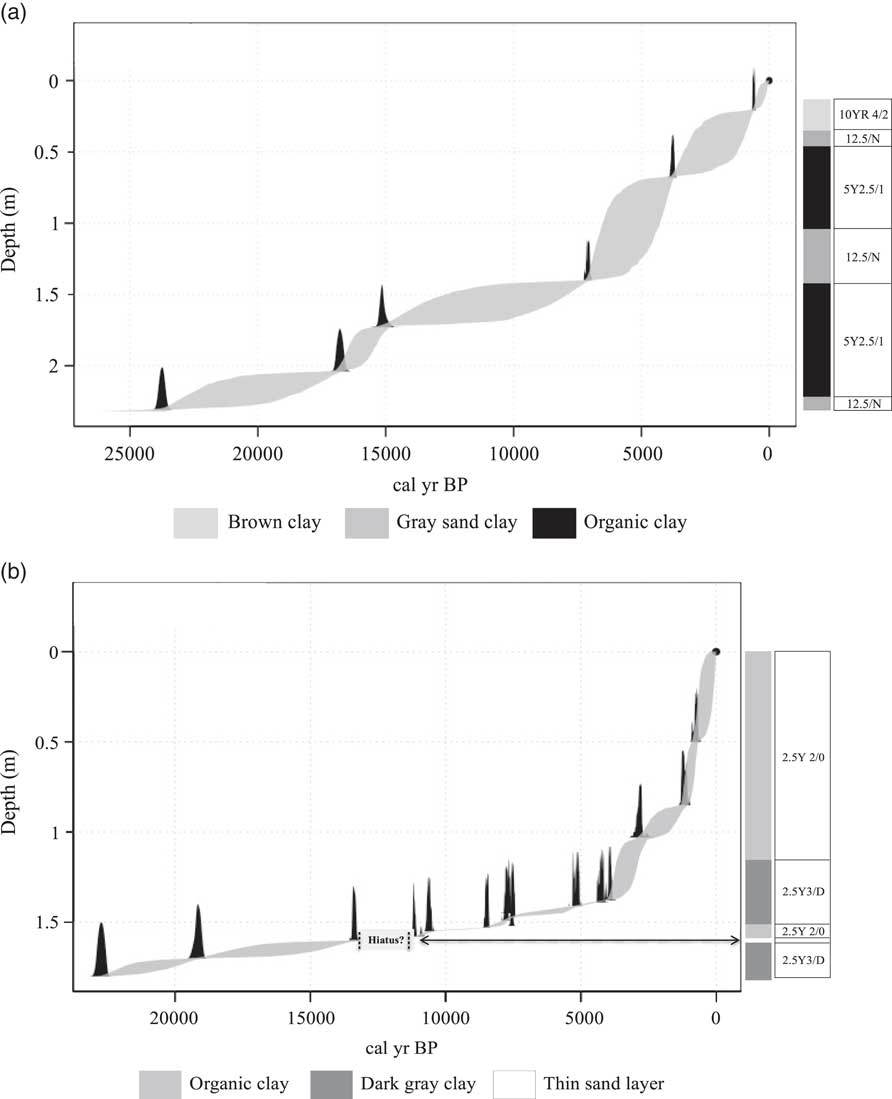
The radiocarbon chronology of Lake Mares and Lake Olhos d’Agua provide inferred rates of accumulation. We found no evidence to suggest a sedimentary hiatus at Lake Mares (Fig. 2); however, a possible hiatus was observed at Lake Olhos d’Agua centered on ca. 14,500 cal yr BP (between 1.61 and 1.59 m core depth).
Age model from Lake Mares (a) and Lake Olhos d’Agua (b). The chronology was generated using Bchron (Parnell, Reference Parnell2016), and it was based on the probability density function for all calibrated radiocarbon ages. The stratigraphic descriptions of the sediments include Munsell color values.
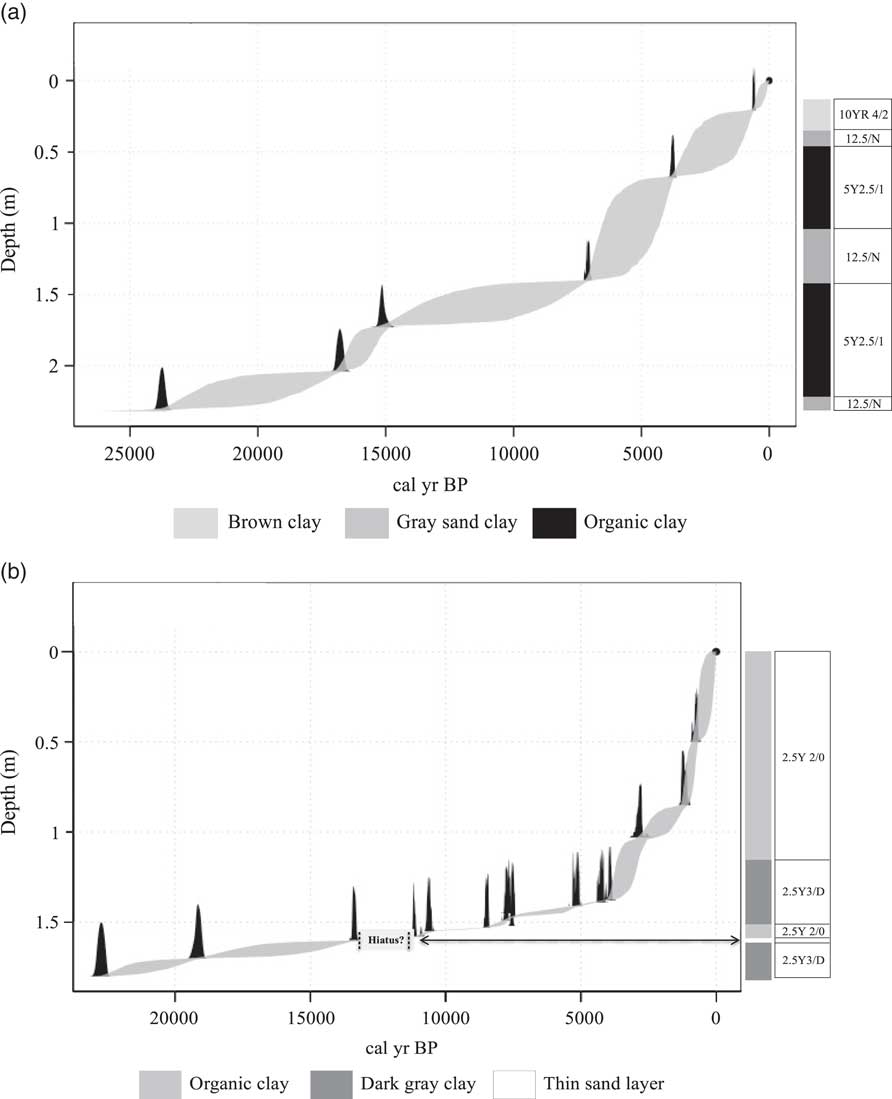
At Lake Mares, the sediment was characterized by the presence of sandy gray clay (Munsell color 12.5/N) in the basal portion of the core, below 2.22 m. Overlaying these sediments was a black organic clay (5Y 2.5/1) between 2.22 m and 1.4 m. From 1.40 m to 1.0 m depth, the sediments were a sandy gray clay (12.5/N) overlain by a layer of black organic clay from 1.0 cm to 0.4 m (5Y 2.5/1). Between 0.4 m to about 0.28 m core depth, a layer of sandy gray clay (12.5/N) was evident. The uppermost 0.28 m of sediment was a brown organic clay (10YR 4/2), which probably reflected the unconsolidated sediment of the modern lake bottom.
The oldest sediment of Lake Olhos d’Agua was a dark-gray clay containing some quartz particles from 1.8 to 1.61 m. Overlying this deposit was a thin layer of fine sand between 1.61 and 1.59 m depth. A layer of black organic clay (2.5Y 2/0) was present between 1.59 and 1.5 m. Overlying this layer was a dark-gray clay (2.5Y 3/D) from 1.5 to 1.16 m. A black organic clay (2.5Y 2/0) formed the remainder of the core.
Pollen records
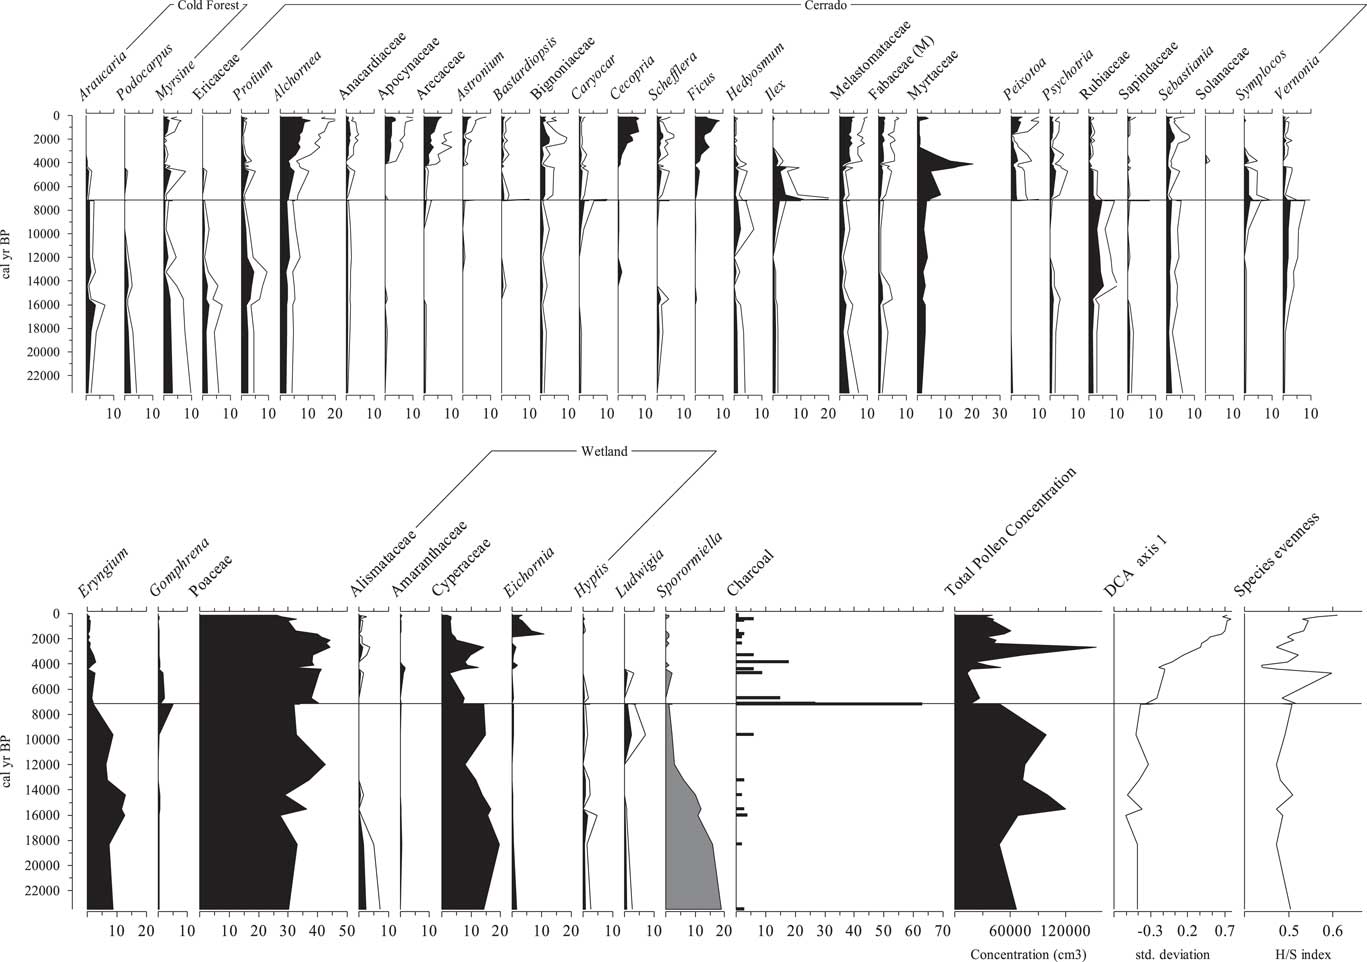
Lake Mares 2.22 m to 1.4 m (23,500–7200 cal yr BP)
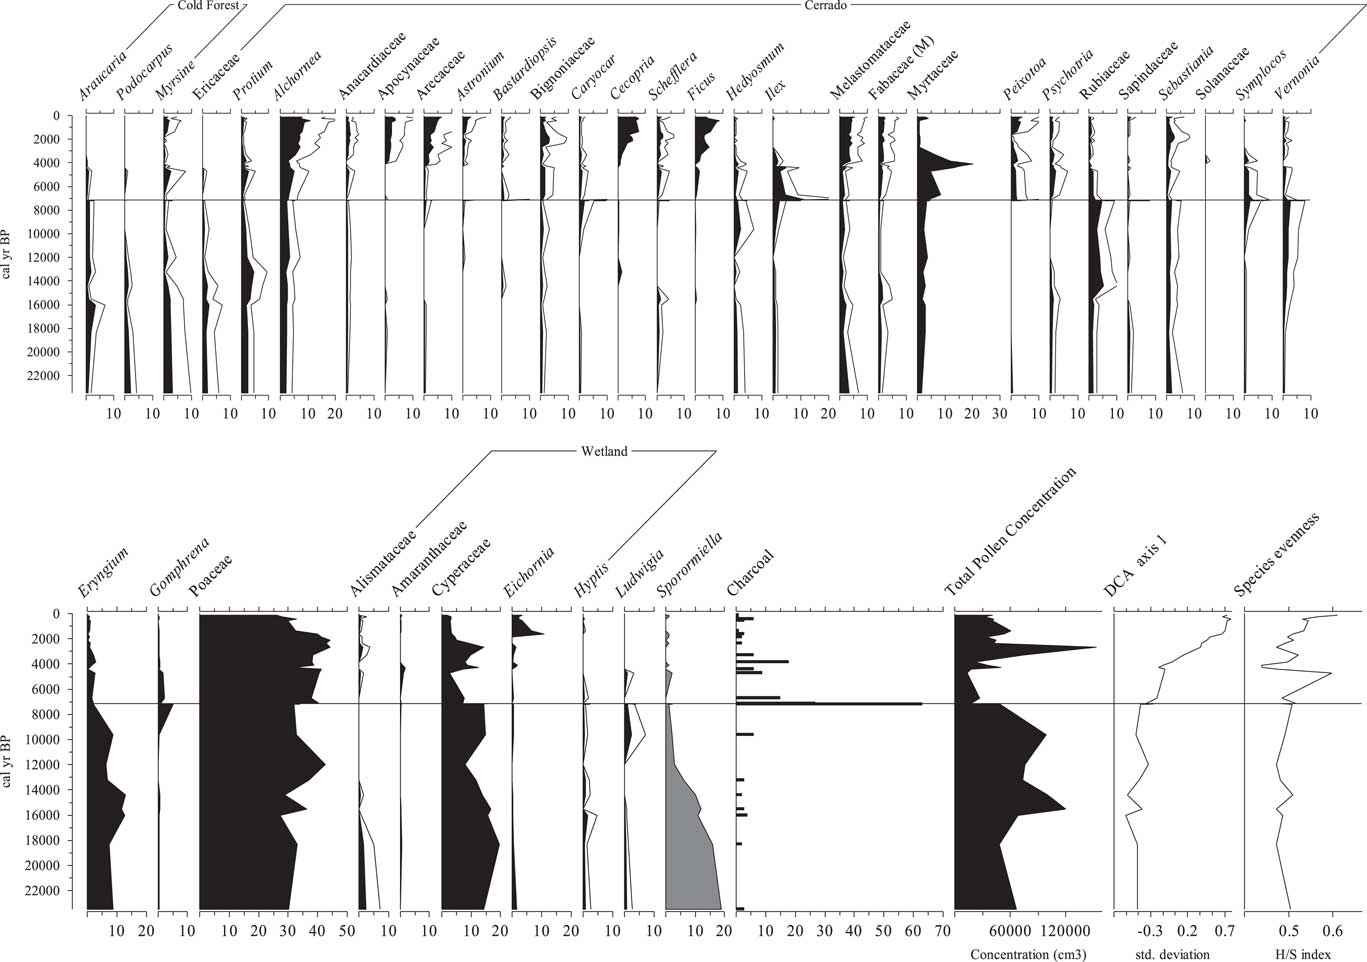
A diversity of arboreal pollen types was found, including the cold-tolerant taxa Araucaria and Podocarpus (2%–5%). Cerrado forest taxa were represented in this interval by Myrsine, Ericaceae, Protium, Alchornea, Anacardiaceae, Apocynaceae, Arecaceae, Bignoniaceae, Caryocar, Schefflera (ex Didymopanax), Hedyosmum, Ilex, Melastomataceae, Fabaceae (M), Myrtaceae, Psychotria, Rubiaceae, Sapindaceae, Sebastiania, Symplocos, and Vernonia. The majority of the arboreal pollen types were individually 1%–4% of the pollen sum between 23,500 and 8000 cal yr BP. Among the herbs, Asteraceae (8%–20%), Eryngium (6%–13%), Cyperaceae (~16%), and Poaceae (27%–42%) were the most abundant pollen types in most samples. Some terrestrial herbs were represented in low percentages (~1%) (e.g., Gomphrena). Aquatic taxa (e.g., Alismataceae, Eichornia, Hyptis, and Ludwigia) were present, generally with percentages below 3%. Sporormiella values in this interval were between 6% and 19%, and microscopic particles of charcoal were rare (Fig. 3).
Pollen diagram of the percentage data for the most abundant pollen taxa recovered from the sediments of Lake Mares. A 5× exaggeration is shown for values <5%. Gray silhouettes indicate the cold-tolerant taxa. Total pollen concentration is expressed in grains per cubic centimeter. Detrended correspondence analysis (DCA) axis 1 sample scores plotted against time in units of standard deviation of species turnover. Microscopic particles of charcoal are expressed as percentages of the total pollen sum. H/S index, Shannon index of diversity.
Lake Mares 1.4 m to 0.05 m (ca. 7200 cal yr BP to modern)
During this interval, cold-tolerant taxa, which were previously present in the fossil record, disappear. The most representative taxa from the cerrado forest group were Alchornea (5%–11%), Apocynaceae and Arecaceae (5%–7%), Cecropia and Ficus (2%–13%), and Melastomataceae (~5%). Other arboreal taxa were represented in lesser abundance by Myrsine, Protium, Anacardiaceae, Astronium, Bastardiopsis, Bignoniaceae, Caryocar, Schefflera, Hedyosmum, Ilex, Fabaceae (M), Myrtaceae, Peixotoa, Psychotria, Rubiaceae, Sapindaceae, Sebastiania, Symplocos, and Vernonia. Poaceae was the most abundant pollen type with values between 30% and 40%. Asteraceae, which started this zone with percentages of ~19%, progressively dropped to 14%. Cyperaceae, taken to represent wetland species, fluctuated between 6% and 17%. No other aquatic type exceeded 2%. Sporormiella values were between 0% and 3% from the beginning of this interval onward. Microscopic particles of charcoal peaked at ca. 7500 cal yr BP (Fig. 3).
Lake Olhos d’Agua 1.8 m to 1.5 m (23,000–8000 cal yr BP)
The basal sediments of Lake Olhos d’Agua were relatively rich in cold-tolerant arboreal taxa, such as Podocarpus (2%–5%) and Araucaria (0%–5%). The most representative cerrado forest taxa were Myrsine, Caryocar, and Myrtaceae with values greater than 4%. Other arboreal elements with low abundance or that appear later in this interval were Lithraea, Fabaceae (M), Alchornea, Melastomataceae, Apiaceae, and Arecaceae. Poaceae (as high as 57%) and Asteraceae dominated the herb pollen spectra in this interval. A sample at ca. 17,800 cal yr BP had a spike of Cyperaceae (58%). Sporormiella spores were abundant, with values ~15.6% and concentrations up to 4200 spores per cm3 dropping to 0 at ca. 11,500 cal yr BP. Microscopic particles of charcoal, ranging from 25 to 50 μm in size, reached a maximum of ~2000 particles per cm3 ca. 10,500 cal yr BP (Fig. 4).
Pollen diagram of the percentage data for the most abundant pollen taxa recovered from the sediments of Lake Olhos d’Agua. A 5× exaggeration is shown for values <5%. Gray silhouettes indicate the cold-tolerant taxa. Total pollen concentration is expressed in grains per cubic centimeter. Detrended correspondence analysis (DCA) axis 1 sample scores plotted against time in units of standard deviations of species turnover. Microscopic particles of charcoal are expressed as percentages of the total pollen sum. The gray band represents the possible hiatus in this sediment record.

Lake Olhos d’Agua 1.5 m to 0 (8000 cal yr BP to modern)
Cold-tolerant taxa dropped to values below 2% during this interval. The most abundant cerrado forest taxa were Caryocar, Fabaceae (M), Melastomataceae, Urticaceae/Moraceae, Myrtaceae, and Ilex. Poaceae maintained high abundance, with a slight oscillation between 44% and 51% of the pollen sum. Asteraceae, on the other hand, fluctuated throughout this interval from 5% to 24%. Aquatic taxa were represented only by Alismataceae, which started this interval with values ~3%, dropped to zero, and then increased to ~20% toward modern. Sporormiella was recorded in a few samples, but always with values below 2%. Microscopic particles of charcoal became more frequent after 8000 cal yr BP (Fig. 4).
DCA axis 1 versus axis 2
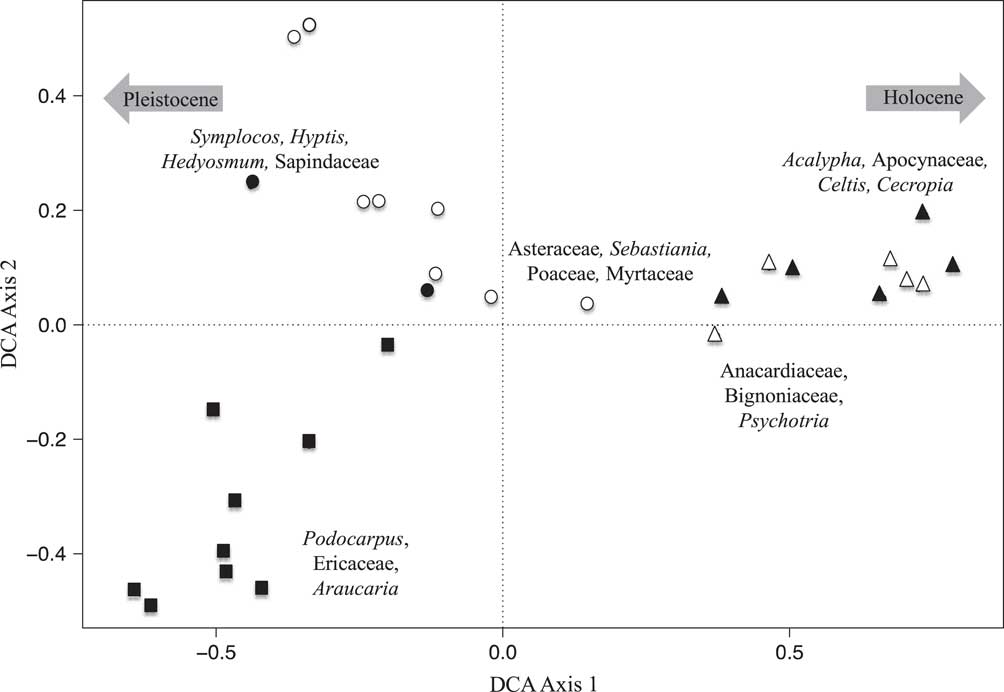
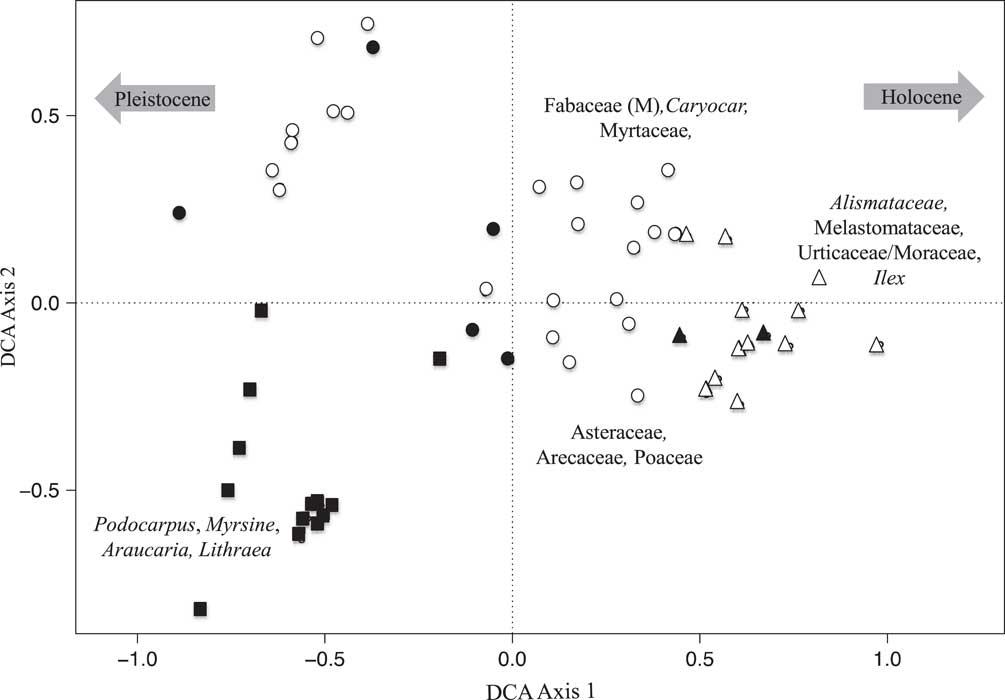
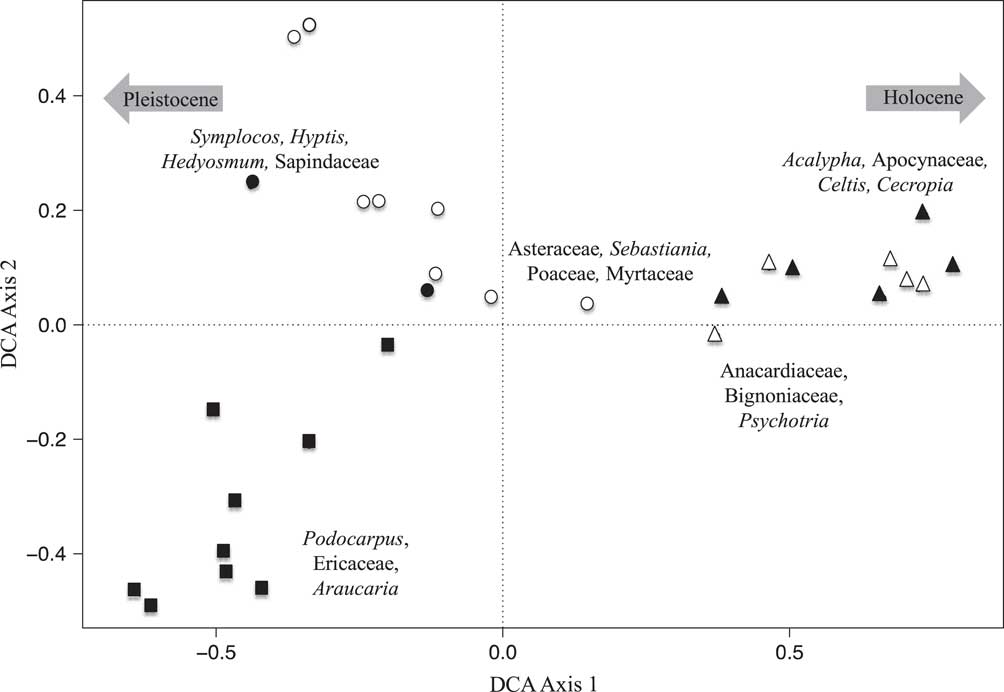
DCA was performed on the percentile fossil pollen data from both lakes. At Lake Mares, DCA axis 1 (eigenvalue 0.215, axis length 1.43) separated the samples from the bottom of the record (Pleistocene), characterized mainly by Podocarpus, Araucaria, and Ericaceae on the negative extreme of the axis, from samples from the top of the sediment column (Holocene), characterized by Acalypha, Apocynaceae, Celtis, and Cecropia on the positive extreme of the first axis. Axis 2 (eigenvalue 0.09, axis length 1.05) separated the samples in the middle of the sediment record (early Holocene to mid-Holocene), represented by Asteraceae, Sebastiania, Poaceae, and Myrtaceae, from those of the Pleistocene.
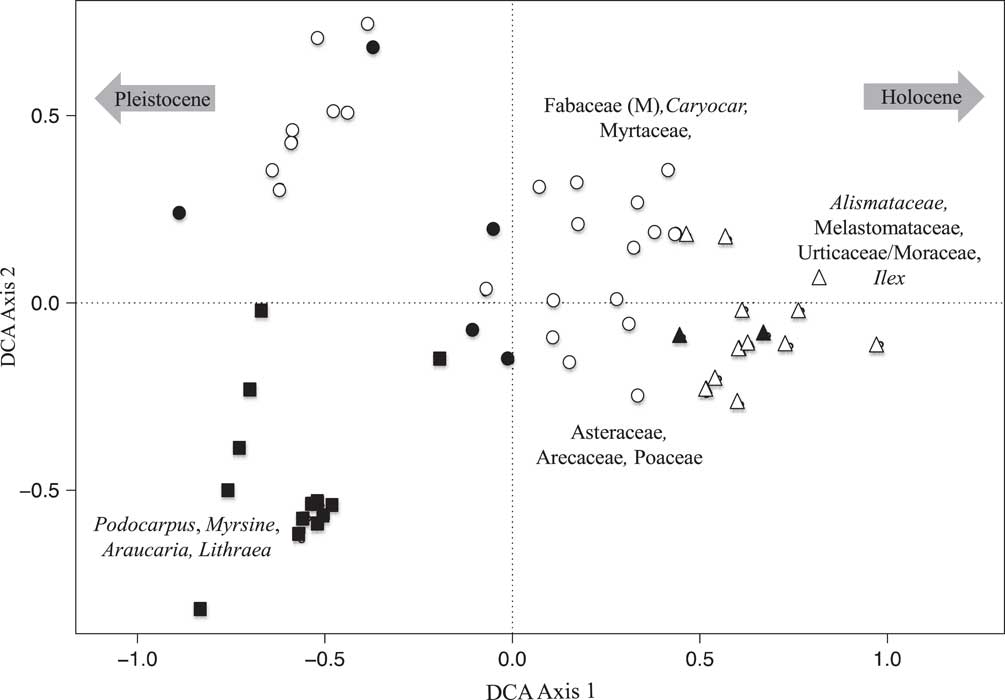
At Lake Olhos d’Agua, the DCA analysis showed a very similar pattern to that of Lake Mares. Samples scores on axis 1 (eigenvalue 0.238, axis length 1.81) placed the samples from the bottom of the sediment record (Pleistocene) on the negative side of axis 1, with the late Holocene samples at the positive extreme. Just as with Lake Mares, axis 2 (eigenvalue 0.13, axis length 1.56) separated early Holocene and mid-Holocene samples from Pleistocene-aged ones (Figs. 5 and 6).
Detrended correspondence analysis (DCA) results of the fossil pollen data of Lake Mares. Closed symbols represent samples with Sporormiella presence, and open symbols represent samples in which Sporormiella was not recorded. Squares represent samples with Pleistocene ages, circles represent samples with early to mid-Holocene ages, and triangles represent samples with late Holocene ages. Species characterizing the extremes of axes are shown.
Detrended correspondence analysis (DCA) results of the fossil pollen data of Lake Olhos d’Agua. Closed symbols represent samples with Sporormiella presence, and open symbols represent samples in which Sporormiella was not recorded. Squares represent samples with Pleistocene ages, circles represent samples with early to mid-Holocene ages, and triangles represent samples with late Holocene ages. Species characterizing the extremes of axes are shown.
DISCUSSION
Fossil pollen and Sporormiella were well preserved in both of the Lagoa Santa records. The multivariate analysis of the pollen records provided similar results in both lakes (Figs. 3 and 4). The late Holocene samples were seen to differ most strongly from those of the Pleistocene and early Holocene–aged samples. A clear separation of samples was evident based on age and, to a lesser extent, whether samples contained Sporormiella spores. DCA axis 1 for both lakes appeared to reflect a gradient of decreasing temperature, separating taxa related to cold climates (Pleistocene) from those of warmer settings (Holocene), whereas axis 2 represented decreasing precipitation (Figs. 5 and 6).
Vegetation change from the last glacial maximum to modern
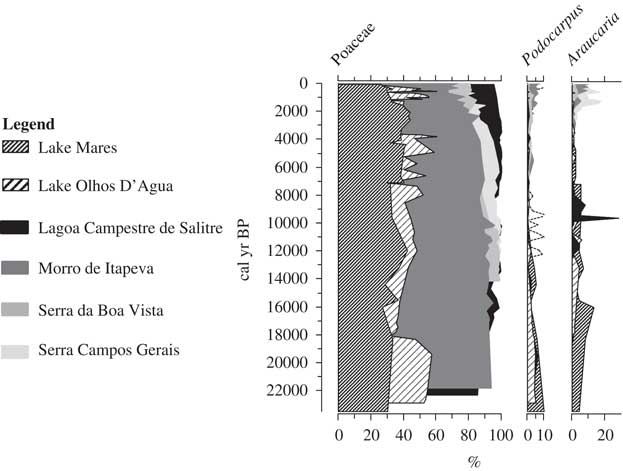
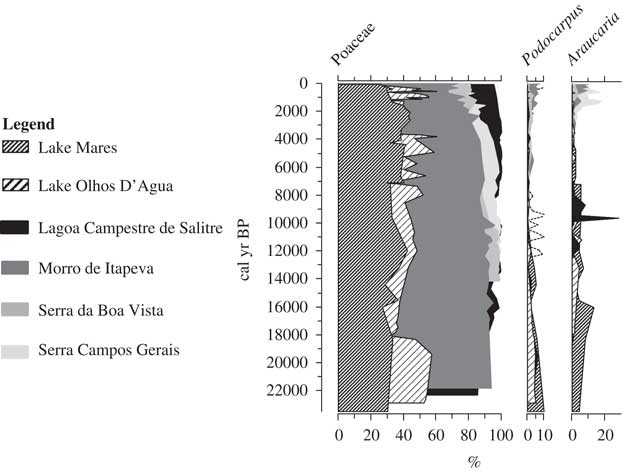
Both lakes revealed a similar presence of cold-tolerant taxa in the deglacial period. Araucaria and Podocarpus are regular components of the late-glacial pollen records at both Lakes Mares and Olhos d’Agua. Pollen grains of these genera are not found in the modern Lagoa Santa region and are restricted to high elevations or higher latitudes in Brazil (Fig. 7) (Behling, Reference Behling1995, Reference Behling1997a, Reference Behling1997b). These taxa are cold-tolerant and their presence suggests a cooling relative to modern of about 5°C. These findings are consistent with data for the downslope or northward expansion of these cold-tolerant taxa in other cerrado settings (Ledru, Reference Ledru1993; Salgado-Labouriau et al., Reference Salgado-Labouriau, Casseti, Ferraz-Vicentini, Martin, Soubiès, Suguio and Turcq1997; Barberi et al., Reference Barberi, Salgado-Labouriau and Suguio2000). High percentage values of pollen of grasses and herbaceous taxa also suggested the presence of a mosaic of forest and savanna under a relatively cool climate.
Trends in vegetation cover for sites where pollen records indicate the modern occurrence of Podocarpus and Araucaria. Note the modern occurrence at higher elevation or higher latitude than the Lagoa Santa sites. The pollen data sets from Lagoa Campestre de Salitre (elevation: 1050 m; mean annual temperature: ~25°C; 19°S, 46°46′W), Morro de Itapeva (elevation: 1850 m; mean annual temperature: 13.6°C; 22°47′S, 45°32′W), Serra da Boa Vista (elevation: 1160 m; mean annual temperature: ~15°C; 27°42′S, 49°09′W), and Serra Campos Gerais (elevation: 1200 m; mean annual temperature: ~16.7°C; 24°40′S, 50°13′W) were downloaded from the Neotoma Paleoecology Database (http://www.neotomadb.org/ [last accessed July 25, 2017]).
Forest elements such as Araucaria, Myrsine, and Podocarpus, and an abundance of Cyperaceae between 23,000 and 12,000 cal yr BP indicated a moister and cooler climate than present. A rapid increase in sedges (Cyperaceae) ca. 17,800 cal yr BP at Lake Olhos d’Agua could represent a falling lake level and a marsh closer to the coring site between ca. 17,800 and 15,600 cal yr BP (Whitney et al., Reference Whitney, Mayle, Punyasena, Fitzpatrick, Burn, Guillen, Chavez, Mann, Pennington and Metcalfe2011), or it could represent a larger backswamp in response to higher lake level. Given that this period coincides with increased precipitation in the Botuverá Cave record, it is likely that the Cyperaceae reflect a marsh expansion because of wetter conditions. It is notable that this event was not represented in the Lake Mares record.
Poaceae and Asteraceae were the most abundant pollen types between 23,000 and 14,000 cal yr BP in both sediment records. Although these elements could have represented savanna grasslands, they were also abundant components of lake, river, and swamp vegetation (Ledru et al., Reference Ledru, Montade, Cedex, Cedex and Pratique2015) and semiopen forests where grasses dominated (Wanderley et al., Reference Wanderley, Shepherd and Giulieti2001; Behling, Reference Behling2002). The persistence of trees coupled with elements indicative of moisture in the Lagoa Santa region indicated conditions moist enough to support woodland, but a declining representation of aquatic indicators suggested a gradual drying of the climate between 19,000 and 11,000 cal yr BP. Floristically, the early Holocene, from ca. 11,700 until 9000 cal yr BP, was very similar to the Pleistocene, with evidence of a mixture of modern cerrado elements (e.g., Alchornea, Caryocar, Ericaceae, and various Anacardiaceae) growing alongside species characteristic of cool mesic forests (e.g., Araucaria, Podocarpus, and Myrsine). Araucaria was almost lost from the Lake Mares record between 16,000 and 14,000 cal yr BP, coincident with a dry oscillation evident in the isotopic record from Botuverá Cave. Araucaria returned to the record as conditions became wetter after ca. 14,000 cal yr BP, and persisted well into the Holocene, only disappearing ca. 8000 cal yr BP. At Lake Olhos d’Agua, Poaceae started to decline at 19,000 cal yr BP and Araucaria was first documented at 18,000 cal yr BP (Fig. 5).
The Holocene portion of both records includes a period of intermittent drought between 8000 and 5000 calyrBP (Raczka et al., Reference Raczka, De Oliveira, Bush and McMichael2013). Cerrado vegetation dominated throughout this period and was maintained as conditions became more consistent and approximated those of modern times post–4000 cal yr BP.
Did climate change cause the megafaunal extinction?
The precipitation and temperature change of the Lagoa Santa region was forced by different external factors. Regional precipitation was driven by changes in north and subtropical Atlantic Ocean circulation (McManus et al., Reference McManus, Francois, Gherardi, Keigwin and Brown-Leger2004), whereas the cold events structuring vegetation were strongly influenced by incursions of Antarctic air (Garreaud, Reference Garreaud2000).
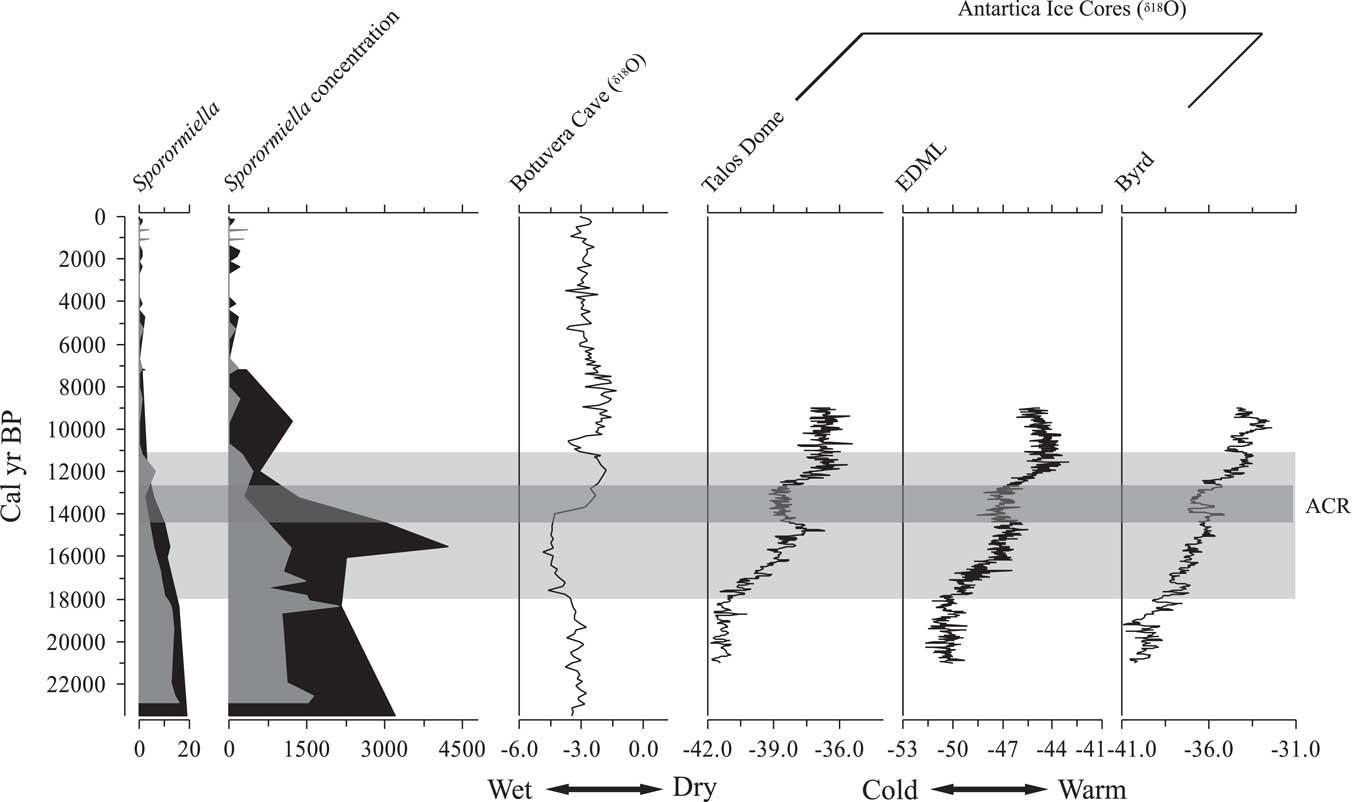
At Lake Olhos d’Agua, Sporormiella appears to have begun its decline in abundance by ca. 18,000 cal yr BP. Sporormiella fell below the 2% threshold, used by some authors to suggest the extinction of the megafauna (Davis and Shafer, Reference Davis and Shafer2006) at 11,160 cal yr BP. At Lake Mares, the initial decline of Sporormiella also started 18,000 calyrBP; however, Sporormiella fell below 2% of the pollen sum at 12,000 cal yr BP.
The 2% threshold identifying functional megafaunal extinction was derived for ecosystems of the western United States and applied to paleoecological settings as they transitioned from cold grassland to cool temperate/boreal forest (Robinson et al., Reference Robinson, Pigott Burney, Burney, Louis and Biological2005; Gill et al., Reference Gill, Williams, Jackson, Lininger and Robinson2009). Unusually among sites where megafaunal extinction has been studied, the Lagoa Santa records lacked any indication of a transition between biomes. Most other records feature a transition from grassland to forest at the time of the megafaunal loss, but at Lagoa Santa it was a remarkably constant occurrence of cool cerrado woodland throughout the deglacial period and early Holocene. Thus, the probability that a major change in pollen production associated with habitat change could complicate the interpretation of the Sporormiella record seems more likely in the temperate rather than tropical settings.
If concentration is used to identify the functional extinction rather than percentage, the Sporormiella levels of the mid-Holocene provide a period when the megafauna are known to be absent and pastoralism has yet to boost herds. Thus, Sporormiella values seen between ca. 9000 and 7000 cal yr BP probably represent a good baseline for a post megafaunal state (Figs. 3 and 4). If those criteria are applied, the extinction would have taken place at ca. 11,600 cal yr BP at Lake Olhos d’Agua, and at ca. 12,000 cal yr BP at Lake Mares. As can be seen, it made little difference whether the 2% threshold of Davis and Shafer (Reference Davis and Shafer2006) or concentration (spores per cubic centimeter) (Fig. 8) was used to estimate the timing of population collapse. Based on these data, the most constrained dates for the decline in megafaunal population showed that it was initiated by ca. 18,000 cal yr BP, and the functional extinction, or background level associated with the mid-Holocene, was reached between 12,000 and 11,100 cal yr BP (Fig. 8).
Comparison between Sporormiella data (percentage and concentration) from Lake Mares (black silhouette) and Lake Olhos d’Agua (gray silhouette), with Botuvera cave stalagmite ratios of oxygen isotopes and with ice cores from Antarctica (Pedro et al., Reference Pedro, Van Ommen, Rasmussen, Morgan, Chappellaz, Moy, Masson-Delmotte and Delmotte2011). Light-gray horizontal bar indicates the interval of Sporormiella decline. Dark-gray horizontal bar indicates the Atlantic cold reversal (ACR) episode. EDML, East Antarctic Dronning Maud Land.
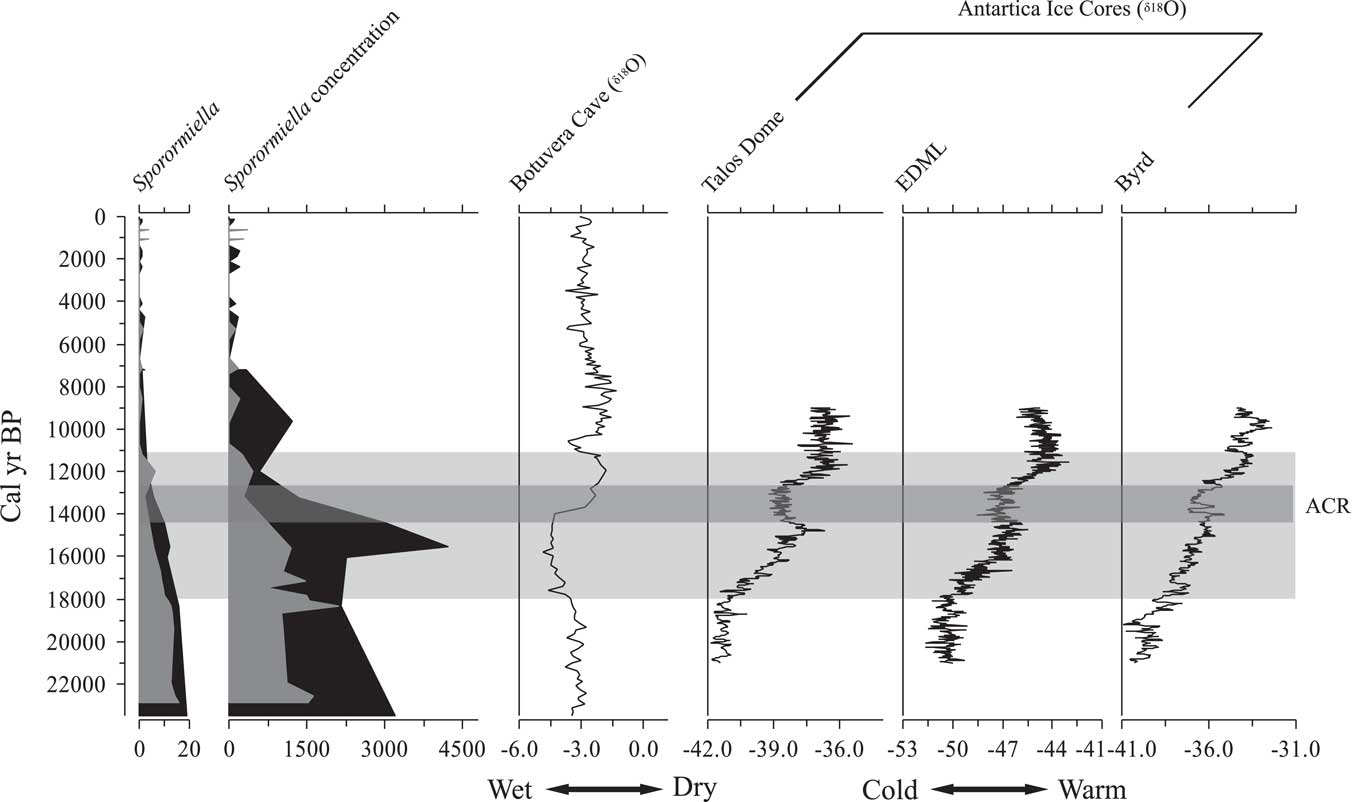
These dates were later than the Sporormiella decline recorded at Lake Pacucha, Peru, where the herbivore population decline started at ca. 21,000 cal yr BP and the functional extinction was reached at 15,800 cal yr BP (Rozas-Dávila et al., Reference Rozas-Dávila, Valencia and Bush2016). The Lagoa Santa data were also later than those of Appleman Lake, Indiana, where the decline started as early as 16,000 cal yr BP, with extinction inferred at ca. 13,700 cal yr BP (Gill et al., Reference Gill, Williams, Jackson, Lininger and Robinson2009).
The terminal Pleistocene at Lagoa Santa was cooler than modern, and the precipitation probably varied quite markedly. The decline in megafaunal populations coincided with the onset of wetter conditions between 18,000 and 14,000 cal yr BP (Fig. 8). Cooler and moister conditions associated with the Atlantic cold reversal between 14,000 and 12,300 cal yr BP (Cruz et al., Reference Cruz, Burns, Karmann, Sharp and Vuille2006; Pedro et al., Reference Pedro, Bostock, Bitz, He, Vandergoes, Steig and Chase2015) (Fig. 8) did not reverse this trend. If populations had survived prior interglacial periods, there must have been equivalent downturns followed by recoveries. In this instance, although the climate should have favored a recovery (i.e., it was moving back toward more glacial conditions), there is no evidence of any increase. Given that this period falls within the window of potential human occupation, we tentatively infer that humans were applying sufficient population pressure by 14,000 yr ago to prevent megafaunal recovery. The warming trend that followed the Atlantic cold reversal is the effective start of the Holocene in many South American climate records (Moreno et al., Reference Moreno, Jacobson, Lowell and Denton2001; Haberzettl et al., Reference Haberzettl, Corbella, Fey, Janssen, Lücke, Mayr, Ohlendorf, Schäbitz, Schleser and Wille2007; Urrego et al., Reference Urrego, Bush and Silman2010; Valencia et al., Reference Valencia, Urrego, Silman and Bush2010). As observed in Patagonia (Metcalf et al., Reference Metcalf, Turney, Barnett, Martin, Bray, Vilstrup and Orlando2016), the functional extinction of megafauna in the Lagoa Santa region coincided with this warm event.
Was the decline of Sporormiella spores coincident with the formation of no-modern-analog assemblages in the pollen spectra?
These data suggested that, at least in this setting, the no-modern-analog assemblages were strongest during cool, wet climates when megafauna were present but persisted in warmer, drier climates after the loss of megafauna. In North America and the Andes, the functional extinction of the megafauna coincided with the establishment of no-analog floras. These communities were formed by the coexistence of cold-tolerant and cold-sensitive arboreal species, which are not currently sympatric. At Lake Mares and Lake Olhos d’Agua, Podocarpus and Araucaria were cold-tolerant taxa whose ranges were extended during the last glacial period. The association of Caryocar, a bat-pollinated tree (Gribel and Hay, Reference Gribel and Hay1993) typically found in cerrado ecosystems, with the cold-tolerant taxa, suggested that a landscape configuration with no modern analog existed near Lake Mares and Lake Olhos d’Agua. Unlike the no-analog floras seen in the Andes and North America, where ice-age grasslands gave way to deglacial woodlands, Lakes Olhos d’Agua and Lake Mares supported woodland vegetation throughout the terminal ice age. In the Lagoa Santa settings, the Lake Mares record showed Araucaria and Podocarpus to be part of the system 23,000 cal yr BP, and there were trace amounts of Caryocar (Fig. 4).
Large herbivores were probably important ecosystem engineers in such parkland settings, impeding woody regeneration and maintaining open areas (Augustine and McNaughton, Reference Augustine and McNaughton1998; Ripple and Van Valkenburgh, Reference Ripple and Van Valkenburgh2010; Bakker et al., Reference Bakker, Gill, Johnson, Vera, Sandom, Asner and Svenning2016). The consequences of the extinction of large herbivores from the landscape and the role that large herbivores might have played on the vegetation remain a puzzle (Doughty et al., Reference Doughty, Faurby and Svenning2016). The extinction that took place at the end of the Pleistocene (Young et al., Reference Young, McCauley, Galetti and Dirzo2016) affected species composition and probably vegetation structure, but the effects of the megafauna extinction may have been more heterogeneous than the previously thought. Although some plant species probably benefited from reduced grazing and trampling (Rozas-Dávila et al., Reference Rozas-Dávila, Valencia and Bush2016), others might have suffered negative effects from increased competition or reduced seed dispersal. With the loss of dispersers, more clumped distributions of large-seeded species might be expected (Janzen and Martin, Reference Janzen and Martin1982). Alternatively, dispersal may have been maintained by humans and small rodents (Guimarães et al., Reference Guimarães, Galetti and Jordano2008; Iob and Vieira, Reference Iob and Vieira2008).
Large mammals are not only seed dispersers, but are voracious predators of seedlings and can profoundly influence recruitment (Wyatt and Silman, Reference Wyatt and Silman2004). In both our study lakes, the increase of some taxa such as Arecaceae, Lithraea, Melastomataceae, Ficus, and Caryocar were coincident with the final decline of Sporormiella, which could reflect the lack of herbivory in the system.
Notably, the cold-tolerant taxa, such as Araucaria and Podocarpus, survived later into the Holocene than there is evidence of megafauna. The late survival of these cool-mesic forest taxa is not unique to these sites and has been observed at other SE Brazilian locations (De Oliveira, Reference De Oliveira1992). Lake shorelines may have served as microrefugia for these populations that lingered for a few thousand years before the warmer and drier conditions of the mid-Holocene extinguished them from this region.
Did the decline in Sporormiella abundance occur before the arrival of humans to the Lagoa Santa region?
The earliest known occupation of South America by humans is documented at Monte Verde, southern Chile, with a suggested age of 18,500–14,500 cal yr BP (Dillehay et al., Reference Dillehay, Ramírez, Pino, Collins, Rossen and Pino-Navarro2008, Reference Dillehay, Ocampo, Saavedra, Sawakuchi, Vega, Pino and Collins2015). If these were foundational human populations, the process of colonization might have continued through coastal exploration (Dillehay, Reference Dillehay1999) with an unknown rate of spread into the interior. In the Lagoa Santa region, the arrival of humans is contentious as the material that is dated via optically stimulated luminescence provides a range of credible ages ranging from 16,000 to 12,700 cal yr BP (Neves et al., Reference Neves, Powell, Prous, Ozolins and Blum1999, Reference Neves, Prous, González-José, Kipnis and Powell2003; Feathers et al., Reference Feathers, Kipnis, Piló, Arroyo-Kalin and Coblentz2010), whereas the oldest 14C age is ca. 11,500 cal yr BP.
In other ecological records, fire is an abrupt and obvious signature of human presence, especially in systems that do not burn naturally. It has also been suggested that the loss of megafauna resulted in decreased grazing, which led to increased fuel loads and elevated fire frequency (e.g., Gill et al. Reference Gill, Williams, Jackson, Lininger and Robinson2009). No such abrupt change in fire frequency is evident in the Lagoa Santa records. Microscopic particles of charcoal are present as a rare component in almost all samples from Lake Mares with the most notable increase in charcoal frequency occurring at ca. 7200 cal yr BP (Fig. 4). At Lake Olhos d’Agua, charcoal was absent from the oldest samples, but occurred in all samples after ca. 15,600 cal yr BP (Fig. 5) with a mid-Holocene peak in representation. In the Pleistocene portion of both records, the fire signal was present, but relatively weak, and did not coincide with a major change in vegetation type. The cerrado ecosystem is a naturally dry setting, and fire is a long-term (prehuman arrival) component of the landscape. As species were somewhat fire adapted, the arrival of humans, even if it did increase fire frequency somewhat, would have had less of an ecological effect than in a system that did not burn naturally (Cochrane, Reference Cochrane2009). We found no compelling evidence in this system that the loss of megafauna increased fire frequency. Similarly, the growing human presence from ca. 12,000 yr onward may have had ecological impacts that fell within the range of natural disturbance regimes and did not produce a strong signal in the pollen records.
Although a few megafaunal kill sites have been recognized in South America (Bryan et al., Reference Bryan, Casamiquela, Cruxent, Gruhn and Ochsenius1978; Politis et al., Reference Politis, Prado and Beukens1995), data are still too scarce to indicate robustly that humans were a significant factor in megafaunal population declines (Prado et al., Reference Prado, Martinez-Maza and Alberdi2015). Although it is abundantly clear that humans and megafauna coexisted in South America for thousands of years (Neves and Pilo, Reference Neves and Pilo2003; Fariña and Castilla, Reference Fariña and Castilla2007; Hubbe et al., Reference Hubbe, Hubbe and Neves2007, Reference Hubbe, Hubbe and Neves2009), we conclude that the initial decline in megafaunal populations was not related to human activity. The final decline at the end of the Pleistocene, however, overlapped with human occupation in the Lagoa Santa region. Our data from the Lagoa Santa region are consistent with the emerging view that megafauna were susceptible to wet intervals, and that population recovery took place from natural lows, but when humans arrived, the synergy of hunting, climate change, and human-altered ecology induced extinction (Cooper et al., Reference Cooper, Turney, Hughen, Barry, McDonald and Bradshaw2015; Metcalf et al., Reference Metcalf, Turney, Barnett, Martin, Bray, Vilstrup and Orlando2016; Rozas-Dávila et al., Reference Rozas-Dávila, Valencia and Bush2016).
CONCLUSION
The paleoecological data gathered from Lake Mares and Lake Olhos d’Agua used fossil Sporormiella abundance to infer changes in megafaunal presence and abundance. Megafaunal populations began to decline ca. 18,000 cal yr BP, with a functional extinction occurring between 12,000 and 11,100 calyrBP. The age interval of our suggested functional extinction overlapped with the oldest human evidence for the Lagoa Santa region, ca. 16,000–12,700 cal yr BP (Feathers et al., Reference Feathers, Kipnis, Piló, Arroyo-Kalin and Coblentz2010). The initial population collapse took place amid a warm, wet interval, and the functional extinction took place in a warming during a relatively dry episode. The unusually stable ecosystems of the Lagoa Santa region held no-analog floras throughout the decline of the megafaunal populations and even for several millennia after their extinction. The data from Lagoa Santa region were not consistent with parallel studies from North America and the Andes that found the functional extinction of the megafauna to be simultaneous with a marked increase in the abundance of microscopic particles of charcoal and the establishment of novel floras. We suggest a synergistic effect between climate change and humans as the most parsimonious explanation of the failure of megafaunal populations to recover after a climate-induced collapse prior to the Antarctic cold reversal, which was expressed locally as a dry interval. Perhaps the most valuable lessons learned from this study are that the collapse of megafaunal populations did not induce the same results across different ecosystems.
ACKNOWLEDGMENTS
This research was funded by the National Science Foundation (award DEB 1260983) and by grants from FAPESP (Research Foundation of the São Paulo State) through project 04/01321-6, entitled “Human Origins and Its Microevolution in the Americas: A Paleoanthropological View.”