Introduction
Muskmelon (Cucumis melo L. 2n = 2x = 24) is a warm season crop commercially cultivated in arid and semi-arid regions of the world, where rainfall is a major limitation (Cabello et al., Reference Cabello, Castellanos, Romojaro, Martinez-Madrid and Ribas2009; Dhillon et al., Reference Dhillon, Monforte, Pitrat, Pandey, Singh, Reitsma, Garcia-Mas, Sharma and McCreight2012; Ibrahim, Reference Ibrahim2012). Worldwide total production of melon was 29.39 million tons with an annual value of 3345 million USD. In term of production and annual turn over, China ranks 1st with 14.33 million tonnes (t) and 84.73 million USD, while India ranks 5th with 1 million tons production with an annual turn over of 0.70 million USD, respectively (FAOSTAT, 2013). Muskmelon cultivars were developed under good agronomic practices in India and other parts of the world (Pandey et al., Reference Pandey, Rai, Prasanna and Kalloo2008). The performance of these cultivar under drought stress has not been analysed. However, its productivity decreased from 25–30 to 12–15 t/ha in India and yield reduction in China and Egypt was 50 and 23% (Srinivas et al., Reference Srinivas, Hegde and Havanagi1989; Feng and Wu, Reference Feng and Wu2007; Ibrahim, Reference Ibrahim2012). Although, there are reports on development of drought-tolerant varieties of other crops (Fleury et al., Reference Fleury, Jerreries, Kuchel and Langridge2010), still only limited information is available on muskmelon varieties (Cabello et al., Reference Cabello, Castellanos, Romojaro, Martinez-Madrid and Ribas2009).
The effect of drought stress on plants depends upon the species, genotypes, growth stage, level and time of drought, and other soil physical parameters (Gomez et al., Reference Gomez, Oliva, Mielke, de Almeida, Leita and Aquino2008). Generally, screening for abiotic stress tolerance in field level was based on morphological scores (Zhang et al., Reference Zhang, Gong, Guo, Ren and Xu2011). Although screening based on visual observations on scaling is lacking to measure the yield efficiency of genotype under drought stress condition. Efforts to evaluate the level of tolerance with a single parameter has limited importance because of the complexity of the factors and their interactive contribution to drought tolerance under field conditions. Leaf water content is an useful indicator of plant homeostasis, since it expresses the relative amount of water present in the plant tissues (Boyer, Reference Boyer1968). Photosynthetic efficiency (F v /F m ) and chlorophyll concentration index (CCI) are the powerful non-destructive techniques for detecting plant stresses in the field, provides information on photosynthesis-related parameters, the key factors that determine plant yield (Singh and Dubey, Reference Singh and Dubey1995).
The present experiment was conducted to standardize a field screening procedure along with yield and other important parameters with modification in earlier techniques to identify performance of muskmelon genotypes under drought stress. The study provides useful information for drought stress screening and also to identify drought-tolerant and yield-efficient muskmelon genotype for future drought stress breeding.
Materials and methods
Materials and experimental condition
A total 48 genotypes of muskmelon maintained at ICAR–Indian Institute of Vegetable Research (IIVR), Varanasi, Uttar Pradesh (UP), were selected. The materiasls were evaluated during summer season at the experimental farm of ICAR–IIVR in two sets. The experimental plot soil was sandy loam, with pH 6.8, EC 0.29 dS/m, bulk density 1.34 g/cm3. The soil organic carbon, total nitrogen, available phosphorus and potassium content were 0.39, 0.30% and 0.51 and 0.35 mg/g, respectively. Each genotype was planted in 6 m long and 1 m wide bed in each replication in separate set of experiments. The seeds were sown at 0.6 m distance in randomized block design with three replication, in two plots separated at 5 m distance. Out of ten plants five plants were selected for observations.
Drought stress treatment
Both set of experiment were kept under regular irrigation upto 30 d, at an interval of 5 d to maximum saturation [(soil water content (SWC), 42%)]. After 30 d, irrigation in one set was withdrawn and the other set continued as per requirement and observations were recorded. The experimental set, which was exposed to drought stress was re-irrigated twice at an interval of 5 d after 1 month of exposure to stress. to recover the plants growth (61–70 d from date of germination). For second stress exposure irrigation stopped for 15 d (71–85 d from the date of germination), in first set of experiment and again irrigated once.
The moisture content of drought stress and irrigated plots were 5.1 and 41.2%, respectively at 25 cm depth recorded on days 30 of drought stress, while it was 12.8 and 41.8%, respectively on days 15 of second drought stress exposure. The SWC was measured according to the method of Coombs et al. (Reference Coombs, Hall, Long and Scurlock1987).
Observations
Visual observations based on 5 point scale
The response of the plants were evaluated based on method earlier described by Tocker et al. (Reference Tocker, Canci and Yildrin2007) with modification in scale and plant growth symptoms. The evaluation method was modified with respect to the number of exposures to drought and growth symptoms. The data on 5 point scale was recorded visually at the end of first and second exposure of drought stress and after irrigation to see the recovery.
The proposed 5 point scale (1–5) for muskmelon screening was, scale – 1 (highly drought tolerant: no visible drought effect on plant and full recovery after two successive wilting), scale – 2 (drought tolerant: leaves and branches dried out, intermediate recovery after two successive wilting), scale – 3 (average drought tolerant: leaves and branches dried out, partial recovery after two successive wilting), scale – 4 (drought susceptible: leaves and branches dried out, partial recovery after single wilting and died), scale – 5 (highly drought susceptible: leaves and branches dried out at 1st stress exposure, no recovery at all).
Yield data of both the set of experiments were recorded and DTE% calculated according to the method of Fischer and wood (Reference Fischer and Wood1981). DTE = Total yield of genotype under drought condition/total yield of genotype under well-watered condition, DTE% = DTE × 100.
Physiological parameters
Relative water content (RWC), electrolyte leakage (EL), F v /F m , CCI, root and shoot length were measured in both sets after 30 d of drought stress along with well-watered plants.
RWC and electrolyte leakage
RWC and EL of leaf tissues were measured according to the method of Khare et al. (Reference Khare, Goyary, Singh, Shah, Rathore, Anandhan, Sharma, Arif and Ahmed2010). Harvested leaves were weighed [fresh weight (FW)]. The tissues were rehydrated in water for 6 h until fully turgid, surface dried and reweighed [turgid weight (TW)] followed by oven drying at 80°C for 24 h, and reweighed [dry weight (DW)]. The RWC was calculated by the following equation: RWC% = (FW–DW/TW–DW) × 100. The EL measured by using a conductivity meter (CM-180, Elico, India). Ten leaf discs were placed in 25 ml distilled water and left at room temperature for 4 h then conductivity measured (EC1). Thereafter EC2 was measured after autoclaving at 121°C for 30 min. EL was calculated using the following formula: EL% = (EC1/EC2) × 100.
Fv/Fm and CCI
F v /F m was determined using a portable Handy Plant Efficiency Analyzer (Hansatech Instruments, King's Lynn, Norfolk, UK). The leaves were darkly adapted for 30 min using leaf clips at adaxial side. The red light were used to irridates the leaf surface, the fluorescence signal generated was collected at excitation irradiance, set at 3000 µM/m2/s1 from the same surface. Minimum (F 0) and maximum (F m ) chlorophyll fluorescence of dark adapted leaf were recorded and maximum quantum efficiency of photosystem II calculated according to the formula F v /F m = F m –F 0/F m (Maxwell and Johnson, Reference Maxwell and Johnson2000).
CCI of the leaf was recorded using CCM-200 Portable Chlorophyll Meter (Opti-Sciences, Tyngsboro, MA) at the ratio of 655/940 nm. Five plants were randomly selected and their 1st, 2nd and 3rd fully expanded leaf from the top of the main stems were used for measurement during 10.00–11.00 am (Bahadur et al., Reference Bahadur, Singh, Rai, Verma and Rai2009).
Root and shoot length
Three plants taken out from the soil and their root and shoot length were measured in cm.
Weather condition
Experiment was conducted during mid February to mid-May. The maximum temperature was 44.1 and 44.4°C, while minimum was 14.7 and 14.5°C, respectively, during first and second years of experiment. The average relative humidity during the experiment in both years was 72.4 and 70.3%, respectively.
Statistical analysis
All the statistical analyses were performed using the statistical package SPSS (SPSS Inc., Version 16.0) based on the 2 years mean data of three replicates. The pearson correlation coefficient was used to assess the association between DTE and physiological parameters.
Results
Categorization of genotypes in different groups based on scale
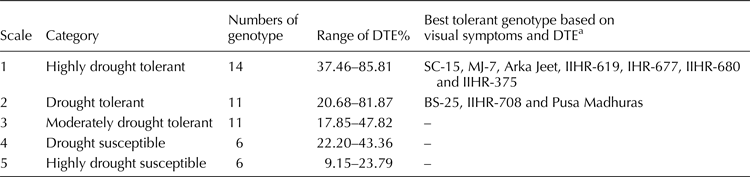
Fourty-eight muskmelon genotypes were categorises in different group based on 5 point scale (Table 1). Among 48 genotypes 14 genotypes were categorized in scale 1, 11 genotypes each on scales 2 and 3, while six genotypes each on scales 4 and 5. Genotypes grouped on scale 1 was considered drought tolerance while genotypes came under scale 5 was considerd as highly susceptible.
Genotypes categorized according to 5 point scale, field performance, number of genotypes, range of DTE% and best-selected genotypes based on visual symptoms and DTE%

a Genotype with DTE higher than 62% were selected.
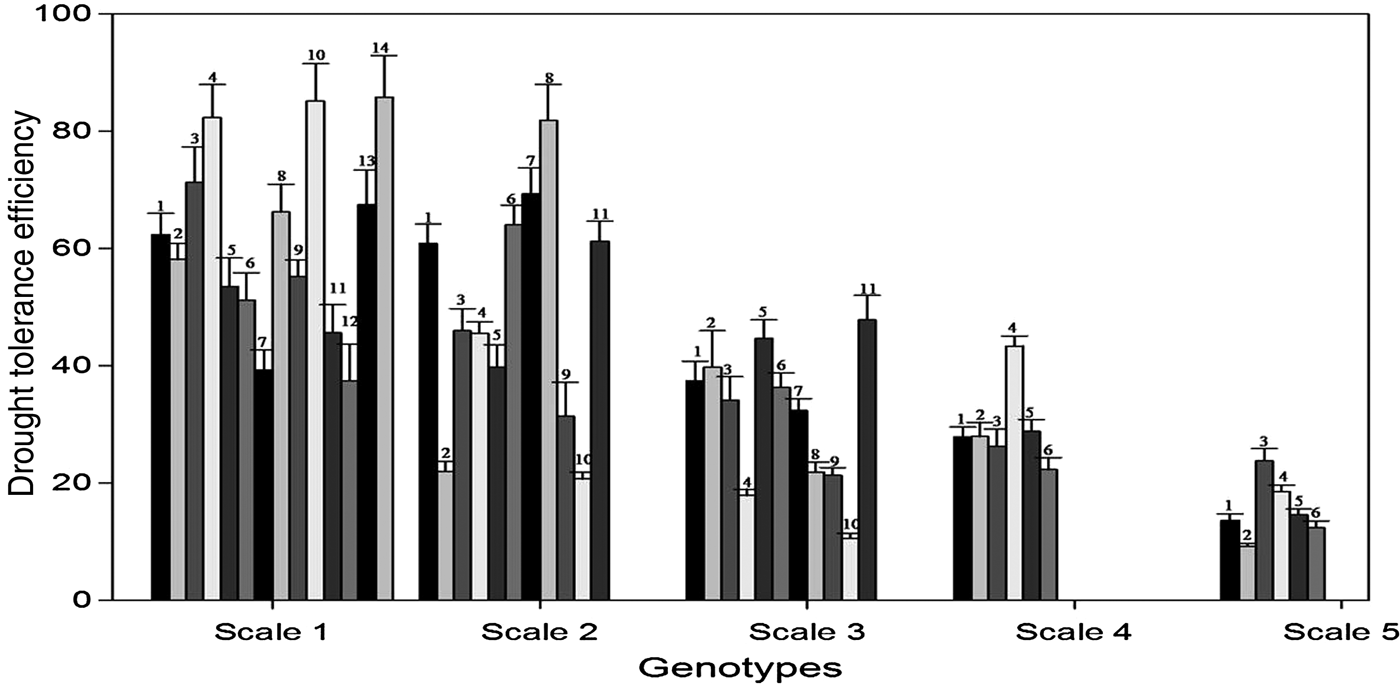
DTE of all genotypes were calculated based on yield comparing the both set of data. Some genotypes, which showed higher drought tolerance had relatively less yield. DTE of the genotypes grouped in different scale varied due to variation in yield. The DTE of genotypes of scale 1 ranged from 37.5% (IIHR-616-1) to 85.8% (SC-15) with mean value 61.5%. While DTE of genotypes on scale 5 ranged from 9.2% (EC-564755) to 23.8% (IIHR-675) with an average DTE of 15.4% (Fig. 1). Based on scaling and yield efficiency genotypes with more than 62% DTE were considered the drought-tolerant genotype came under scale 1 (seven genotypes) and scale 2 (three genotypes) as promising materials for breeding purpose (Table 1).
Bar number in scale represents the genotypes: scale 1 (1) IIHR-375, (2) EC-564754, (3) IIHR-619, (4) Arka Jeet, (5) IIHR-190, (6) IIHR-718, (7) IIHR-655, (8) IIHR-680, (9) IIHR-623, (10) MJ-7, (11) IIHR-662, (12) IIHR-616-1, (13) IIHR-677, (14) SC-15, scale 2 (1) IIHR-652, (2) JRO-4-38, (3) JRO-4-10, (4) IIHR-681, (5) IIHR-671, (6) Pusa Madhuras, (7) IIHR-708, (8) BS-25, (9) MS-1, (10) IIHR-653, (11) IIHR-387, scale 3 (1) RM-43, (2) IC-570065, (3) IIHR-Gyno, (4) IIHR-660, (5) Dharwad sel 1, (6) IIHR-MS-5, (7) MM-1, (8) BS-41, (9) Punjab Sunehari, (10) MJ-1, (11) Hara Madhu, scale 4 (1) GPW-15, (2) IIHR-624, (3) Durgapura Madhu, (4) IIHR-673, (5) GP-3, (6) SPO4-20, scale 5 (1) IIHR-663, (2) EC-564755, (3) IIHR-675, (4) GPW-12, (5) IIHR-659, (6) IIHR-595.

Phsiological parameters
Changes in RWC and EL
The RWC of different genotypes varied from 60.8% (IIHR-4-38) to 86.9% (MJ-7) under normal irrigated set of experiment. However, after 30 d of severe water-deficit, the highest RWC% was recorded in SC-15 (68.2%) followed by MJ-7 (67.7%) and Arka Jeet (66.6%), while, IIHR-GPW-12 (35.3%), IIHR-595 (36.2%) and EC-564755 (36.8%) had lowest RWC (Table 2 and online Supplementary Table S1). The maximum reduction in RWC was in EC-564755 (49.1%) followed by IIHR-595 (48.2%) and IIHR-663 (47.5%), whereas the lowest reduction was in SC-15 (18.3%) followed by MJ-7 (22.1%) and Arka Jeet (22.2%) in stress exposed set of experiment compared with normally irrigated set of experiment. After 30 d of water-deficit, lowest EL was 22.6% (SC-15) followed by 25.2% (MJ-7) and 26.9% (Arka Jeet), with per cent increase by 42.2, 46.1 and 48.6, respectively, compared with normal irrigated set of experiment. The genotypes with maximum EL% was EC-564755 (79.9) followed by IIHR-595 (71.9), and IIHR-663 (65.3), respectively and their per cent increase was 135, 123 and 131, respectively in drought exposed plants compared with control (Table 2 and online Supplementary Table S1).
Data presenting average, mean value, standard deviation, minimum, maximum and confidence level of 48 genotypes for the parameters RWC, EL, F v /Fm and CCI, under well-watered and drought stress condition

RWC, relative water content; EL, electrolyte leakage; F v /F m , photosynthetic efficiency; CCI, chlorophyll concentration index; WW, well-watered; DS, drought stress; SD, standard deviation.
Changes in Fv/Fm and CCI
Fv/Fm reduced when plants exposed to water-deficit comparatively with normal set of experiments. Under well-watered condition the maximum F v /F m was observed in IIHR-190 (0.82), followed by IIHR-653 (0.82) and Punjab Sunehari (0.80), respectively, while the minimum in IIHR-660 (0.62). The maximum reduction in F v /F m was observed in EC-564755 (58.1%), followed by IIHR-595 (55.5%), and IIHR-663 (53.1%), respectively. The F v /F m of EC-564755, IIHR-595 and IIHR-663 was 0.31, 0.34 and 0.37, respectively, while the minimum reduction observed in the leaves of SC-15 (14.2%) followed by MJ-7 (22.2%), and their F v /F m values were (0.65 and 0.52), respectively (Table 2 and online Supplementary Table S1). Under water-deficit conditions CCI of the leaves frequently deviate leading to an altered CCI. The CCI of plant leaves of different genotypes ranged from 10.5 (IIHR-190) to 32.6 (BS-41) with a mean value of 18.1 (Table 2 and online Supplementary Table S1). Under drought stress highest increase and lowest decrease was recorded in SC-15 (97.7%) and EC-564755 (54.7%), respectively.
Root and shoot length
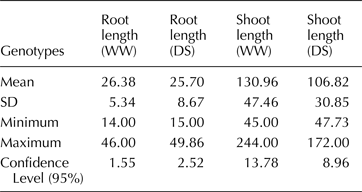
The drought-tolerant genotypes had an increased root length (RL) as compared with well-watered plant. Decrease in RL also occurs under drought stress in some genotypes, which leads to susceptibility of genotypes. Genotype with the maximum increase in RL under water-deficit was SC-15, MJ-7, Arka Jeet and BS-25, and their respective increase was 67.2, 66.7, 55.8 and 54.3%, compared with well-watered plant. The decrease in RL was observed in EC-564755, IIHR-595, IIHR-659 and IIHR-663, and the per cent of decrease in these genotype was 47.4, 40.6, 34.6 and 34.6%, respectively, compared with well-watered plants (Table 3 and online Supplementary Table S2). Drought stress exposure diminishes the shoot elongation, in spite of this, certain genotypes survive with their genetic ability of shoot enhancement even under water-deficit condition. The genotype IIHR-675 (63.4%), MJ-7 (60.4%) and SC-15 (57.8%) were noted as genotype with the maximum reduction in shoot length (Table 3 and online Supplementary Table S2). The genotype observed with increased shoot length under drought stress condition was IIHR-GPW-12 (14.6%), IIHR-663 (13.3%) and IIHR-659 (9.03%).
Data presenting average, mean value, standard deviation, minimum, maximum and confidence level of 48 genotypes for the parameters root length and shoot length, under well-watered and drought stress condition

WW, well-watered; DS, drought stress; SD, standard deviation.
Correlation of physiological parameters with DTE
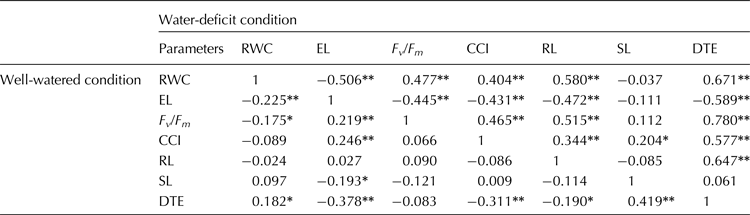
The DTE was positively and significantly correlated with RWC, F v /F m , CCI and RL in water-deficit treatment. Under well-watered condition DTE was positively and significantly correlated with RWC and shoot length, while DTE was negatively correlated with EL, F v /F m , CCI and RL (Table 4). The highest correlation was noted between DTE and F v /F m (r = 0.780), while significantly negative correlation was also observed between DTE and EL (r = −0.589) under water-deficit condition. A significantly positive relationship exists between DTE and shoot length (r = 0.419).
Correlation coefficients among various parameters

RWC, relative water content; EL, electrolyte leakage; F v /F m , photosynthetic efficiency; CCI, chlorophyll concentration index; RL, root length; SL, shoot length; DTE, drought tolerance efficiency.
**Significance at P ≤ 0.01, *Significance at P ≤ 0.05.
Discussion
Earlier reports regarding the screening methodology for drought stress are available in spring wheat (Clarke et al., Reference Clarke, Townley, McCaig and Green1984), groundnut (Ndunguru et al., Reference Ndunguru, Ntare, Williams and Greenberg1995), sugar beet (Ober et al., Reference Ober, Clark, LeBola, Royal, Jaggard and Pidgeon2004), wild cicer (Tocker et al., Reference Tocker, Canci and Yildrin2007) and chickpea (Parameshwarappa and Salimath, Reference Parameshwarappa and Salimath2008). Zhang et al. (Reference Zhang, Gong, Guo, Ren and Xu2011) reported drought stress at the seedling stage in watermelon, but does not evaluated same genotypes with economic yield under drought stress.
In the present study, we are reporting screening of muskmelon for drought stress under field condition, which has been supported by physiological parameters. Drought stress during the cropping period of muskmelon reduced total yield due to less number of fruit and smaller fruit size. The possible reason for this reduction in yield was slowed physiological process (Cabello et al., Reference Cabello, Castellanos, Romojaro, Martinez-Madrid and Ribas2009; Ibrahim, Reference Ibrahim2012). Among the studied genotypes, 14 had been categorized on scale 1, out of them three genotypes had yield loss more than 60% under drought stress condition. Hence, selection of drought-tolerant genotype based only on visual parameter might not be a correct approach for the identification of drought-tolerant genotypes. The genotype IIHR-616 grouped on scale 1 showed yield loss 62.6% and genotype IIHR-673 grouped on scale 4 showed yield loss 56.6% in drought stress. The genotype IIHR-673 could be a better alternative for drought stress based on DTE, while it is in susceptible category based on 5 point scale. The higher yield in drought susceptible genotypes are due to early flowering and fruiting as first 30 d, both set of experiment was under normal irrigation. Genotype SC-15, MJ-7 and Arka Jeet, grouped under scale 1, with better yield under drought stress. However, earlier Arka Jeet was reported as drought susceptible (Dhillon et al., Reference Dhillon, Monforte, Pitrat, Pandey, Singh, Reitsma, Garcia-Mas, Sharma and McCreight2012), in which drought stress was initiated at 60 d after sowing. In normal condition, muskmelon bears fruiting in 45–50 d of sowing and after 60 d plants are starting to sencence phase. Gomez et al. (Reference Gomez, Oliva, Mielke, de Almeida, Leita and Aquino2008) suggested that tolerance level of plants to drought stress depends on plant age, therefore Arka Jeet showed the tolerance in a previous experiment. Out of 11 genotypes came under scale 2, five genotypes had more than 40% yield reduction under drought stress. While two genotypes which showed yield loss more than 75%. Genotypes under scale 3 showed more than 50% yield loss when exposed to drought stress. More than 70 and 80%, yield loss recorded for the genotype grouped on scales 4 and 5, respectively. Its apparent from the result that yield loss under drought stress is significant.
The genotypes grouped on scale 5 had reduced RWC and elevated EL, compared with scale 1 genotypes, under water-deficit condition. The scale 1 genotype SC-15, MJ-7 and Arka Jeet exhibited relatively lower reduction in RWC and slighter enhancement in EL, which indicated their greater potential of maintaining tissue water and less significant membrane damage under water-deficit condition. Sanchez et al. (Reference Sanchez, Rubio-Wilhelmi, Cervilla, Blasco, Rios, Rosales, Romero and Ruiz2010), identified drought-tolerant genotypes on the basis of RWC in tomato, while Valentovic et al. (Reference Valentovic, Luxova, Kolarovic and Gasparikova2006) reported that the EL of the sensitive maize cultivar increased higher compared with tolerant.
F v /F m and CCI, are the two consistent parameters for drought stress screening of a large number of genotypes. In the present study, the decrease in F v /F m was more pronounced in genotypes came under scale 5 compared with other category of scale. Maximum reduction in this parameter was observed for the scale 5 genotype, EC-564755, IIHR-595 and IIHR-663, while lowest photoinhibition occurred in scale 1 genotype SC-15 and MJ-7, which indicate lesser damage to photosystem II in these genotypes (Ranjbarfordoei et al., Reference Ranjbarfordoei, Samson and Damme2006). Higher F v /F m may be the probable reason for better yield of SC-15 and MJ-7 under water-deficit condition. In most of the drought-tolerant genotype CCI increased under water-deficit condition, however, it did not correlate with DTE% as few genotypes with higher DTE% showed lower CCI value. Brestic et al. (Reference Brestic, Zivcak and Olsovska2007) suggested that photosynthetic parameters could be a good tool for the screening of large number of genotypes under environmental stresses.
Under water stress condition plant adopt themselves to manage the water stress by changing in physiological traits, i.e. root and shoot length (Kusvuran et al., Reference Kusvuran, Dasgan and Abak2011). Enhanced RL permits the mature plants to absorb water from deeper soil layers (Liu et al., Reference Liu, Yang and Zhao2008), while reduced shoot growth helps in reduction of transpiration and evaporation. In the present study, increased RL and reduced shoot growth recorded for most of the drought-tolerant genotypes under water-deficit. Matsui and Singh (Reference Matsui and Singh2003) also reported similar trend of root distribution in various cowpea genotypes grown under moisture-deficit condition. The decrease in shoot length may be due to suppression of cell expansion and cell growth that is in response to low turgor pressure (Jaleel et al., Reference Jaleel, Manivannan, Lakshmanan, Gomathinayagam and Panneerselvam2008).
Highly significant positive correlation between DTE and RWC, F v /F m , CCI and RL observed in the present experiment, indicates better yield of a plant under progressive water-deficit is an integrative effect of superior performance of various physiological parameters such as RWC, F v /F m and CCI.
This technique could be apply for more number of genotypes in any crop for screening against drought stress. Identification of drought tolerance lines on the basis of visual observations and economic yield is much practical. The genotypes identified as drought tolerant in the present study could be used as genetic resources to develop muskmelon cultivars for drought stress environment.
Supplementary Material
The supplementary material for this article can be found at http://dx.doi.org/10.1017/S1479262116000253.
Acknowledgements
The authors acknowledge the generous support of the National Agricultural Innovation Project (NAIP), New Delhi. MAN-JRF-SRF provided to WAA by University Grant Commission (UGC), New Delhi, India, is fully acknowledged.