Introduction
Non-native species (NNS) have long been considered as one of the biggest threats to biodiversity, the stability of marine communities, and ecosystem functioning (Sala et al., Reference Sala, Chapin, Armesto, Berlow, Bloomfield, Dirzo, Huber-Sanwald, Huenneke, Jackson, Kinzig, Leemans, Lodge, Mooney, Oesterheld, Poff, Sykes, Walker, Walker and Wall2000; Bax et al., Reference Bax, Williamson, Aguero, Gonzalez and Geeves2003; Molnar et al., Reference Molnar, Gamboa, Revenga and Spalding2008; McGeoch et al., Reference McGeoch, Butchart, Spear, Marais, Kleynhans, Symes, Chanson and Hoffmann2010; Rohde et al., Reference Rohde, Schupp, Markert and Wehrmann2017). NNS can give rise to significant ecological and economic damage, however, a major concern is their high variation and unpredictability of impacts (Pimentel et al., Reference Pimentel, McNair, Janecka, Wightman, Simmonds, O'Connell, Wong, Russel, Zern, Aquino and Tsomondo2001; Lovell & Stone, Reference Lovell and Stone2005; Katsanevakis et al., Reference Katsanevakis, Wallentinus, Zenetos, Leppäkoski, Çinar, Oztürk, Grabowski, Golani and Cardoso2014). Coupled with this is the differing nature of impacts, for example both positive and negative impacts at the ecosystem service level rather than the overall perceived impact of species (Katsanevakis et al., Reference Katsanevakis, Wallentinus, Zenetos, Leppäkoski, Çinar, Oztürk, Grabowski, Golani and Cardoso2014). In general, the preferred approach is to prevent the introduction and spread of NNS rather than to undertake expensive eradication or control measures post establishment (Puth & Post, Reference Puth and Post2005; Pyšek & Richardson, Reference Pyšek and Richardson2010; Rohde et al., Reference Rohde, Schupp, Markert and Wehrmann2017). Implementing effective monitoring programmes to identify the arrival of NNS, serving as an early warning, is key in preventing establishment (Anderson, Reference Anderson2007; Rohde et al., Reference Rohde, Schupp, Markert and Wehrmann2017).
Marine organisms have likely been transported and become established around the world for thousands of years (Carlton & Hodder, Reference Carlton and Hodder1995; Aubet, Reference Aubet2001). However, globalization has led to the rapid increase in species introductions observed over the last few decades (Streftaris et al., Reference Streftaris, Zenetos and Papathanassiou2005; Floerl et al., Reference Floerl, Inglis, Dey and Smith2009; Hulme, Reference Hulme2009; Maceda-Veiga et al., Reference Maceda-Veiga, Escribano-Alacid, de Sostoa and García-Berthou2013; Sardain et al., Reference Sardain, Sardain and Leung2019). Maritime trade has long been recognized as the primary invasion vector for marine NNS (Ruiz et al., Reference Ruiz, Carlton, Grosholz and Hines1997; Katsanevakis et al., Reference Katsanevakis, Zenetos, Belchior and Cardoso2013; Williams et al., Reference Williams, Davidson, Pasari, Ashton, Carlton, Crafton, Fontana, Grosholz, Miller, Ruiz and Zabin2013; Bailey, Reference Bailey2015), either through ballast water or hull fouling, meaning that ports are considered to be more at risk of invasion by NNS than natural coastal habitats.
Despite the strong link between ports, maritime trade and NNS, there is relatively little published research aimed specifically at describing communities within ports (Bailey, Reference Bailey2015). This may be due in part to the limitations in terms of ease of access and safety when working within active ports, as well as the lack of need or desire for port owners to publish any findings from private surveys that may have been undertaken within their ports. By contrast, marinas are frequently studied worldwide as habitats for NNS (Canning-Clode et al., Reference Canning-Clode, Fofonoff, McCann, Carlton and Ruiz2013; Guerra-García et al., Reference Guerra-García, Ros and Baeza-Rojano2015; Foster et al., Reference Foster, Giesler, Wilson, Nall and Cook2016; Shenkar et al., Reference Shenkar, Shmuel and Huchon2018). Whilst marinas offer more accessibility and safety than ports, the habitats and factors influencing communities are often different even to the nearest port. Marinas are more commonly associated with the local spread of NNS through recreational boating (Martínez-Laiz et al., Reference Martínez-Laiz, Ulman, Ros and Marchini2019), rather than being the initial site of species introduction, which should be the focus when attempting to prevent invasions. Effective management of NNS is made much more difficult when there is a lack of survey data (Campbell, Reference Campbell2011; Dahlstrom et al., Reference Dahlstrom, Hewitt and Campbell2011; Azmi et al., Reference Azmi, Primo, Hewitt and Campbell2015), highlighting the importance of establishing long-term local and regional monitoring efforts. These should be focused on the most likely sites for novel introductions which, in most cases, are ports that are linked to the global maritime trade network.
Various methodologies for the monitoring of fouling communities and associated NNS have been trialled and published over the last few decades (e.g. Cohen et al., Reference Cohen, Harris, Bingham, Carlton, Chapman, Lambert, Lambert, Ljubenkov, Murray, Rao, Reardon and Schwindt2005; Arenas et al., Reference Arenas, Bishop, Carlton, Dyrynda, Farnham, Gonzalez, Jacobs, Lambert, Lambert, Nielsen, Pederson, Porter, Ward and Wood2006; Floerl et al., Reference Floerl, Inglis, Peacock and Plew2012). Rapid assessment surveys (RAS) are a favoured method and have been successfully applied in ports and marinas around the world (Cohen et al., Reference Cohen, Harris, Bingham, Carlton, Chapman, Lambert, Lambert, Ljubenkov, Murray, Rao, Reardon and Schwindt2005; Mineur et al., Reference Mineur, Cook, Minchin, Bohn, MacLeod and Maggs2012; Bishop et al., Reference Bishop, Wood, Yunnie and Griffiths2015). However, the industrial nature of ports can provide difficulties when attempting to safely conduct this type of survey. Traditionally, RAS have targeted existing submerged structures (e.g. pontoons, buoys, ropes and chains; Cohen et al., Reference Cohen, Harris, Bingham, Carlton, Chapman, Lambert, Lambert, Ljubenkov, Murray, Rao, Reardon and Schwindt2005; Arenas et al., Reference Arenas, Bishop, Carlton, Dyrynda, Farnham, Gonzalez, Jacobs, Lambert, Lambert, Nielsen, Pederson, Porter, Ward and Wood2006; Mineur et al., Reference Mineur, Cook, Minchin, Bohn, MacLeod and Maggs2012), where well-established fouling communities can be surveyed without the need to deploy some form of settlement material. This type of survey benefits from being a quicker and cheaper method than most alternatives, and it covers a range of different structures, materials and habitats. It is, however, difficult to record small and cryptic organisms which may be inhabiting structures as the rapid assessment does not use destructive sampling (Rohde et al., Reference Rohde, Schupp, Markert and Wehrmann2017). Further, it is not feasible to compare colonization quantitatively among sites due to the non-standardized area units. In larger and more active ports, RAS may not always be a viable option due to the lack of long-term submerged structures, safe access to suitable sites, and port health and safety regulations.
Settlement and colonization experiments are another chosen method for surveying fouling communities. This method has been heavily used over the past few decades and has been adapted into various designs, using a range of materials and deployed in a range of environments (Floerl et al., Reference Floerl, Inglis, Peacock and Plew2012; Bangor University, 2015; Cook et al., Reference Cook, Beveridge, Twigg and Macleod2015). Generally, some form of plastic is used as a virgin settlement surface for larval settlement and development, with most survey designs applying a single plastic tile suspended in the water column and deployed for a period of several months.
The advantage of this survey type is the ability to record quantified data and the option to choose suitable sites for deployment, which is particularly beneficial for use within active ports. The need for an extended deployment period with settlement surveys, often at least three or four months, and the associated higher costs that follow, are the main reasons why RAS have increased in use over the last couple of decades.
Various studies have applied both RAS and settlement experiments, either in an effort to compare the accuracy of each method or to provide a more robust survey (Cook et al., Reference Cook, Beveridge, Twigg and Macleod2015; Hurst, Reference Hurst2016; Marraffini et al., Reference Marraffini, Ashton, Brown, Chang and Ruiz2017). Perhaps the most important finding when comparing the two methods within the same study is the accuracy of identifying NNS (Lehtiniemi et al., Reference Lehtiniemi, Ojaveer, David, Galil, Gollasch, McKenzie, Minchin, Occhipinti-Ambrogi, Olenin and Pederson2015). Comparisons have shown that both settlement surveys and RAS are liable to miss certain NNS but are reliable at identifying the majority of NNS present (Cook et al., Reference Cook, Beveridge, Twigg and Macleod2015; Marraffini et al., Reference Marraffini, Ashton, Brown, Chang and Ruiz2017). Cook et al. (Reference Cook, Beveridge, Twigg and Macleod2015) reported that settlement surveys and RAS each missed two species which were found in the other survey type, suggesting that the most robust surveys would incorporate elements of each survey type.
Arguably, the most comprehensive guide for surveying within ports is the HELCOM/OSPAR combined strategy targeted for use within the Baltic Sea (HELCOM, 2013). Whilst this strategy suggests a preference for the combined use of RAS and settlement surveys, it concedes that RAS may not be a viable option in all ports. Despite this, no alternative adapted survey type is offered, with it being suggested that a traditional form of settlement survey alone would be sufficient (HELCOM, 2013).
It follows that both survey types could be adapted for use within ports, to include beneficial traits of each whilst overcoming some of the limitations to working within active ports. These modified surveys could also provide some key information which currently neither RAS nor settlement experiments offer and yet which may prove valuable in informing targeted biosecurity plans (e.g. colonization rate and community succession over the deployment period).
The aim of this research was to design a survey method tailored to describe the fouling community within an active port, focusing on identifying non-native species that may be present. The objectives were to:
(a) quantify the succession of faunal colonization,
(b) compare colonization success and fouling communities among different sites within the port,
(c) identify differences in faunal colonization between materials typically present in ports.
Two survey methods were developed and tested in an active port, the Port of Swansea, Wales, UK. The relative success of each survey method was assessed with respect to understanding the fouling community and detecting NNS. The potential role of the surveyed port as a vector for NNS into the region was considered.
Materials and methods
Study area
Research was conducted within the Port of Swansea, South Wales, UK. This port is an enclosed area consisting of three connected docks linked to the Bristol Channel via a lock. The oldest of these three docks, the Prince of Wales Dock, was constructed in the late 19th century with the other two docks, King's Dock and Queen's Dock, being constructed in the early 20th century. Historically the Port of Swansea has traded largely in copper, coal, tinplate and oil, of which only coal remains to be traded today following a decline in trade throughout the 20th century. Along with coal, the port now regularly trades in dry bulks, scrap metals, timber and general cargo, as well as having an aquaculture production site designated within Queen's Dock for the culture of blue mussels (Mytilus edulis; Linnaeus, 1758). Around 600,000 tonnes of cargo are traded annually with an average of 81 ships per week transiting in and out of the lock, including pilotage and tug vessels (ABP, unpublished).
Temperature within the port ranged from ~11°C in November to a maximum of ~22°C during July; the average temperature for the entire survey period was ~17.5°C. Mean salinity was recorded as 28.5, with no significant stratification. Whilst the Bristol Channel experiences a tidal range of up to 13 m, water levels within the port are maintained at around 10–12 m through regular pumping directly from the Bristol Channel to replace water lost primarily through lock operation. These docks therefore offer a unique insight into an isolated subtidal habitat which is influenced by water from the Bristol Channel as well as any potential species introductions through maritime trade or aquaculture.
Site selection
A total of three sites were selected for the deployment of survey materials, called Zone A, B and C in this study (Figure 1). Due to the level of activity within the Port of Swansea, safe operation was a key factor in identifying suitable deployment sites. Sites were selected based on (a) the availability of surface mounting points (e.g. mooring bollards, fences, shackles etc.), (b) the proximity to active working berths or derelict infrastructure for safety reasons and to minimize the chance of removal of materials, (c) the proximity to other sites to ensure a wide coverage across the docks. Each zone contained two deployment sites, one for each distinct survey type, located within close proximity of one another (<10 m). Zone A did not meet this criterion due to the busy operational quay limiting safely accessible mounting points; mixed material survey materials for this zone were hence deployed at the nearest suitable location (Figure 1). Zones B and C do contain two deployment sites located within <10 m of each other.
Map outlining the position of survey sites within the Port of Swansea. Each zone contains a location for the deployment of both a ‘Successional Settlement Survey’ and a ‘Mixed Material Survey’. Zones are outlined showing paired sites.

Successional settlement survey (SSS)
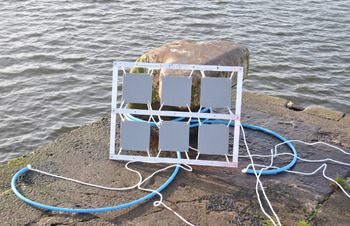
Acrylic (PMMA) tiles (225 cm2, 15 cm × 15 cm, grey in colour) were used as the settlement material. Six tiles per site were lightly sanded using 40 grit sandpaper and mounted, using cable ties, within an aluminium frame (Figure 2). Each frame was suspended in the water column using polypropylene rope, attached to a fixed surface mounting point (e.g. a mooring bollard; Figure 2). Frames were suspended initially to a depth of ~4 m, although the water level in the port can vary meaning that depth did not remain constant during deployment. Materials remained in deployment for 6 months from deployment in May 2018 until collection in November 2018.
Successional Settlement Survey materials prior to deployment.

This survey type was designed to provide quantified measures of certain ecological parameters, namely species abundance and percentage cover, as well as informing on the colonization rate and whether there is a successional change in community assemblage over the deployment period. Mounting six tiles within one frame also overcame some of the logistical issues of working within an active port, most notably the lack of availability of safe working areas.
Mixed material survey (MMS)
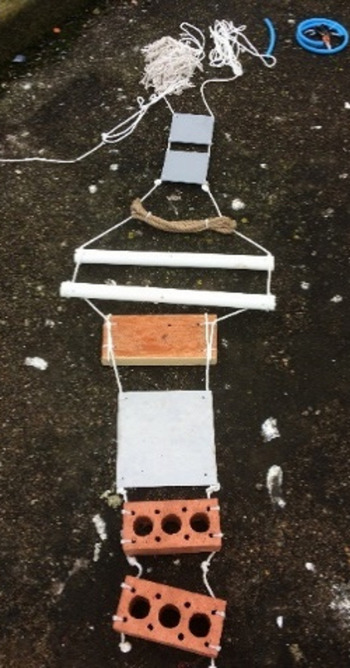
This survey type comprised various materials that are commonplace in most ports, each acting as a settlement surface for larval settlement and development. Materials included brick, soft wood (construction timber, pressure treated), rope (natural fibre and polypropylene), steel, plastic (acrylic tiles as used in the Successional Settlement Survey, and PVC tubing), and a cotton fibre mop head (to represent more complex fibrous materials). Both forms of plastic included sanded and unsanded variations to investigate any potential settlement preferences based on material roughness. Materials were connected in a set sequence along lengths of rope (Figure 3) and, as with the Successional Settlement Survey, suspended in the water from a fixed surface mounting point. Depth of deployment ranged between ~3–6 m, based on the length of the materials and fluctuations in water level. Materials were deployed for 8 months from May 2018 to early February 2019. This survey was designed to investigate whether there is any material preference for settlement of organisms, non-native or native, and whether community composition varied between materials.
Mixed Material Survey materials prior to deployment.

Sampling
Materials for each survey type were deployed during May 2018 at three sites (Zones) within the Port of Swansea (Figure 1). Zones were visited monthly over a deployment period of 6 months and 8 months for the SSS and MMS, respectively. For the SSS, one acrylic tile was removed from the frame each month and taken for laboratory-based taxonomic identification of the species present. MMS materials remained untouched throughout deployment. Materials were collected after 8 months, following a detailed description of colonization and identification of species in situ.
Laboratory analysis
Samples collected as part of the SSS underwent laboratory-based analysis. Acrylic tiles were destructively sampled, whereby organisms were systematically removed and identified. Analysis consisted of a visual taxonomic identification to the lowest possible taxon of macrofauna present on tiles and in scrape samples. A combination of dissection and compound microscopes were used where necessary, and identification of species was achieved with the aid of various guides including Handbook of the Marine Fauna of North-West Europe (Hayward & Ryland, Reference Hayward and Ryland2017), British Marine Amphipoda (Lincoln, Reference Lincoln1979) and Linnean Society taxonomic materials. When necessary, organisms (e.g. amphipods and polychaetes) were fixed and preserved for short periods of time in 70% ethanol to aid identification.
Data analysis
Percentage cover analysis
Percentage cover of PMMA tiles (SSS and MMS) and selected other materials forming the MMS (brick, PVC pipe, steel and wood) was calculated from photos, using ImageJ software. Images were set to a known scale and covered areas were measured, with percentage calculated using a known total surface area of materials. Three materials (mop head, polypropylene rope, sisal rope) were omitted from the percentage cover analysis due to the inaccuracies in being able to measure coverage. For the SSS only, percentage cover was recorded for both the front (facing into the water column) and rear (facing into the port wall) orientation of settlement tiles. All statistical analyses in this section were performed within RStudio v.1.2.1335 (R Core Team, 2017).
Percentage data for both survey types was converted to proportion (range 0–1) before any statistical analysis. Data from the SSS were found to be non-normally distributed based on Shapiro–Wilk normality tests (P < 0.05) for both proportion and arcsine transformed proportion data. A beta regression was used to statistically analyse the effect of ‘Month’ and ‘Orientation’ on the observed percentage cover. Post-hoc Mann–Whitney U tests were used to analyse the pairwise differences between month groups.
As with the SSS, proportion data recorded within the MMS were found to be non-normally distributed based on Shapiro–Wilk tests of both proportion and arcsine transformed data (P < 0.05). A Kruskal–Wallis test was used here to analyse the effect of Material on the observed percentage cover. Dunn's tests were performed as post-hoc pairwise analyses between material groups.
Whole community analysis
Primer 6 v.6.1.13 with PERMANOVA v.1.0.3 software (Anderson et al., Reference Anderson, Gorley and Clarke2008; PERMANOVA+ for PRIMER software) was used to analyse whole community abundance data between samples collected within the SSS and within the MMS. Four species identified could only be recorded by measure of area covered (cm2), rather than abundance counts, and these remained within the analysis. Data were first transformed using a Log(x + 1) transformation. This transformation was selected in order to downweight a small number of highly abundant species, thus increasing the importance of species diversity within the analyses, as well as to accommodate for the combined use of abundance and coverage data within the same analyses.
The Bray–Curtis similarity index was used to create a similarity matrix, from which non-metric multidimensional scaling (nMDS) and PERMANOVA analyses were performed. PERMANOVAs were designed with two factors (Zone and Month for the SSS, and Zone and Material for the MMS) and one response variable (values in the similarity matrix). No interaction term between factors was included. The model used the permutation of residuals under a reduced model with type III (partial) sum of squares and 9999 permutations. Pairwise PERMANOVAs were used ad hoc to analyse the differences between certain factor groups (Anderson et al., Reference Anderson, Gorley and Clarke2008). Factor groups were Zone: A, B, C; Material: Brick, Mop, PMMA (sanded), PMMA (unsanded), Polypropylene rope, PVC (sanded), PVC (unsanded), Sisal rope, Steel, Wood.
Cross-survey analysis
Species richness data (as total number of species recorded per sample, irrespective of surface area) was used in cross-survey analyses. These analyses were conducted to evaluate the effectiveness of each survey type at describing the whole fouling community, as well as identifying NNS. A Fisher–Pitman permutation test (Berry et al., Reference Berry, Mielke and Mielke2002) was conducted within R v. 3.6.2 (R Core Team, 2017), whereby the effect of the factor Survey Type (2 levels: SSS, MMS) on the response variable species richness was analysed.
Results
Successional settlement survey (SSS)
A total of 40 different taxa across 9 phyla were identified as part of the SSS (Supplementary Table S1). Of these, 7 may be classified as non-native species (NNS) within the UK. Arthropoda was the most represented phylum with 13 different species, whilst only one species each of Echinodermata, Platyhelminthes and Porifera were identified. In terms of total abundance and coverage Chordata was the most common phylum, of which all but one of the species were within the class Ascidiacea. A total of 1264 individuals of Ciona intestinalis (Linnaeus, 1767) were recorded over the 6-month survey period, making this the most abundant species.
The similarity in communities among zones and months were visualized by nMDS (Figure 4). Both factors, Zone and Month, significantly affected the structure of the faunal communities; ‘Zone’ (PERMANOVA, pseudo-F = 3.19, P = 0.0029) and ‘Month’ (PERMANOVA, pseudo-F = 5.05, P = 0.0003). Pairwise tests among Zones showed a significant difference in community assemblage between Zone C and Zone A (PERMANOVA, t = 1.411, P = 0.0299).
nMDS plot of colonizing species communities collected within the Successional Settlement Survey. Plot based on a resemblance matrix created using Bray–Curtis similarity indices of Log(X + 1) transformed abundance data. Samples labelled by factor ‘Month’; symbols represent location factor ‘Zone’; June samples were removed from plot since communities were so species-poor that they could not be plotted in a meaningful way in relation to subsequent months.

The total number of species recorded per sample increased consistently to a maximum mean of 17.33 species per sample in October before falling to 14 species per sample in November (Figure 5). Ascidiella scabra was amongst the first organisms to begin colonization in July and rapidly increased in abundance to a peak mean of 82.67 individuals per sample in September before falling during October and November. The abundance of amphipods declined at a similar time to A. scabra. A similar downward trend from September to November can be seen in the total number of non-native species (NNS) recorded per sample, from a maximum mean of 3.67 species per sample in September to 2.33 species per sample in November. Conversely, the coverage of colonial ascidians and the abundance of Aurelia aurita polyps began to increase from September through to a maximum recorded mean coverage in November of 6.33 cm2 per sample for colonial ascidians and mean abundance of 50 individuals per sample for A. aurita polyps.
Colonization of settlement tiles in Swansea Port (450 cm2, N = 3). (A) total number of species recorded; (B) number of non-native species (NNS); (C) abundance count of Ascidiella scabra; (D) surface area coverage (cm2) of colonial ascidians; (E) abundance count of amphipods; (F) abundance count of Aurelia aurita polyps.

Percentage cover was recorded for both the front (facing away from the port wall) and the rear (facing towards the port wall) of each tile each month (Figure 6). Two months after deployment colonization reached over 90% and 70% coverage for the front and rear of tiles, respectively. Coverage of the front of tiles remained over 90% for the remainder of the survey period.
Percentage cover of PMMA tiles recorded each month within the Successional Settlement Survey (225 cm2, N = 3). ‘Front’ refers to the orientation of tiles facing away from port walls, ‘Rear’ refers to the orientation of tiles facing the port walls.

The rear orientation of tiles took until September to reach ~90% coverage, with the maximum coverage of 97% being achieved in October. There is no evidence here that the factors ‘Month’ (Beta regression, z = 1.399, P = 0.162) and ‘Orientation’ (Beta regression, z = −0.579, P = 0.563), nor the interaction of these factors (Beta regression, z = 0.212, P = 0.832) significantly affect percentage cover. Pairwise analyses between months showed that percentage cover increased significantly from June to September (Mann–Whitney U test, P = 0.0449), June to October (Mann–Whitney U test, P = 0.0081), and June to November (Mann–Whitney U test, P = 0.0043); percentage cover did not significantly increase in any other month groups (Mann–Whitney U tests, P > 0.05).
Mixed Material Survey (MMS)
Fifteen species were recorded within the MMS surveys (Supplementary Table S2). As with the SSS, Arthropoda was the most represented phylum with 7 species. Species with the highest total abundances were within the phylum Chordata, the most abundant species here being the Ascidiacea Ascidiella scabra and Ciona intestinalis with a total recorded abundance of 264 and 337, respectively, across all materials and all zones (Supplementary Table S2). Several species were recorded from only one material: Spirobranchus triqueter and Palaemon serratus (Pennant, 1777) from sanded PMMA tiles, Carcinus maenas (Linnaeus, 1758) and Macropodia rostrata (Linnaeus, 1761) from mop heads and Bugula neritina (Linnaeus, 1758) from unsanded PMMA tiles.
Community analysis indicated that both material type (PERMANOVA, pseudo-F = 2.57, P = 0.0011) and zone (PERMANOVA, pseudo-F = 3.44, P = 0.0008) significantly influenced the colonizing fauna (Figure 7). However, there was no apparent grouping of material types, except for sisal rope due to the presence of only one organism, Ciona intestinalis, on the material. Pairwise comparison of all materials did not identify significant differences between isolated materials (PERMANOVA, P > 0.05; due to a small sample size of three within each material group the number of permutations completed was below the required level to consider the analysis reliable). Samples from Zone C were clustered together and pairwise analysis showed a significant difference between the communities within zones A and C (PERMANOVA, t = 1.411, P = 0.033). All other pairwise comparisons were not significant.
nMDS plot of samples collected within the MMS. Raw data transformed using a Log(X + 1) transformation. Plot based on a resemblance matrix created using a Bray–Curtis similarity index. Samples labelled by factor ‘Zone’; symbols represent factor ‘Material’.

Seven of the 10 materials present within the MMS had the total colonized area measured and converted to percentage cover (Figure 8). Each form of PMMA tile (sanded and unsanded) along with wood were among the most heavily colonized materials. Sanded PMMA and wood had the highest median coverage of 34% and 36%, respectively, after 8 months of deployment. Steel was consistently recorded with the smallest amount of colonization with a median of 4%. Material type was found to have a significant effect on the observed percentage cover (Kruskal–Wallis, P = 0.031).
Percentage cover of organisms present on selected materials from within the MMS after 8 months. N = 3 for each material.

Significant differences in percentage cover were identified between: sanded PMMA and sanded PVC; sanded PMMA and steel; unsanded PMMA and steel; wood and steel (Dunn's test, P < α/2 where α = 0.05). No significant differences in percentage cover were recorded between all other material pairs (Dunn's test, P > α/2 where α = 0.05).
The total abundance of organisms recorded from each material was standardized by surface area to abundance counts per 500 cm2 (Figure 9). PMMA tiles had the greatest abundance of organisms per 500 cm2 with median values of 130 (sanded PMMA) and 56.7 (unsanded PMMA). The mop head saw the lowest abundance per 500 cm2 with 1.4. However, the copious strands of the mop head had a far greater surface area than any other material (6960 cm2); on average 29.5 ± 25.0 SD organisms were recorded per mophead. Material type significantly influenced the abundance of organisms per 500 cm2 surface area (Kruskal–Wallis, P = 0.01). Pairwise tests revealed significant differences between the following material types: sanded PMMA and mop head, sanded PMMA and polypropylene rope, sanded PMMA and sisal rope, sanded PMMA and steel, unsanded PMMA and mop head, unsanded PMMA and sisal rope, unsanded PMMA and steel (Dunn's test, P < α/2 where α = 0.05). No significant differences in the abundance per 500 cm2 were recorded between any other material pairs (Dunn's test, P > α/2 where α = 0.05).
Total abundance of organisms per 500 cm2 recorded on each material used within the MMS. Abundance counts standardized using the surface area of each material to allow for direct comparison. N = 3.

Non-native species (NNS)
A total of 7 NNS were recorded during this research. All 7 species were identified from within the SSS, with only 5 of the 7 identified within the MMS (Table 1). Caprella mutica (Schurin, 1935) and Monocorophium acherusicum (Costa, 1853) were the two species found exclusively within the SSS. Bugulina stolonifera had the greatest average abundance of all NNS in the SSS as well as MMS, and a second bryozoan, Bugula neritina, had the lowest average abundance.
Mean abundance of NNS per 500 cm2 (± SE) of each NNS recorded within the two survey types: Successional Settlement Survey (SSS) and Mixed Material Survey (MMS)

Cross-survey analysis
Species richness data (as the total number of species recorded in samples) were analysed across the two survey types to identify the effectiveness of each survey type at describing fouling communities as well as identifying NNS. Considering all species, the SSS attracted a larger number of species compared with the MMS (Figure 10). This difference was found to be statistically significant (Fisher–Pitman permutation test, Z = −2.0207, P = 0.0433) and therefore demonstrates that survey type was a significant factor in determining the number of species recorded. Survey type was found to have no significant effect on the number of NNS recorded (Fisher–Pitman permutation test, Z = −0.488, P = 0.6256).
Average species richness recorded with the two survey types ‘Successional Settlement Survey’ (SSS) and ‘Mixed Material Survey’ (MMS). Species per 2700 cm2 for SSS (sum of 6 tiles per zone), 13,533 cm2 for MMS (sum of all materials per zone); N = 3.

Discussion
Fouling communities
Selection of materials by sessile benthic organisms is more complex than that of mobile organisms, relying on a wide range of factors including orientation, position, material, light, pollution, recruitment, competition, predation and biofilms, amongst others (Osman, Reference Osman1977; Sutherland & Karlson, Reference Sutherland and Karlson1977; Harris & Irons, Reference Harris, Irons and Cairns1982; Keough & Downes, Reference Keough and Downes1982; Glasby, Reference Glasby1999, Reference Glasby2000; Glasby & Connell, Reference Glasby and Connell2001; Dobretsov et al., Reference Dobretsov, Qian and Wahl2005; Blockley & Chapman, Reference Blockley and Chapman2006; Nydam & Stachowicz, Reference Nydam and Stachowicz2007; Qian et al., Reference Qian, Lau, Dahms, Dobretsov and Harder2007; Tyrrell & Byers, Reference Tyrrell and Byers2007; Crooks et al., Reference Crooks, Chang and Ruiz2011). Applying two different survey types greatly improved our knowledge of the fouling community present within an industrial port environment. The rapid rate of colonization of settlement tiles within the successional settlement survey (SSS) was striking. Colonization to over 90% coverage took only 2 months for the sides of tiles facing the water column. Colonization during this time period (May to July) was expected as this coincides with the annual phase of benthic larval settlement, although the process can be highly variable (Keough, Reference Keough1983; Ronowicz et al., Reference Ronowicz, Kukliński, Lock, Newman, Burton and Jones2014). Colonization rates were comparable to those observed in a similar study conducted in marinas in North Wales (Bangor University, 2015), even though the study focused on individual species and did not record overall coverage.
Of the 38 species identified in total, 18 fell into the functional group of filter feeders, including the three most abundant species: Ciona intestinalis, Ascidiella scabra and Bugulina stolonifera. In natural ecosystems filter feeders can play a key role in structuring phytoplankton communities and in nutrient cycling, and therefore controlling primary production to an extent (Stein et al., Reference Stein, De Vries and Dettmers1995; Sánchez et al., Reference Sánchez, Paredes, Lebouvier and Green2016). Given that the Port of Swansea is an enclosed system, it is likely that filter feeders, particularly the abundant solitary ascidians, play a major role in determining clearance rates and forming the observed communities. Filter feeders have also been identified as keystone species in other systems (Persson et al., Reference Persson, Brett, Vrede and Ravet2007), the effect of which may be further enhanced through the production of faecal pellets which may support a range of different organisms such as the detritivores identified within this study (Ostroumov, Reference Ostroumov2005). It was observed that ascidian species would readily settle directly onto the tests of A. scabra, with up to five different ascidian species being recorded on one individual. Ascidiella scabra has a cartilaginous test making it rigid with a rough texture, creating a viable surface for larval settlement. By contrast C. intestinalis, the only other frequently abundant and large solitary ascidian identified, has a more flexible and softer test, and consequently no organisms were observed to settle directly onto this species. It follows therefore that A. scabra may be a key species in increasing biodiversity within certain fouling communities.
By removing one settlement tile per month as part of the SSS it was possible to investigate community succession during the first 6 months of deployment. It provided greater survey power by recording species that were not present on settlement materials after 6 months but were present for intermediate stages within the 6-month period, thus providing a more complete insight into fouling communities rather than single ‘snapshots’ in time as is often the case when using settlement panels (Bangor University, 2015; Cook et al., Reference Cook, Beveridge, Twigg and Macleod2015; Hurst, Reference Hurst2016). Community structure was found to change over the course of the survey period, which we suggest here may be influenced by the presence of A. scabra. Dense aggregations of A. scabra appeared to support a number of additional taxa, such as various amphipod species, through the initial four months of colonization. This is made more apparent given the fall in the total number of species recorded per sample occurring concurrently with the fall in abundance of A. scabra.
Succession in this study saw the increase in coverage of colonial ascidians following the decline in A. scabra abundance. It is thought that the more two-dimensional habitat created by the colonial ascidians, compared with that created by dense A. scabra aggregations, provides less space, shelter and access to food, which are important factors in habitat selection by cryptic organisms (Aikins & Kikuchi, Reference Aikins and Kikuchi2001). This resulted in the transition from a more species-rich fouling community, when A. scabra was present in high abundance, to a more species-poor community as colonial ascidians increased in dominance.
Knowledge of how densely different materials are colonized and which species colonize each material can contribute to informing port management plans. This may be, for example, to adopt strategies to increase port biodiversity by focusing more on the types of materials that are present within the port. Community composition, total colonized area and the abundance of organisms per 500 cm2 were all found to be significantly influenced by material type. PMMA in particular was consistently found to support a greater abundance and total colonized area than most other materials, which may have wider implications for the distribution of organisms associated with marine litter (Miralles et al., Reference Miralles, Gomez-Agenjo, Rayon-Viña, Gyraitė and Garcia-Vazquez2018). Fibrous materials, such as rope and mop heads, were amongst the least colonized materials. This is thought to be based largely on larval habitat selection preferences, where more solid and secure substrata such as plastic, wood and brick is favoured (Osman, Reference Osman1977). Steel too would ordinarily be considered a viable substrate for larval settlement. However, accelerated low water corrosion (ALCW; Marty et al., Reference Marty, Gueune, Malard, Sanchez-Amaya, Sjogren, Abbas, Quillet, van Loosdrecht and Muyzer2014; Smith et al., Reference Smith, Bardiau, Brennan, Burgess, Caplin, Ray and Urios2019) was found to impede the colonization of steel, likely through chemical interaction with larvae or by creating a physical barrier for larval settlement (Smith et al., Reference Smith, Bardiau, Brennan, Burgess, Caplin, Ray and Urios2019). Contrary to observations made in the MMS, both of the sessile species recorded from only one material, Bugula neritina and Spirobranchus triqueter, have been reported to colonize a wide range of materials in previous studies (Li et al., Reference Li, Orihuela, Zhu and Rittschof2016; Gündoğdu et al., Reference Gündoğdu, Çevik and Karaca2017), and indeed in the SSS survey within this study. Whilst it is difficult to directly compare observations made here to previous colonization studies, particularly ones from different environments, it is probable that a number of the factors listed above are resulting in the reduced colonization of some materials by certain organisms. Given the high abundance of Ascidiella scabra, Ciona intestinalis and Bugulina stolonifera recorded in this survey across most materials, it seems likely that competition for space and food would be the primary factor in limiting colonization by various other species. Competition is likely enforced by a lack of larval recruitment, particularly with B. neritina as this species was recorded only five times across both survey types, which suggests there may be low larval recruitment for this species within the port. This information could be applied by port operators to promote certain communities within ports, or to increase the efficiency of port activities and processes by using specific material types.
Non-native species (NNS)
A total of 7 non-native species (NNS) were identified and recorded as part of this study, with only one species, Brachynotus sexdentatus, not being considered ‘established’ within the UK (NBN Atlas, 2019). The dates of first records for these species range from as long ago as 1875 for Bugulina stolonifera (Ryland, Reference Ryland1960) to as recent as 2000 for Caprella mutica (Willis et al., Reference Willis, Cook, Lozano-Fernandez and Takeuchi2004). Each of the established NNS can be found at various locations around the UK, having spread beyond the site of first introduction (Ryland, Reference Ryland1960; Eno et al., Reference Eno, Robin and Sanderson1997; Bracewell et al., Reference Bracewell, Spencer, Marrs, Iles and Robinson2012).
More locally to Swansea, all but C. mutica have been reported from the South Wales coastline with B. stolonifera, Bugula neritina and Brachynotus sexdentatus (Risso, 1827) having been recorded from within the Port of Swansea in the late 1950s (Naylor, Reference Naylor1957). Brachynotus sexdentatus has in fact only ever been recorded in the UK from within the Port of Swansea and, along with B. neritina, was thought to have been naturally eradicated from the port following the closure of the Tir John power station in the 1970s (Eno et al., Reference Eno, Robin and Sanderson1997; Arenas et al., Reference Arenas, Bishop, Carlton, Dyrynda, Farnham, Gonzalez, Jacobs, Lambert, Lambert, Nielsen, Pederson, Porter, Ward and Wood2006). Water within the port had been artificially heated whilst the power station was in operation, through the discharge of heated effluent, creating a suitable habitat for the warmer water natives B. sexdentatus and B. neritina (Keough & Chernoff, Reference Keough and Chernoff1987; Cuesta et al., Reference Cuesta, Schubart and Rodriguez2000). Arenas et al. (Reference Arenas, Bishop, Carlton, Dyrynda, Farnham, Gonzalez, Jacobs, Lambert, Lambert, Nielsen, Pederson, Porter, Ward and Wood2006) reported the presence of B. neritina from various locations around the UK, in contradiction to Eno et al. (Reference Eno, Robin and Sanderson1997), although no surveys were conducted within the Port of Swansea. It is likely that each of these species remained within the port through a successfully reproducing population rather than being reintroduced. It would appear though that the abundance of each species within the port has reduced since the last comprehensive survey was completed in the 1950s (Naylor, Reference Naylor1957). This may well be due to the cooling of the dock water which may have shifted the competitive edge back to some of the native species or indeed NNS, such as B. stolonifera, which have been recorded in high abundance within this study.
It is difficult to accurately comment on how, or even when, these NNS may have been first introduced to the port due to the lack of baseline data. Given the port activities it seems plausible that shipping is the likely pathway for all non-native introductions here. Ports are widely regarded as potential vectors for NNS, where they may be first introduced to a region within a port before spreading more locally along a natural coastline (Bailey, Reference Bailey2015). Regarding the NNS recorded in this study, only B. sexdentatus and C. mutica have not been previously recorded from elsewhere within the South Wales region. Therefore, these two species are at risk of being dispersed from the port into the natural environment of the Bristol Channel. Whilst it is unknown exactly when C. mutica was first introduced to the Port of Swansea, it can, however, be assumed that if the habitats and environmental conditions in the Bristol Channel were suitable for C. mutica then it would by now have spread out of the port. Caprella mutica is a common NNS worldwide and is regularly reported from within ports and marinas (Ashton et al., Reference Ashton, Willis, Burrows and Cook2007a). These reports along with experimental studies indicate that C. mutica can survive in temperatures ranging from −1.8 to 25°C (Schevchenko et al., Reference Schevchenko, Orlova and Maslennikov2004) but would likely not survive prolonged exposure to salinities below 18 (Ashton et al., Reference Ashton, Willis, Cook and Burrows2007b). Temperature ranges within the Bristol Channel fall comfortably within the tolerance of C. mutica, however the tidal nature of this region can result in salinities of 17 on low tides (Henderson et al., Reference Henderson, Plenty, Newton and Bird2012). Whilst the lower range of salinities here are short lived, it could potentially be the reason that C. mutica has not been recorded from the Bristol Channel. Competition from native caprellid amphipods (Shucksmith et al., Reference Shucksmith, Cook, Hughes and Burrows2009) such as C. linearis (Linnaeus, 1767), which is present in South Wales (NBN Atlas, 2019), or the possibility that C. mutica is in fact present in the Bristol Channel but has either not been observed in surveys or the data have not been reported in the public domain, may also be reasons for the perceived absence of C. mutica in the Bristol Channel.
A lot less is known about B. sexdentatus. Whilst temperatures within the Port of Swansea can range from ~5 to 25°C (unpublished), it is unlikely that B. sexdentatus would be able to tolerate the harsh conditions of large tidal range and temperature and salinity fluctuations that define habitats within the Bristol Channel, given that it is native to Southern Europe. The remaining five NNS have been previously recorded from the South Wales region (NBN Atlas, 2019) therefore the current risk of non-native invasion beyond the port is minimal for these species. Port-to-port and port-to-marina transport of NNS remains a risk through either ballast water or hull fouling and should therefore be considered in the port biosecurity risk management protocols. It is, unfortunately, impossible to say whether the NNS appeared first within the Port of Swansea or elsewhere within the Bristol Channel.
Effectiveness of survey methods
When discussing the effectiveness of each survey type designed for this study, the success of overcoming specific challenges of surveying within active ports must be considered, as well as the effectiveness of identifying species (both native and non-native), the quality of data provided and some of the more logistical aspects such as cost and level of required expertise.
Previous methodologies for the study of fouling communities in ports describe the use of rapid assessment surveys (RAS; Cohen et al., Reference Cohen, Harris, Bingham, Carlton, Chapman, Lambert, Lambert, Ljubenkov, Murray, Rao, Reardon and Schwindt2005; Arenas et al., Reference Arenas, Bishop, Carlton, Dyrynda, Farnham, Gonzalez, Jacobs, Lambert, Lambert, Nielsen, Pederson, Porter, Ward and Wood2006; Rohde et al., Reference Rohde, Schupp, Markert and Wehrmann2017), settlement surveys (Tyrrell & Byers, Reference Tyrrell and Byers2007; Floerl et al., Reference Floerl, Inglis, Peacock and Plew2012; Ronowicz et al., Reference Ronowicz, Kukliński, Lock, Newman, Burton and Jones2014) or a combination of the two (HELCOM, 2013; Cook et al., Reference Cook, Beveridge, Twigg and Macleod2015; Hurst, Reference Hurst2016). The SSS described in this study is a development of more conventional settlement surveys whilst the MMS is, in effect, an adaptation of a RAS, whereby materials are assembled and deployed rather than using materials that already exist in the port. This aims to overcome the problem of a lack of existing materials that can be safely accessed, which is the primary difficulty of using RAS within ports. The materials within the MMS would need to be in deployment for a number of years to be directly comparable to RAS, which may be considered for longer-term monitoring. Both survey types successfully overcame the primary limitations to conducting fouling community surveys within ports. All survey materials deployed in May 2018 remained undisturbed and were successfully retrieved in the winter of 2018. No materials interfered with port operations and researchers were able to comfortably work within the port health and safety regulations. This success was due in a large part to extensive field site visits and discussion with port authorities during the planning phase to limit the risk of interference in port activities and potential removal of materials.
As a direct comparison between survey types, the SSS was more effective than the MMS at identifying species, with an average of 27 species present per sample in the SSS compared with only 11 in the MMS. Both survey types did, however, record a similar number of NNS per sample, although two NNS (Caprella mutica and Monocorophium acherusicum) were recorded only from within the SSS. This indicates two key points: first, the MMS appears to attract a greater proportion of NNS per sample than the SSS; and second, that the SSS is more successful at describing whole fouling communities. It could be argued then that there is no need to deploy the MMS, as the SSS offers more in terms of data on fouling communities and can identify more NNS. The MMS does though offer important insight for stakeholders in terms of biosecurity planning. Clearly, a combination of the SSS and MMS provides the most useful data with consideration not only of what species are inhabiting the Port of Swansea, but also which materials may be of interest for future management.
Since the materials used in each survey were deployed as accurately as possible to a set depth and with the slight fluctuation in the port water level (between 10–12 m) over the course of deployment, depth effects may have influenced the observed fouling communities both between survey types and within the MMS, where materials extended over a couple of metres in sequence. Depth is known to be a factor in determining the formation of biofilms and settlement of some organisms (Hurlbut, Reference Hurlbut1991; Head et al., Reference Head, Davenport and Thomason2004; Kazmi et al., Reference Kazmi, Xuexi, Guangjian, Sikder and Xu2020) and has been found to be a significant factor in determining the community composition in a previous study (Lezzi & Giangrande, Reference Lezzi and Giangrande2018). Accommodating multiple SSS frames in sequence at set depths, similar to that done by Lezzi & Giangrande (Reference Lezzi and Giangrande2018), would enable depth as a factor to be investigated without the need for additional deployment sites. However, weight should be considered if doing this in future and retrieval of survey materials may not be feasible without mechanical assistance during months of peak colonization.
The quantity of data collected in this study varied between survey types primarily due to the way in which the data were collected. Species identified from the SSS were all recorded in the laboratory once a month for 6 months, whilst the MMS utilized field-based identification only once following the deployment period of 8 months. This is believed to be the primary reason for the significant difference between the number of species identified within the SSS and MMS, as there were six times as many samples collected and laboratory based analysis allows for the identification of more cryptic and smaller organisms that may be missed during field identification. A consideration for future applications would be to adapt the MMS survey procedure to include monthly field examinations, thus incorporating the element of succession and seasonality, which would probably increase the total number of recorded species and reduce the disparity between the MMS and SSS. Having three of each survey type deployed within the port provided minimal replication, particularly when considering the level of replication required for powerful statistical analyses. This is also an important factor when considering the probability of detection of rare species. Many studies that use settlement panels to detect NNS do not make reference to the probability of detection when determining appropriate sample sizes (e.g. Canning-Clode et al., Reference Canning-Clode, Fofonoff, McCann, Carlton and Ruiz2013; Bangor University, 2015; Hurst, Reference Hurst2016; Marraffini et al., Reference Marraffini, Ashton, Brown, Chang and Ruiz2017), however it is an important factor in determining the confidence that all NNS would be identified if present within a system and therefore the reliability of the survey method (Floerl et al., Reference Floerl, Inglis, Peacock and Plew2012; Ma, Reference Ma2020). Within ports it would be difficult to significantly increase the sample as the availability of sites to deploy materials that satisfy both the research aims and port authorities is generally very limited (HELCOM, 2013). Due to the practicalities of working within active ports there must be leeway for a degree of compromise between increasing the number of replicates and operating safely within a potentially dangerous environment. We suggest therefore that sample size should be increased, with a view to increasing the probability of detecting NNS, when it is possible to achieve this safely. It follows that the importance of this research tends more towards the descriptive aspect of identifying species and the applied focus of informing future port monitoring and biosecurity management strategies, in line with current legislation (Environment (Wales) Act, 2016; Regulation (EU) No 1143/2014). Whilst both surveys yielded quantified measures of species richness and abundance, these were more easily calculated from the SSS due to the standardized size of PMMA tiles compared with the varied surface areas of materials used within the MMS. A consideration for port authorities applying these methods in the future would be to reflect on what sort of data would be valuable. If it is simply a case of listing which organisms are inhabiting the port, then quantified data would be less of a priority.
There are several practical aspects that need to be considered, which weigh for and against each survey type: cost, time, level of expertise required, and equipment required. For each of these factors the differences between each survey type come down to the use of laboratory-based sample analysis. Each survey type cannot be separated in terms of the time required to deploy and retrieve materials; however, the more in-depth laboratory analysis takes considerably longer than field-based analysis. Laboratory analysis also requires a higher level of expertise and equipment than would be required to do more basic visual analysis in the field.
These factors contribute to the overall cost that would be incurred for port authorities to implement the survey methods, with the accessibility of experienced taxonomists along with the necessary equipment and resources being an important consideration for future applications.
It should also be noted that settlement surveys are just one way in which to monitor NNS and describe the wider fouling community. The use of molecular techniques such as metabarcoding and the isolation of environmental DNA (eDNA) from water samples is becoming increasingly popular in the field of invasion biology, where the applications can include screening for target NNS and tracing the origin of NNS as well as more broadly identifying organisms present in a specific environment (Rius et al., Reference Rius, Bourne, Hornsby and Chapman2015). Collecting water samples for the extraction of eDNA can be successfully and safely conducted within port environments, and has been proven effective at identifying some of the NNS identified within this study, suggesting this is a viable option for NNS screening (Borrell et al., Reference Borrell, Miralles, Do Huu, Mohammed-Geba and Garcia-Vazquez2017; Holman et al., Reference Holman, de Bruyn, Creer, Carvalho, Robidart and Rius2019). The use of eDNA and metabarcoding for the quantification of abundances, as well as being able to identify all organisms to species level, is perhaps currently limiting the use of this method. Alternatively, underwater video and the use of remotely operated vehicles (ROVs) can be an effective tool in identifying visually distinctive species and can cover large areas of habitat (e.g. Cánovas-Molina et al., Reference Cánovas-Molina, Montefalcone, Bavestrello, Cau, Bianchi, Morri, Canese and Bo2016, Meyer et al., Reference Meyer, Roberts, Mienis and Rapp2020). In the past, the use of ROVs has generally been constrained by cost to broad-scale and meso-scale surveys (Bo et al., Reference Bo, Bava, Canese, Angiolillo, Cattaneo-Vietti and Bavestrello2014; Cánovas-Molina et al., Reference Cánovas-Molina, Montefalcone, Bavestrello, Cau, Bianchi, Morri, Canese and Bo2016), however there is now an increasing use of mini-ROVs for smaller scale surveying which would be possible within ports (Buscher et al., Reference Buscher, Mathews, Bryce, Bryce, Joseph and Ban2020). Whilst video methods are likely to miss detail when it comes to identifying cryptic species, identifying organisms to species level and providing a detailed insight into community structure, the speed with which data can be collected means this method could prove effective in screening for visually distinctive NNS within ports. On balance, data obtained from the settlement surveys outlined here are currently the most effective compromise between cost, effort and level of detail, that can provide useful insights for managers into community structure and community development, which may be overlooked by alternative survey methods.
Conclusion
Deployment of the two survey designs outlined in this study was successful in terms of both overcoming the major constraints of conducting field surveys within active ports as well as providing a comprehensive description of the fouling communities present within the Port of Swansea. This success hinged on developing a strong working relationship with Associated British Ports, the operator of the Port of Swansea, which enabled for effective planning and implementation of surveys; a point which would likely be essential for conducting further surveys within active ports. A total of 38 species were recorded to species level, including 7 non-native species (NNS). Communities were found to be dominated by filter feeders, with large abundances of the solitary ascidians Ciona intestinalis and Ascidiella scabra as well as the non-native bryozoan Bugulina stolonifera. It is thought that some of these filter feeders, particularly A. scabra, serve as keystone species providing settlement surfaces and thereby supporting further colonization by additional taxa. Community succession was evident over the course of the survey period which we suggest here may be driven by the succession of A. scabra by colonial ascidians. Colonial ascidians increase in colonization as the abundance of A. scabra falls, leading to a change in habitat type and therefore community structure. Material type was found to play a significant role in determining community composition, and the knowledge gained on which materials support greater species richness or higher proportions of NNS has considerable implications for port management and could prove essential in developing biosecurity and biodiversity plans.
There is little concern over the NNS recorded from within the port, given that the only NNS not to have been previously recorded in South Wales are unlikely to survive in the environmental conditions of the highly tidal Bristol Channel. Transport of NNS from port-to-port through ballast water or hull fouling is the only real concern regarding further dispersal of NNS, highlighting the importance of the port to continue adhering to biosecurity guidelines.
A combination of both survey types is the clear approach in terms of providing a detailed analysis of fouling communities as well as offering practical insights to stakeholders regarding port management. It is recommended that the practical applications of survey implementation, particularly in terms of the available expertise and resources, prior to the deployment of survey materials, need to be carefully considered.
Supplementary material
The supplementary material for this article can be found at https://doi.org/10.1017/S0025315420001150
Acknowledgements
We acknowledge the technical contributions made by Phil Hopkins in the construction of survey materials and the contributions of Associated British Ports in granting access to the Port of Swansea and in facilitating and assisting field surveys. Reviewers are kindly thanked for the valuable contributions made in improving the manuscript.
Financial support
This research was financially supported by the Knowledge Economy Skills Scholarships (KESS 2) which is part funded by the European Social Fund (ESF) via the Welsh Government.