Early agriculture and plant domestication is well attested in two regions of China: foxtail millet (Setaria italica) and broomcorn millet (Panicum miliaceum) along the Yellow River from at least 8000 cal BP (Zhao Reference Zhao2004, Reference Zhao2014; Bettinger et al. Reference Bettinger, Barton and Morgan2010), and rice (Oryza sativa) along the middle and lower reaches of the Yangtze River between c. 8000–6000 cal BP (Fuller et al. Reference Fuller, Qin, Zheng, Zhao, Chen, Hosoya and Sun2009; Fuller Reference Fuller2011; Deng et al. Reference Deng, Ling, Hua, Welsskopi, Zhang and Fuller2015). The dates of early agriculture based on cereal cultivation vary depending in part upon the lines of evidence relied upon (cf. Fuller et al. Reference Fuller, Harvey and Qin2007; Liu et al. Reference Liu, Lee, Jiang and Zhang2007). A third region of early agriculture has been proposed along the Pearl River in southern China, primarily comprising the present-day provinces of Guangdong and Guangxi (Zhao Reference Zhao2006, Reference Zhao2011; see also Li Reference Li1970). In contrast to the other two regions, the southern centre is reportedly based on the vegetative propagation and cultivation of sub/tropical plants—including underground stem/rhizome (e.g. lotus root, Nelumbo nucifera), corms (e.g. taro, Colocasia esculenta), tubers (e.g. yams, Dioscorea spp.), bananas (Musa spp.) and palms (e.g. fishtail palm, Caryota sp.). These vegecultural practices pre-date the southward expansion of rice cultivation to the region around c. 5000–4700 cal BP (Guedes et al. Reference Guedes, Jian, He, Wu and Jiang2013; Yang et al. Reference Yang, Wang, Zhuang, Li, Ma, Ma, Cui, Wei and Fuller2016).
Here, we compare archaeobotanical evidence for the putative third centre of early agriculture in southern China against a range of human-plant domesticatory relationships, before discussing problems with the investigation of early plant exploitation, cultivation and domestication in the wet tropics and subtropics. These reflections identify the need to reinvigorate the study of archaeological parenchyma, in concert with starch and phytolith analyses, within tropical archaeobotany. Archaeological parenchyma refers to poorly differentiated plant tissues, most commonly associated with roots and tubers, which are preserved at archaeological sites in charred, desiccated or waterlogged form (Hather Reference Hather2000).
Human-plant domesticatory relationships
The character of human-plant domesticatory relationships can be exemplified through a range of plant-exploitation practices including gathering, management, intensification and cultivation (Harris Reference Harris1990, Reference Harris2007). Early scenarios can be envisaged in which people exploited plants through the gathering of bark, buds, fruits, leaves, nuts, roots, sago, seeds, tubers and many other plant parts. These scenarios are typified by limited direct selective pressure, except through the potential reduction in populations through preferential gathering.
Increased intensity of human management, primarily through intervening in the promotion of growth conditions for plants, occurs as a result of tending, weeding, periodic pruning and burning to encourage new growth, and the clearance of vegetation around stands of favoured plants. These scenarios involve increased levels of human intervention in plant life cycles, with attendant human-directed selection of favoured phenotypic traits among managed plants. The basis of phenotypic selection can be characterised in various ways—for example, cultural, ecological or energetic. In general terms, species or specific phenotypes may be selected for: ease of growth; hardiness and resistance to stress (whether disease- pest- or environmentally induced); productivity (including nutritional yield, synchronicity of yield and inter-annual reliability of production); ease of processing (such as hard seed coat or nut casing, extraction of edible portion, spininess, toxicity, acridity); ease of cooking (e.g. pounding, soaking, heating, roasting); as well as, colour, taste and palatability, texture or other criteria.
These types of human-plant relationship occur in a broad range of lifeways, from those of ‘hunter-gatherers’ through to those of ‘farming’; they all exert varying degrees of selective pressure on exploited plants. The degrees to which these phenotypic preferences become more frequent within a population, as well as the degrees to which genetic markers of preferential selection become fixed, reflect numerous factors including the persistence of human practices (usually, continuity in directed selection) and the degree of inter-breeding with populations not subject to the same degree of selective pressure (commonly, the extent of genetic isolation) (Larson et al. Reference Larson, Piperno, Allaby, Purugganan, Andersson, Arroyo-Kalin, Barton, Climer Vigueira, Denham, Dobney, Doust, Gepts, Gilbert, Gremillion, Lucas, Lukens, Marshall, Olsen, Pires, Richerson, Rubio de Casas, Sanjur, Thomas and Fuller2014).
Generally, there is a lack of research on food plants that may have been managed in the ways described above. An interesting example concerns murnong or yam daisy (Microseris scapigera; Gott Reference Gott1983), intensively used by Aboriginal peoples in south-east Australia. Early historical accounts suggest that Aboriginal land-management practices increased the extent and density of murnong across the landscape (namely, resource intensification), and potentially led to the creation of ecotypes due to the expansion of plants into new landscapes within the human niche. The creation of new phenotypes and genotypes as a result of extensive resource intensification was probably common in the past, and yet the character of these domesticatory relationships is often excluded from standard discussions of ‘domestication’ because they result from practices by people regarded as ‘hunter-gatherers’.
A stepped change in human-directed selection occurs with planting and transplanting. Many plants exhibit two modes of reproduction—sexual and asexual. People have exploited and domesticated plants using both forms of biological reproduction, and in doing so have affected the ways in which plants exhibit domestication traits (Ladizinsky Reference Ladizinsky1998).
Sexual reproduction in plants has been exploited by people through the harvesting, storage and planting of seeds from favoured species and phenotypes. Domestication based on sexual reproduction is commonly associated with annuals, especially cereal and legume cultivation, but also extends to a whole range of plant groups, from herbaceous plants to trees. Early cultivation, leading to domestication based on sexual reproduction, has been claimed for cereals and legumes including barley (Hordeum vulgare), wheat (Triticum spp.), peas (Pisum sativum) and lentils (Lens culinaris) in South-west Asia; millets and rice in China; sorghum (Sorghum bicolor) and pearl millet (Pennisetum glaucum) in Africa; and maize (Zea mays) and squash (Cucurbita spp.) in the Americas (Fuller et al. Reference Fuller, Denham, Arroyo-Kalin, Lucas, Stevens, Qin, Allaby and Purugganan2014).
Early forms of agriculture and domestication have also been based on the asexual reproduction of plants. Globally significant crop plants that have been domesticated via vegetative propagation include: bananas, sago (Metroxylon sagu), sugarcane (Saccharum officinarum), taro and yams from the Indo-Pacific region; as well as manioc (Manihot esculenta), potato (Solanum tuberosum) and sweet potato (Ipomoea batatas) from South America. There are also numerous regionally important plants—such as Enset (Ensete ventricosum) and yam (Dioscorea cayenensis) in Ethiopia (Hildebrand Reference Hildbebrand2007). People may vegetatively propagate plants even when they know that the plants can reproduce from seed. In other cases, prolonged clonal reproduction may have led to the loss of sexual reproductive capacity, as in the case of marita pandanus (Pandanus conoideus) in New Guinea. Vegetative propagation tends to predominate in cultivation practices within the wet tropics and subtropics (Denham et al. Reference Denham, Iriarte and Vrydaghs2007).
Early forms of cultivation, much like current agricultural practices, vary in their reliance upon sexual and asexual reproduction. Early cultivation in northern and central China focused on millets (foxtail and broomcorn) and rice, respectively; while the putative southern Chinese domestication centre focused on a range of herbs, palms and root crops. Although sexual and asexual modes of cultivation and domestication are usually discussed separately, they probably co-existed in most regions in the past.
The archaeobotanical evidence
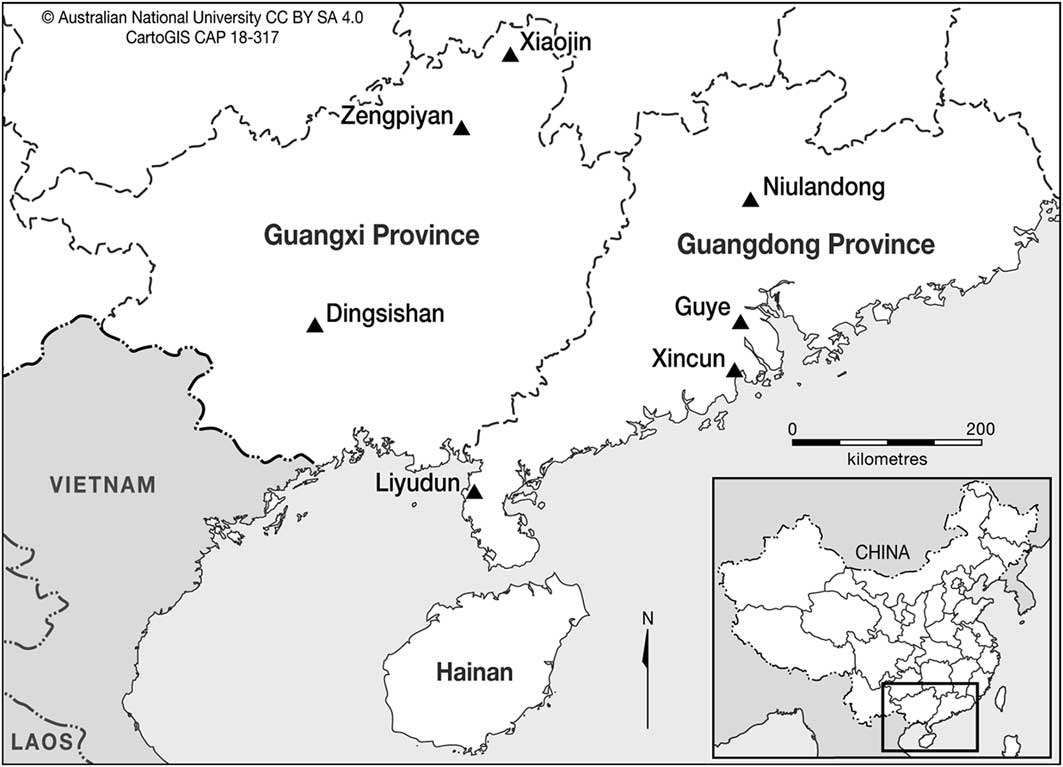
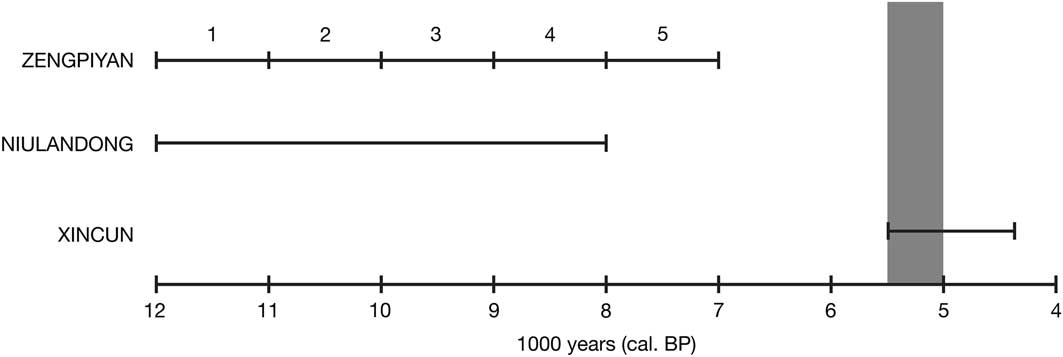
Three sites provide archaeobotanical evidence that is most relevant to early vegetative-based plant exploitation in southern China: Zengpiyan, Niulandong and Xincun (Figures 1–2). Each site has yielded archaeobotanical remains of vegetatively propagated plants that pre-date c. 4500 cal BP: macroremains, phytoliths and starch at Zengpiyan (Institute of Archaeology 2003); starch at Niulandong (Wan Reference Wan2012); and phytoliths and starch at Xincun (Yang et al. Reference Yang, Barton, Wan, Li, Ma, Li, Zhang and Wei2013).
Map of the archaeological sites here discussed in southern China.

Timeline depicting key sites with archaeobotanical evidence of vegetatively propagated plants: Zengpiyan (with occupation zones marked), Niulandong and Xincun. The grey zone represents the approximate date for the introduction of rice cultivation to southern China.

Zengpiyan is a cave in northern Guangxi Province that was excavated in the 1970s and again in 2001. The later excavations were designed for systematic archaeobotanical recovery from the cave deposits that were left intact during the previous excavations (Zhao Reference Zhao2011). The chronology of occupation extends from c. 12 000 cal BP to c. 7000 cal BP (Institute of Archaeology 2003: 433–45; Zhao Reference Zhao2011). No archaeobotanical materials were recovered during the original excavations, whereas re-excavation yielded a variety of charred plant remains including “wood, seeds, nuts, roots, and tubers” (Table 1; Institute of Archaeology 2003: 286–93; Zhao Reference Zhao2011: S303). The charred tuber or root remains from Zengpiyan were not identified to species or genus level.
Summary of archaeobotanical findings from the re-excavation of Zengpiyan in 2001 (Institute of Archaeology 2003: 287).

Starch residue analysis was conducted on 25 artefacts. Starch from a subterranean storage organ—such as a root, tuber or corm—was found on the used edges of five artefacts, representing each phase of occupation: a pointed lithic artefact (phase 1), a bone artefact (phase 2), a perforated shell artefact (phase 3), a lithic flake (phase 4) and a lithic chopper/masher (phase 5) (Lu Reference Lu2003: 646–51). Based on a published image (Institute of Archaeology 2003: pl. 72, panel 3), the starch granules broadly conform to taro in terms of size (1–8μm), shape (spherical) and the clustering of grains into sheets (Fullagar et al. Reference Fullagar, Field, Denham and Lentfer2006). The identification of taro from starch granules is problematic, however, because it is easily confused with metabolic starch or other species (Crowther Reference Crowther2005).
Taken together, the macrobotanical and starch granule evidence from Zengpiyan is consistent with the exploitation of rhizomes, tubers and corms during the Early Holocene. The remains are, however, sparse. Similar archaeobotanical evidence has been forthcoming from Pleistocene and Early Holocene hunter-gatherer sites across the tropics of Southeast Asia (Barton & Paz Reference Barton and Paz2007), Island Melanesia (Loy et al. Reference Loy, Spriggs and Wickler1992; Barton & White Reference Barton and White1993) and New Guinea (Summerhayes et al. Reference Summerhayes, Leavesley, Fairbairn, Mandui, Field, Ford and Fullagar2010), and there is nothing in the evidence to suggest the cultivation of these plants.
Niulandong Cave is located in Guangdong Province. The site was occupied around 12 000 cal BP to 8000 cal BP (Wan Reference Wan2012). Starch residue analysis undertaken on the used and unused parts of eight stone artefacts, consisting of discoid (plate-like) artefacts and pestles, suggest that they were probably employed for plant processing (Jin et al. Reference Jin, Zhang, Ou, Yu, Kuang, Yi, Wu, Chen and Mo1998; Liu Reference Liu2003; Wan Reference Wan2012). In total, 109 starch granules were extracted and identified: 21 cycads (Cycadaceae), nine unidentified rhizomes, three Zingiberaceae (ginger), 34 panicoid grasses (Panicoideae) and 42 unidentified (Wan Reference Wan2012). Although starch granule analysis for the artefacts at Niulandong indicates the exploitation of rhizomes together with other types of plant during the Early Holocene, such activities are consistent with the broad spectrum exploitation of wild plants.
Xincun is an open-air site on the coast of Guangdong Province. The site was occupied from c. 5500 cal BP to c. 4400 cal BP (Yang et al. Reference Yang, Barton, Wan, Li, Ma, Li, Zhang and Wei2013). Residues were extracted from eight artefacts for starch analysis, and from four artefacts for phytolith analysis. Numerous economically useful plants were identified among the 454 starch granules, including 78 from fishtail palm, 17 from banana and 48 from several freshwater roots and tubers. The last group of plants comprised 29 water chestnut (cf. Eleocharis dulcis), 17 Chinese arrowhead (Sagittaria sp.) and two lotus root. Of 1950 identified phytoliths, 56 per cent derive from palms (Aracaceae).
The archaeobotanical residues from 12 artefacts at Xincun indicate exploitation of palms, bananas and various roots and tubers (Yang et al. Reference Yang, Barton, Wan, Li, Ma, Li, Zhang and Wei2013). Although many of these plants are still eaten in southern China today and often propagated vegetatively, these findings solely indicate that people were exploiting certain kinds of starch-rich plant. These types of evidence, indicating the exploitation of vegetatively propagated plants prior to the advent of millet and rice cultivation, are now emerging with the application of more comprehensive archaeobotanical sampling strategies at archaeological sites across Southeast Asia (e.g. Oliveira Reference Oliveira2012; Castillo et al. Reference Castillo, Fuller, Piper, Bellwood and Oxenham2017).
Palaeopathology and material culture also have been used to infer early agriculture in this region, but these lines of evidence are highly inferential, and not necessarily linked to vegetatively reproducing plants. For instance, the incidence of dental caries in Early Holocene burials at Zengpiyan (Institute of Archaeology 2003: 420–21) and at Liyudun (Chen & Li Reference Chen and Li2013) is considered to reflect agricultural populations subsisting on tuber and root crops. Such inferences are problematic in the absence of abundant archaeobotanical evidence and especially since stable isotope analysis at Liyudun suggests a maritime diet. Similarly, there has been a tendency to assume some form of cultivation existed in this region prior to the advent of domesticated rice from c. 5000–4700 cal BP (Zhao Reference Zhao2011). This assumption has persisted despite the lack of relevant archaeobotanical evidence from Dingsishan (Zhao et al. Reference Zhao, Lu and Fu2005; Chen Reference Chen2011), Guye (Wang Reference Wang2007) and Xiaojin (He et al. Reference He, Peng, Liu, Ning, Jiang, Peng, Liang, Yang, Chen, Fu and Dang2004; Chen Reference Chen2011).
Exploitation of vegetatively reproducing plants
Numerous researchers have suggested that early modern humans had a predisposition to the exploitation of vegetatively reproducing plants (Sauer Reference Sauer1952; Li Reference Li1970; Barton & Denham Reference Barton and Denham2017). A disposition to these particular plant resources appears to be more marked in the wet tropics and subtropics than elsewhere (Harris Reference Harris1972; Yen Reference Yen1990; Piperno & Pearsall Reference Piperno and Pearsall1998; Denham et al. Reference Denham, Haberle, Lentfer, Fullagar, Field, Therin, Porch and Winsborough2003; Clement et al. Reference Clement, de Cristo-Araújo, D’Eeckenbrugge, Pereira and Picanço-Rodridgues2010; Barton & Denham Reference Barton and Denham2011; Denham Reference Denham2013). This reflects, in part, the prevalence of vegetatively reproducing plants in less seasonal climates and the greater caloric yield from sago palms, roots, tubers and rhizomes in comparison to grass seeds in wet tropical rainforests (Denham & Barton Reference Denham and Barton2006). The clonal exploitation of plants is, however, likely to have been part of plant exploitation and cultivation strategies in most regions of the world.
An early predisposition to the exploitation of roots and tubers is evident across the wet tropics of Island Southeast Asia (e.g. Niah Cave on Borneo; Barton & Paz Reference Barton and Paz2007), Island Melanesia (e.g. Kilu Cave in the Solomon Islands; Loy et al. Reference Loy, Spriggs and Wickler1992) and New Guinea (e.g. Ivane Valley; Summerhayes et al. Reference Summerhayes, Leavesley, Fairbairn, Mandui, Field, Ford and Fullagar2010) (see reviews in Barton & Denham Reference Barton and Denham2011; Blench Reference Blench2013). The archaeobotanical records from the Early Holocene at Zengpiyan and Niulandong conform to this pattern of broad spectrum plant exploitation, including subterranean storage organs. A key aspect of these exploitation strategies probably included the active management and intensification of plant resources in the landscape, potentially aided by replanting and translocation (Barton & Denham Reference Barton and Denham2011, Reference Barton and Denham2017)—as also witnessed in the tropical rainforests of Northern Australia (Hynes & Chase Reference Hynes and Chase1982; Denham Reference Denham2008). Over time, people increasingly locked on to specific oil-, protein- and starch-rich plants, and became more reliant on them for their diet, while simultaneously increasing the density of favoured species in the landscape (Denham & Barton Reference Denham and Barton2006; Denham et al. Reference Denham, Fullagar and Head2009a). These types of practice conform to the archaeobotanical record from Xincun, where favoured species were targeted from at least 5500–4400 cal BP, with several food plants still being important in the region today.
Based on current evidence, the archaeobotanical record from southern China does not suggest nascent cultivation or domestication prior to the adoption of rice from c. 5000–4700 cal BP. The evidence conforms well to similar records of plant exploitation from wet tropical and subtropical environments across Southeast Asia and Melanesia. Cultivation of vegetatively propagated crops could have occurred in southern China before the adoption of rice, but as yet there is no evidence to substantiate such a claim.
Taking a broader view
Forms of plant exploitation, cultivation and domestication based on the sexual and asexual reproductive capacity of plants, respectively, require different archaeobotanical methods for their investigation. Macrobotanical remains of fruit stones, nutshells and seeds often preserve well in charred form at archaeological sites. Changes in shattering vs non-shattering percentages and grain size for seeds can be recorded as indicators of domestication status (Fuller et al. Reference Fuller, Denham, Arroyo-Kalin, Lucas, Stevens, Qin, Allaby and Purugganan2014), as well as of the dependence of people on cultivated plants (Smith Reference Smith2001; Harris Reference Harris2007). By contrast, several key staples under cultivation in the wet tropics and subtropics do not yield hardier archaeobotanical remains that readily preserve in archaeological contexts.
Many vegetatively propagated root crops such as manioc, sweet potato, taro and yams, as well as other crops such as sugarcane, are usually harvested prior to seed-set. The exploitation, cultivation and domestication of these crops in the wet tropics and subtropics has a lower archaeobotanical visibility and requires a different suite of methods, such as that employed for the New Guinea highlands (Denham et al. Reference Denham, Haberle, Lentfer, Fullagar, Field, Therin, Porch and Winsborough2003, Reference Denham, Haberle and Pierret2009b). A mixed-method approach for the investigation of tropical plant exploitation comprises macrobotany (Pearsall Reference Pearsall2000), the identification of parenchyma (Hather Reference Hather2000), phytolith analysis (Piperno Reference Piperno2006) and starch granule analysis (Hather Reference Hather1994; Torrence & Barton Reference Torrence and Barton2006). Of these, the archaeobotanical analysis of parenchymatous tissues is the least widely adopted, yet may have the greatest potential.
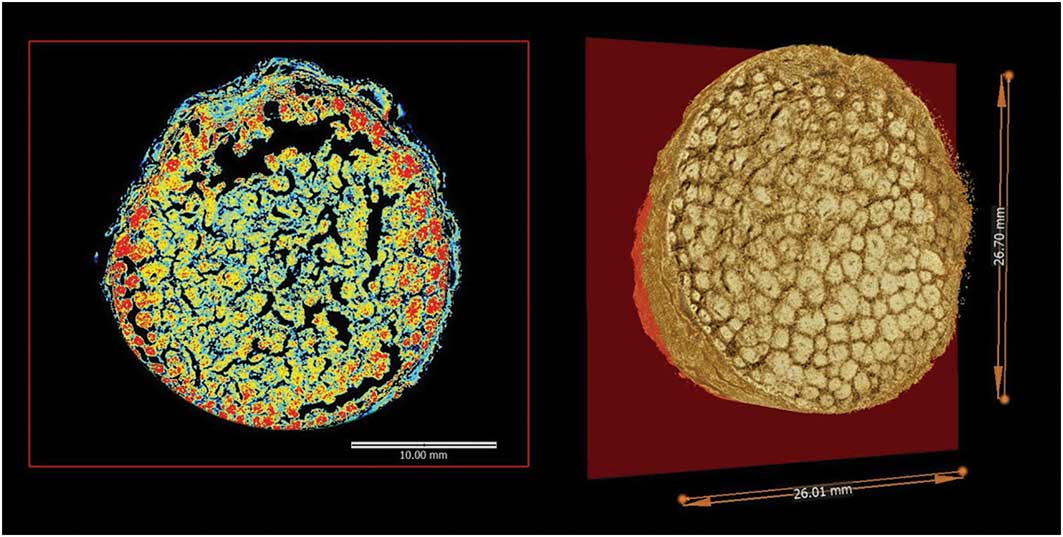
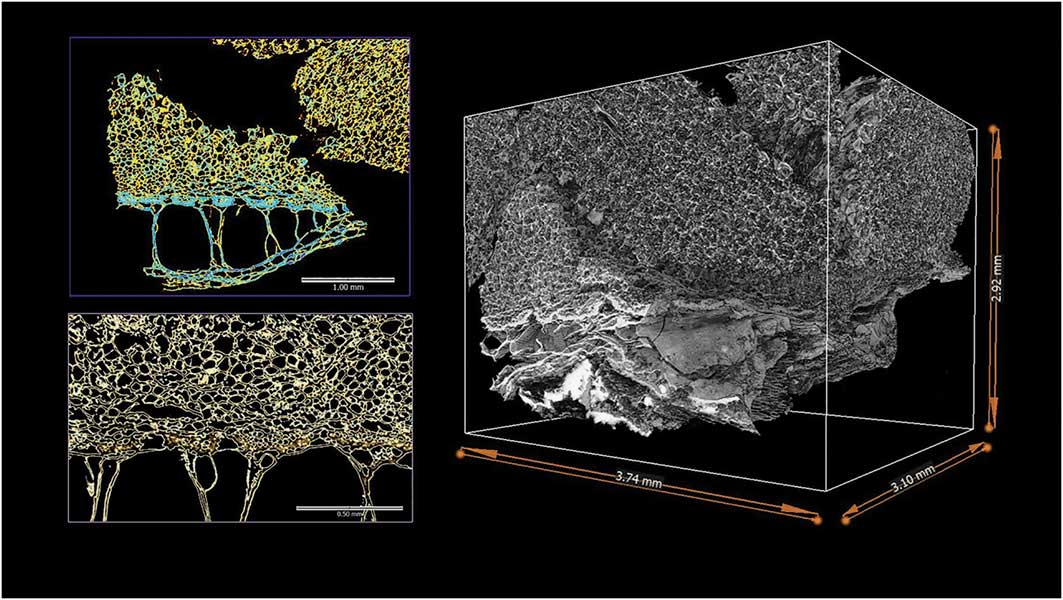
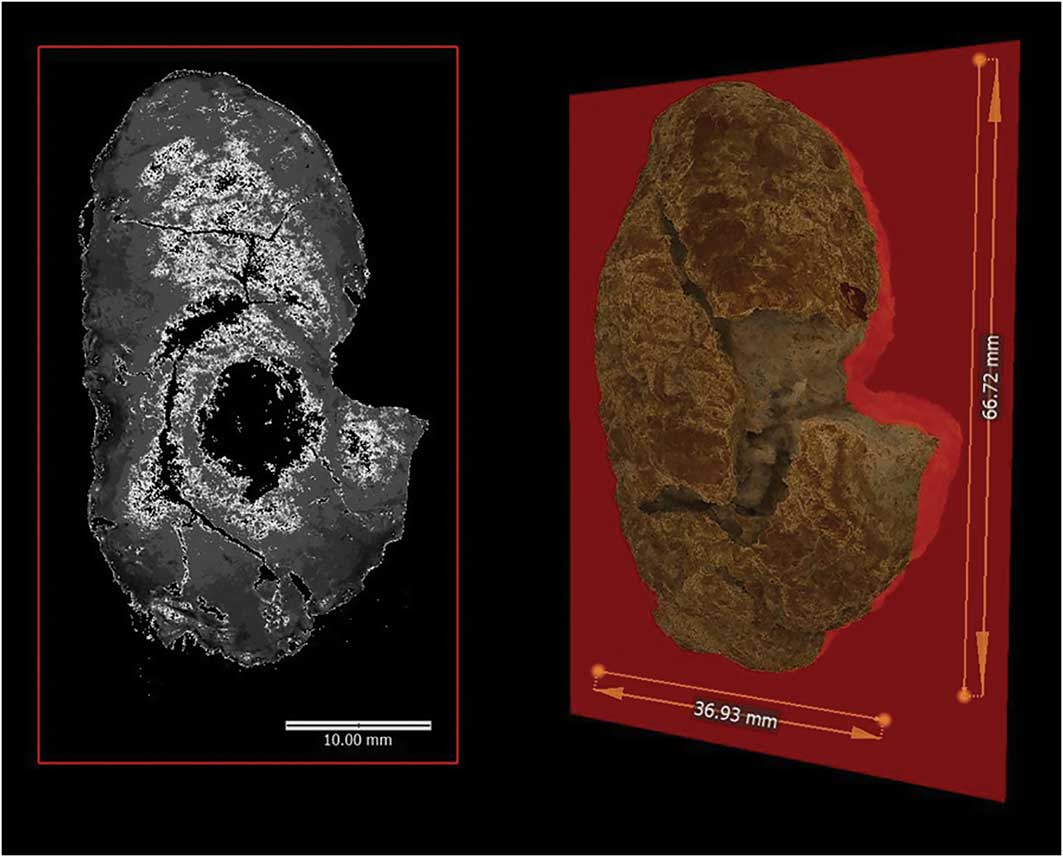
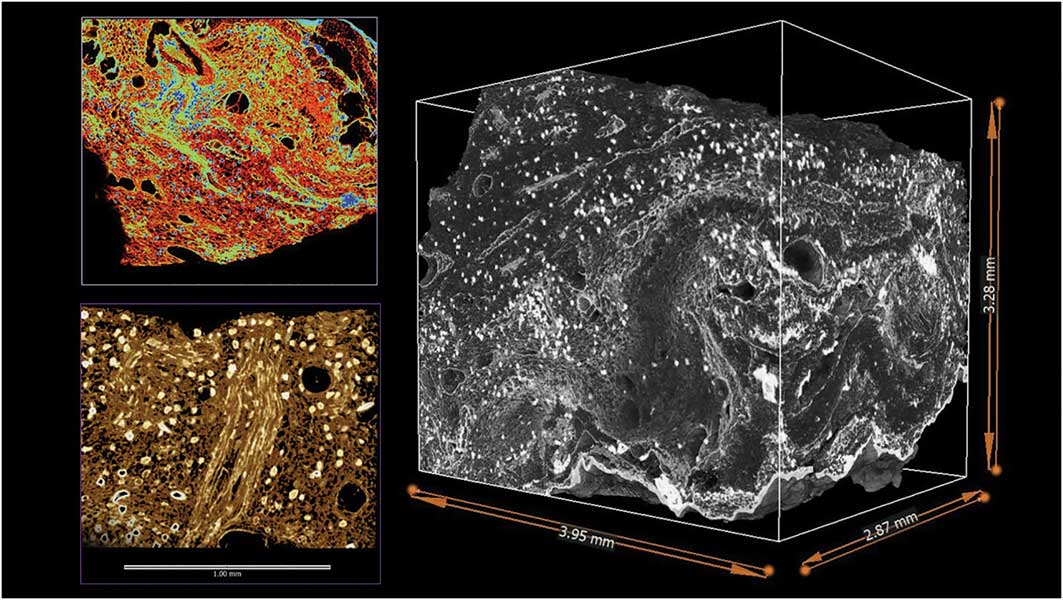
Archaeological parenchyma usually preserves at archaeological sites in charred or desiccated form (e.g. Ugent et al. Reference Ugent, Pozorski and Pozorski1981; Hather & Kirch Reference Hather and Kirch1991). For the wet tropics, the analysis of archaeological parenchyma was a major breakthrough in the investigation of the domestication and cultivation of vegetatively propagated crops (Hather Reference Hather1994, Reference Hather2000). Even allowing for the phenotypic plasticity in many plant parts, especially underground storage organs, the analysis of archaeological parenchyma enables the taxonomic identification of plants under cultivation, and potentially provides a gauge of domestication status (Figures 3–6). Currently, the technique is underused, with a lack of expertise and accessible reference collections. Despite these limitations, the analysis of archaeological parenchyma, in conjunction with starch and phytolith analyses, has the potential to address a range of questions concerning plant exploitation across a vast region from southern China to Northern Australia, including:
∙ Did people engage in the cultivation and domestication of vegetatively propagated crops in southern China prior to the advent of cereal cultivation c. 5000–4700 cal BP?
∙ Did people engage in vegetative forms of agriculture in parts of Island Southeast Asia prior to the dispersal of rice, or other cultural traits, from East Asia from c. 4000 cal BP? (Previous studies of plant use in the region, including of archaeological parenchyma (Paz Reference Paz2001; Barton & Paz Reference Barton and Paz2007; Oliveira Reference Oliveira2012), are limited, yet they suggest continuity in vegetative exploitation practices in Island Southeast Asia up until the more recent past (Denham Reference Denham2013).)
∙ Although the wetland archaeological evidence for cultivation practices is well attested for multiple sites in the highlands of Papua New Guinea (Golson et al. Reference Golson, Denham, Hughes, Swadling and Muke2017), to what extent were people dependent upon cultivated foods for their subsistence?
∙ Did people in Northern Australia engage in nascent forms of cultivation during the Holocene (Jones & Meehan Reference Jones and Meehan1989; Denham et al. Reference Denham, Donohue and Booth2009c)?
Visualisations of a charred greater yam (Dioscorea alata) tuber (Hather modern reference specimen #115) using microCT (Varslot et al. Reference Varslot, Kingston, Myers and Sheppard2011; Limaye Reference Limaye2012) at a resolution of 22.7µm. Left-hand image depicts a 2D virtual cross-section through the whole tuber, rendered using colour spectrum with higher-density tissues in blue and lower-density tissues in red. Right-hand image depicts a rendered 3D visualisation through the whole tuber.

Visualisations of a 5mm subsample of the charred greater yam tuber (Hather modern reference specimen #115) using microCT at a resolution of 3.9µm. Right-hand image depicts a 3D visualisation of internal parenchyma cells and epidermal surface. Upper-left image shows a close-up of vascular bundles and parenchyma cell structures rendered using the colour spectrum and showing higher-density tissues in blue, and lower-density tissues in yellow. Lower-left image depicts a high-resolution close-up of vascular bundles, showing the arrangement of vascular cells within bundles.

Visualisations of a charred taro corm (Hather modern reference specimen #21) using microCT (Varslot et al. Reference Varslot, Kingston, Myers and Sheppard2011; Limaye Reference Limaye2012) at a resolution of 22.0µm. Left-hand image depicts a 2D virtual cross-section through the whole corm, with higher-density tissues in black, and lower-density tissues in white. Right-hand image depicts a rendered 3D visualisation of whole corm.

Visualisation of a 5mm subsample of the charred taro corm (Hather modern reference specimen #21) using microCT at a resolution of 3.9µm. Right-hand image is a 3D visualisation exhibiting internal arrangements of parenchyma cells and the distribution of calcium oxalate crystals in white. Upper-left image shows a close-up of parenchyma cell structures, with higher-density tissues in blue, and lower-density tissues in red. Lower-left image depicts a high-resolution close-up of vascular tissues running vertically through the middle of the image, the arrangement of parenchyma cells and the distribution of calcium oxalate crystals.

The archaeobotanical records from southern China need to be considered in broader regional and global contexts. Currently, the evidence for early agriculture based on vegetative propagation in southern China is consistent with records of hunter-gatherer exploitation across Southeast Asia, Melanesia and Northern Australia. For southern China, there is a disproportionate reliance on small samples of plant residues on artefacts from three sites. The continued investigation of plant exploitation and any early cultivation based on vegetatively propagated plants in the region requires the systematic application of a suite of archaeobotanical techniques that have been successfully applied to the investigation of early cultivation and plant domestication in other subtropical and tropical regions.
Acknowledgements
The authors wish to thank two anonymous reviewers, as well as Dorian Fuller and Huw Barton, for their comments that have greatly improved the manuscript. The research was funded by an Australian Research Council Future Fellowship (FT150100420) to T.D.