I. INTRODUCTION
Photovoltaics (PVs) have evolved over the past several decades to become a truly global renewable technology. Reference Kerr1–3 Since 1995 the annual growth rate of deployed solar power capacity has averaged 43% and as of writing over 230 GWp of installed capacity exists worldwide. 4,5 To build upon this trend, and benefit further from large-scale PV deployment, continued investment, research and development is required such that newer materials and manufacturing processes can be commercialized. Reference Polman, Knight, Garnett, Ehrler and Sinke6 As with many technologies, the goal for PV is to realize systems that offer high performance at intrinsically low cost. Importantly, the solar cells and solar modules of the future will be developed not only for traditional forms of power generation, such as farms and rooftop installations, but also for a wider range of innovative applications than is currently realized. Specifically, examples where direct PV module incorporation is desired include building integrated PV, portable PV, and PV interfaced with flexible electronics. Recent breakthroughs have brought these opportunities much closer to reality, and as a consequence contemporary PVs R&D describes a vibrant and highly dynamic activity.
The purpose of this review is to highlight recent advances in one area of PV research, namely, the knowledge gained through in situ measurements that relate the optoelectronic properties of a device to the composition and crystal structure of the semiconductor layer. Reference Pearson, Wang and Lidzey7 Structure–property relationships often provide the basis for realizing improvements in technology performance as they allow researchers to relate physical processes to key lengthscales within a material or to construct a framework for the targeted design of improved materials and processes. These results are discussed in the context of developments in equipment capability and measurement resolution, as these have provided further opportunities for advancement by identifying phenomena that were previously unknown or poorly understood. Emerging PVs based on two topical semiconductor classes—perovskites and organics—will form the main discussion sections as they have both seen significant improvements in efficiency over the past decade, Reference Li, Zhu and Yang8,Reference Green, Ho-Baillie and Snaith9 in addition to offering rapid repayment times for cost and embedded energy. Reference Darling and You10,Reference Gong, Darling and You11 Indeed, for perovskite PVs at the laboratory stage of development, initial power conversion efficiencies (PCEs) that are comparable to multicrystalline Si, CdTe, and CIGS have now been reached. 12 As with any promising emerging technology, however, inevitable hurdles exist on the path toward commercialization and widespread adoption. Discussing these challenges, as well as the ability of in situ and in operando measurements to overcome them, will form the final part of this review.
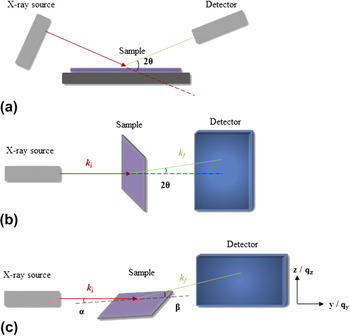
For readers who are unfamiliar with scattering techniques, Fig. 1 illustrates schematically the general setups for X-ray diffraction (XRD) and X-ray scattering experiments as these will be referred to repeatedly throughout this article.
Reference Müller-Buschbaum13,Reference Chen, Nikiforov and Darling14
In an XRD measurement [part (a)], the X-ray source and detector can each be rotated around a fixed sample by an angle θ, the so-called Bragg–Brentano configuration. The angle between the source and detector is thus 2θ, and X-rays diffracted by the sample are measured as a function of this parameter. In part (b), the generic setup for a transmission X-ray scattering measurement is presented. Here, X-rays with initial wavevector k
i pass through the sample and elastically scattered X-rays (with wavevector k
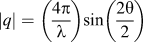
f) are measured using a two-dimensional detector. Convention dictates that a small angle X-ray scattering (SAXS) experiment measures scattering at 2θ values below ∼5° and wide-angle X-ray scattering (WAXS) experiments measure above this. If the sample is instead positioned at a shallow angle α to the incident X-ray beam, generally between 0.1 and 0.5°, the scattering experiment is now performed in a grazing-incidence geometry [part (c)], GISAXS or GIWAXS. Data obtained from these experiments are often presented in terms of the scattering vector q = k
f − k
i, which can be readily described in terms of 2θ by the expression
 $\left| q \right| = \left( {{{4\pi } \over \lambda }} \right)\!\sin \left( {{{2\theta } \over 2}} \right)$
, where λ is the X-ray wavelength.
Overview of the primary sample characterization methods discussed in this work. (a) XRD, (b) X-ray scattering, (c) grazing-incidence X-ray scattering.

II. KINETICS AND MECHANISMS OF HYBRID PEROVSKITE FILM FORMATION AND TRANSFORMATION
Organic–inorganic metal halide (hybrid) perovskites have attracted widespread attention for PVs because of their exceptional photophysical properties. Reference Green, Ho-Baillie and Snaith9,Reference Pazos-Outon, Szumilo, Lamboll, Richter, Crespo-Quesada, Abdi-Jalebi, Beeson, Vrućinić, Alsari, Snaith, Ehrler, Friend and Deschler15–Reference Zhu, Miyata, Fu, Wang, Joshi, Niesner, Williams, Jin and Zhu18 The scientific and technological value of this family of semiconductors is further enhanced by the relative ease of structural and chemical tunability, Reference Zhang, Eperon and Snaith19–Reference Stoumpos and Kanatzidis21 and the ability to obtain respectable performance metrics via a wide range of low-cost processing methods. Reference Deng, Peng, Shao, Xiao, Dong and Huang22–Reference Schmidt, Larsen-Olsen, Carlé, Angmo and Krebs25 Because of these characteristics, the wider field of perovskite optoelectronics is thriving, with notable results also obtained in the development of light-emitting devices. Reference Li, Tan, Di, Lai, Jiang, Lim, Friend and Greenham26–Reference Wang, Cheng, Ge, Zhang, Miao, Zou, Yi, Sun, Cao, Yang, Wei, Guo, Ke, Yu, Jin, Liu, Ding, Di, Yang, Xing, Tian, Jin, Gao, Friend, Wang and Huang29 These extremely encouraging developments have been reviewed extensively elsewhere 30 ; the purpose of this article is to draw attention to studies which have provided quantitative and time-resolved insight into the growth and transformation processes of perovskite semiconductor films.
Given their use in the initial proof-of-concept solar cells, the perovskites (CH3NH3)PbX3 (where X = I, Cl, or Br) arguably represent the workhorse materials of the field. Reference Lee, Teuscher, Miyasaka, Murakami and Snaith31–Reference Kojima, Teshima, Shirai and Miyasaka33 The ability of the ABX3 perovskite crystal structure to tolerate multiple A, B, and X components provides a handle (by means of composition engineering) to fine-tune its semiconductor properties, Reference Stoumpos and Kanatzidis20,Reference Stoumpos and Kanatzidis21,Reference Travis, Glover, Bronstein, Scanlon and Palgrave34 enabling the design of single- and tandem-junction solar cells with optical band-gaps tuned for maximum solar energy harvesting. Reference Saliba, Matsui, Domanski, Seo, Ummadisingu, Zakeeruddin, Correa-Baena, Tress, Abate, Hagfeldt and Gratzel35,Reference Eperon, Leijtens, Bush, Prasanna, Green, Wang, McMeekin, Volonakis, Milot, May, Palmstrom, Slotcavage, Belisle, Patel, Parrott, Sutton, Ma, Moghadam, Conings, Babayigit, Boyen, Bent, Giustino, Herz, Johnston, McGehee and Snaith36 When outstanding device properties are reported, this results from the judicious optimization of high-quality semiconductor films on advanced electrode layers.
To form an organic–inorganic metal halide perovskite film, two or more precursor materials (a minimum of an organic- and a metal-halide) must undergo a conversion process. Because this can take place in the solid, vapor, or solution phase, the in-depth study of perovskite formation is naturally motivated to provide insight into its kinetics and the role played by any intermediate phases. Information gained by such studies is especially valuable for researchers in both academic and industry groups because of the benefits brought by working from reliable and well-understood processing protocols.
A. Vapor deposition
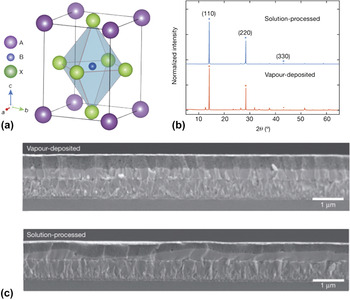
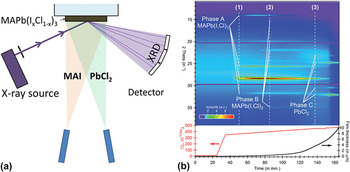
Preparing perovskite solar cells by vapor deposition of the precursors provides a means to realize uniform films over large areas with relative ease (Fig. 2). Having been first demonstrated by Liu et al., who achieved PCEs of up to 15%, Reference Liu, Johnston and Snaith37 the process was monitored in situ using XRD by Pistor et al. Reference Pistor, Borchert, Fränzel, Csuk and Scheer38 In both cases, the perovskite CH3NH3Pb(I x Cl1−x )3 was formed by co-deposition of CH3NH3I and PbCl2, with the halide stoichiometry controlled by the relative flux of each precursor. For low PbCl2 fluxes (corresponding to a source temperature below c. 450 °C), an optically dense film can be produced, with an optical band gap E g (∼1.6 eV) and lattice parameter a (6.288 Å) that are close to thin films of the pure triiodide perovskite. Reference Stoumpos, Malliakas and Kanatzidis39–Reference Kawamura, Mashiyama and Hasebe41 Whereas crystals of CH3NH3PbI3 exhibit tetragonal symmetry at room temperature, the deposited CH3NH3Pb(I x Cl1−x )3 films were found to exhibit cubic symmetry; a characteristic that was suggested to result from the presence of Cl that reduces the cubic-tetragonal phase transition temperature and stabilizes the cubic phase under ambient conditions. Reference Wang, Lyu, Zhang, Yun, Chen and Wang42 Increasing the PbCl2 deposition rate predictably increases the concentration of Cl in the deposited film, as data in Fig. 3 show. Crucially this process does not allow for a continuous tuning of the halide ratio in the perovskite, in contrast to I–Br mixed-halide systems. Reference Noh, Im, Heo, Mandal and Seok43 Instead, a miscibility gap exists—estimated between 0.95 > x > 0.5 based on XRD data alone—which may be explained by the relatively large difference in ionic radii between I and Cl. Postdeposition thermal annealing permits recrystallization of the perovskite, including an enhancement of crystallite orientation that is initially defined by the deposition step. Such findings open up the possibility to fabricate solar cells with efficiencies beyond what can be achieved by vapor deposition alone. Reference Lee, Teuscher, Miyasaka, Murakami and Snaith31 At sample temperatures above 200 °C, degradation of the perovskite into products including PbI2 was determined. Importantly this experiment did not focus on the effects of isothermal annealing; indeed heat-induced degradation at lower temperatures is often observed and will be discussed later in this review.
(a) Schematic crystal structure of an ABX3 perovskite, where the A cation surrounds X anions in corner-sharing BX octohedra. Parts (b) and (c) show XRD and scanning electron microscopy data for CH3NH3Pb(I x Cl1−x )3, respectively, highlighting the differences in film uniformity between vapor- and solution-processing routes. Reprinted with permission from Ref. Reference Liu, Johnston and Snaith37. Copyright 2013 Nature Publishing Group.

Schematic setup [part (a)] and in situ XRD data [part (b)] for CH3NH3Pb(I x Cl1−x )3 (MAPb(I,Cl)3) perovskite during a temperature ramp of the PbCl2 source. At relatively high PbCl2 fluxes, a chlorine-rich perovskite phase (Phase B) preferentially forms over an iodine-rich perovskite (Phase A). Reprinted with permission from Ref. Reference Pistor, Borchert, Fränzel, Csuk and Scheer38. Copyright 2014 American Chemical Society.

B. Solution deposition
The observed miscibility gap between iodine- and chlorine-rich perovskites strongly supports the large body of the literature on solution-processed CH3NH3Pb(I x Cl1−x )3. Although Cl inclusion has been shown to impart favorable optoelectronic properties to the semiconductor, Reference Chen, Zhou, Fang, Stieg, Song, Wang, Xu, Liu, Lu, You, Sun, McKay, Goorsky and Yang44,Reference Stranks, Eperon, Grancini, Menelaou, Alcocer, Leijtens, Herz, Petrozza and Snaith45 initial studies generated a level of surprise amongst the research community because of the large difference in halide stoichiometries between the precursors and the final films, leading to sometimes inconsistent reports on the precise amount of Cl in the latter. Reference Colella, Mosconi, Pellegrino, Alberti, Guerra, Masi, Listorti, Rizzo, Condorelli, De Angelis and Gigli46–Reference Yu, Wang, Xie, Li, Chen and Zhao48 Compared to vapor deposition methods, wet processing adds additional complexity through the dynamics of film formation and the compositions and thermal histories of any solutions used. If not controlled, these factors can increase the likelihood of local inhomogeneities and voids in the prepared semiconductor film that may impact negatively on optoelectronic performance.
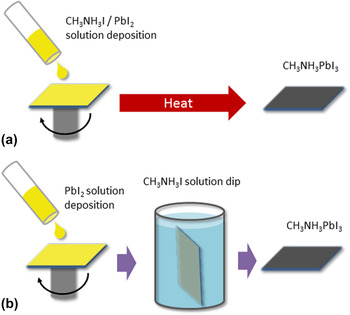
Common routes for solution-processed perovskite films include the deposition of a mixed precursor ink followed by a thermal anneal Reference Lee, Teuscher, Miyasaka, Murakami and Snaith31 and the sequential deposition of the metal- and organic-halides Reference Burschka, Pellet, Moon, Humphry-Baker, Gao, Nazeeruddin and Grätzel32 (Fig. 4 shows the example case of CH3NH3PbI3). These are routinely referred to as “one-step” and “two-step” processing methods, respectively, in the perovskite PV literature and are considered in turn in this review.
Comparison of one-step [part (a)] and two-step [part (b)] methods for the preparation of a perovskite thin film.

C. “One-step” processing
Initial studies on solution processed CH3NH3Pb(I x Cl1−x )3 described the use of a precursor ink containing CH3NH3I and PbCl2 dissolved at a 3:1 molar ratio in dimethylformamide (DMF) when preparing efficient PV cells. Reference Lee, Teuscher, Miyasaka, Murakami and Snaith31 In itself the solution deposition step, when performed at ambient temperature, does not drive the complete conversion of the precursors. XRD measurements by Dualeh et al. on films dried at 25 °C indicated a number of unknown oxidized and/or hydrated phases within the sample alongside unreacted PbCl2. Reference Dualeh, Tétreault, Moehl, Gao, Nazeeruddin and Grätzel49 The relative ratios of each phase depend not only on the history of the solution and the film formation step but also the conditions of the local environment. For example, in otherwise dry atmospheres, 3:1 mol% CH3NH3I:PbCl2 precursor films will have a yellow hue that is indicative of PbI2 formation. When moisture is present in the atmosphere, these films will evolve in color and film morphology to a partially hydrated phase because of the hygroscopic nature of the organic halide. Reference Eperon, Habisreutinger, Leijtens, Bruijnaers, van Franeker, deQuilettes, Pathak, Sutton, Grancini, Ginger, Janssen, Petrozza and Snaith50,Reference Leguy, Hu, Campoy-Quiles, Alonso, Weber, Azarhoosh, van Schilfgaarde, Weller, Bein, Nelson, Docampo and Barnes51 Although the exact structures within these samples are difficult to characterize unambiguously, what is known is that the exposure to humid atmospheres has a major impact on the perovskite formation process and the semiconductor properties of the final sample. Reference Eperon, Habisreutinger, Leijtens, Bruijnaers, van Franeker, deQuilettes, Pathak, Sutton, Grancini, Ginger, Janssen, Petrozza and Snaith50 In one study by Unger et al., the researchers evidenced the formation of needle-like crystals 10–100 µm in size in 3:1 mol% CH3NH3I:PbCl2 precursor films left in ambient conditions over one hour, Reference Unger, Bowring, Tassone, Pool, Gold-Parker, Cheacharoen, Stone, Hoke, Toney and McGehee52 with such structures broadly maintaining their macroscopic shape and size after annealing at 100 °C. These observations were supported by the work of Barrows et al., Reference Barrows, Lilliu, Pearson, Babonneau, Dunbar and Lidzey53 who confirmed the reappearance of the yellow phase during the temperature ramp of the thermal annealing process.
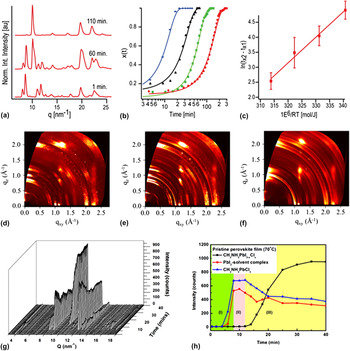
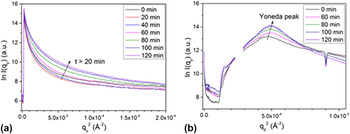
Through these studies and several others, Reference Dualeh, Tétreault, Moehl, Gao, Nazeeruddin and Grätzel49,Reference Moore, Sai, Tan, Smilgies, Zhang, Snaith, Wiesner and Estroff54–Reference Lilliu, Griffin, Barrows, Alsari, Curzadd, Dane, Bikondoa, Macdonald and Lidzey59 the conversion of 3:1 mol% CH3NH3I:PbCl2 to CH3NH3Pb(I x Cl1−x )3 via thermal annealing has been characterized in situ using XRD, GIWAXS, and GISAXS techniques. During the temperature ramp, and at temperatures below 70 °C, slow conversion of the precursor intermediates into the target perovskite composition takes place (i.e., complete conversion requires an isothermal annealing time of several hours Reference Dualeh, Tétreault, Moehl, Gao, Nazeeruddin and Grätzel49 ). Residual solvent may evaporate during this stage for films that have not been completely dried after solution casting. At temperatures around 50–70 °C, formation of metastable PbI2 and CH3NH3PbCl3 crystallites begins to take place, their size being partly determined by the temperature ramp rate. Reference Nenon, Christians, Wheeler, Blackburn, Sanehira, Dou, Olsen, Zhu, Berry and Luther57 Ex situ work by Williams et al. has shown that the Cl-rich perovskite phase acts as a template for the final sample morphology. Reference Williams, Zuo, Chueh, Liao, Liang and Jen60 As the sample temperature continues to rise these processes precede and eventually drive the accelerated formation of the more stable CH3NH3Pb(I x Cl1−x ) phase, with chlorine present at a halide concentration of a few % or less. Reference Chang, Huang, Tsao and Su58 Isothermal annealing experiments in the temperature range 80–120 °C have been used to determine an activation energy of roughly 85 kJ/mol Reference Barrows, Lilliu, Pearson, Babonneau, Dunbar and Lidzey53,Reference Moore, Sai, Tan, Smilgies, Zhang, Snaith, Wiesner and Estroff54 for this transformation. At these temperatures excess CH3NH3Cl is removed from the film by sublimation, a process may be partly rationalized by the low miscibility between Cl- and I-rich perovskite phases as discussed earlier. Film densification also takes place during this time, alongside changes in the aspect ratio and orientation of perovskite grains. Reference Barrows, Lilliu, Pearson, Babonneau, Dunbar and Lidzey53,Reference Lilliu, Griffin, Barrows, Alsari, Curzadd, Dane, Bikondoa, Macdonald and Lidzey59 These steps are summarized in Figs. 5 and 6 below.
Overview of “one-step” formation of CH3NH3Pb(I x Cl1−x )3 perovskite, as inferred from in situ GIWAXS measurements. (a) Azimuthally integrated GIWAXS patterns corresponding to the precursor, intermediate, and perovskite phases during an isothermal annealing step at 90 °C. Parts (b) and (c) detail the growth kinetics of the perovskite phase—determined from the intensity of the [110] perovskite reflection at q ∼1 Å−1—for isothermal annealing temperatures between 80 and 110 °C. Reprinted with permission from Ref. Reference Moore, Sai, Tan, Smilgies, Zhang, Snaith, Wiesner and Estroff54. Copyright 2015 American Chemical Society. Insight into the evolution of crystal grain orientation is provided in parts (d)–(f), where the presented 2D GIWAXS patterns correspond to the precursor phase (d), an intermediate phase containing 50% CH3NH3Pb(I x Cl1−x )3 (e), and the fully formed CH3NH3Pb(I x Cl1−x )3 phase (f) during a 80 °C isothermal anneal. Reprinted from Ref. Reference Barrows, Lilliu, Pearson, Babonneau, Dunbar and Lidzey53 under a Creative Commons BY 4.0 license. In situ GIWAXS patterns for a drop-cast sample annealed at 70 °C are shown in part (g) with the corresponding kinetics shown in (h). Reprinted with permission from Ref. Reference Chang, Huang, Tsao and Su58. Copyright 2016 American Chemical Society.

In situ GISAXS data (Guinier plots) showing the evolution in one-step processed CH3NH3Pb(I x Cl1−x )3 perovskite during a 80 °C isothermal anneal. Reprinted from Ref. Reference Barrows, Lilliu, Pearson, Babonneau, Dunbar and Lidzey53 under a Creative Commons BY 4.0 license.

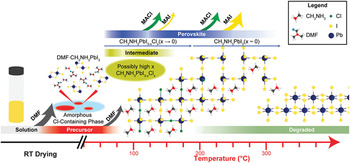
The formation of low defect-density CH3NH3Pb(I x Cl1−x ) films is achieved by annealing the sample for between one and two hours in the temperature range 80–120 °C, where higher annealing temperatures increase the kinetics of the crystallization process. Reference Barrows, Lilliu, Pearson, Babonneau, Dunbar and Lidzey53,Reference Eperon, Burlakov, Docampo, Goriely and Snaith61 The quality of the formed perovskite layer can also be affected by the porosity of the substrate (a factor that is important in the manufacture of flexible solar cells), as small volumes of solvent and organic material can be absorbed during precursor casting. Reference Schmidt, Larsen-Olsen, Carlé, Angmo and Krebs25,Reference Rossander, Larsen-Olsen, Dam, Schmidt, Corazza, Norrman, Rajkovic, Andreasen and Krebs56 Although the annealing temperature ramp rate is not widely reported in device studies, Xu et al. have shown that gradual annealing facilitates enhanced solar cell efficiencies through the creation of compact perovskite films, alongside a controllable Cl concentration within the miscibility limit. Reference Kang, Kim, Yeo, Lee, Jeon and Kim62,Reference Xu, Zhang, Zhang, Zhu, Su, Liu, Wong, Liao and Choy63 When longer annealing times or annealing temperatures above this range are used, the formed perovskite undergoes irreversible decomposition through the removal of volatile organic material. As a consequence, PbI2 becomes the dominant phase within the film. Figure 7 illustrates the general evolution in CH3NH3Pb(I x Cl1−x )3 film formation and decomposition during a continuous temperature ramp.
Schematic representation of the main processes that take place during CH3NH3Pb(I x Cl1−x )3 perovskite formation and degradation. The approximate relative intensity of X-ray scatter from each phase (proportional to its abundance in the sample) is represented by the intensity of the color bars. Reference Nenon, Christians, Wheeler, Blackburn, Sanehira, Dou, Olsen, Zhu, Berry and Luther57 Reproduced by permission of The Royal Society of Chemistry.

In circumstances where halide loss out-competes perovskite crystallization, the likelihood for non-perovskite phases to exist in the final sample increases. A detailed discussion on whether such phases are beneficial for semiconductor optoelectronic performance and device stability is beyond the scope of this review. Reference Cao, Stoumpos, Malliakas, Katz, Farha, Hupp and Kanatzidis64–Reference Liu, Dong, Wong, Djurišić, Ng, Ren, Shen, Surya, Chan, Wang, Ng, Liao, Li, Shih, Wei, Su and Dai66 What is clear however is that the sample stoichiometry and defect density are not only determined by the casting solution but also by the local environment during annealing. For example, annealing in an atmosphere rich in organic halide provides an external source of precursor that can compensate for any excessive precursor loss from the sample. Reference Chen, Zhou, Hong, Luo, Duan, Wang, Liu, Li and Yang67,Reference Zhou, Wang, Zhou, Pang, Wang, Xu, Liu, Padture and Cui68 Likewise, annealing in a solvent rich atmosphere provides an alternative means to achieve fully grown perovskite films, through the suppressed solvent evaporation rate and the associated extended precursor recrystallization time. Reference Xiao, Dong, Bi, Shao, Yuan and Huang69,Reference Yu, Liu, Xia, Dong, Zhang, Wang, Zhou, Song and Li70 These factors have yet to be investigated in-depth using time-resolved measurements on the sample structure. The exception to this are the studies on the effects of moisture, and since CH3NH3I is hygroscopic these experiments can be motivated either by a need to rationalize the processing of perovskite films under ambient conditions or to characterize the effects of accelerated aging.
One of the first reports on the beneficial effects of preparing CH3NH3Pb(I x Cl1−x )3 films in ambient conditions was provided by You et al. Reference You, Yang, Hong, Song, Meng, Liu, Jiang, Zhou, Chang, Li and Yang71 Under conditions of 35% relative humidity, a 3% absolute increase in average device PCE over solar cells prepared in dry nitrogen (12% initial PCE) was demonstrated. Scanning electron microscopy (SEM) measurements gave insight into this enhancement, showing improved perovskite surface coverage and larger grain sizes for the ambient processed films. By varying the relative humidity, a processing window for enhanced optoelectronic performance was identified; an upper bound of ∼80% is in good agreement with the work of Eperon et al. on the moisture-assisted growth of CH3NH3PbI3 thin films. Reference Eperon, Habisreutinger, Leijtens, Bruijnaers, van Franeker, deQuilettes, Pathak, Sutton, Grancini, Ginger, Janssen, Petrozza and Snaith50 Both groups suggested that the underlying mechanism for the improved perovskite film quality was the increase in CH3NH3I mobility, which out-competes its evaporation and removal from the sample within the optimum humidity range. The accumulation of water molecules in grain boundaries may also enable larger crystallites to form via boundary creep between smaller grains. Reference Urai72
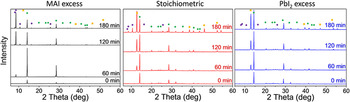
It is important to recognize that the benefits of ‘self-healing’ can also be realized postperovskite formation, whereby films that have been initially prepared in dry conditions are exposed to low levels of moisture during a second annealing step. Reference Petrus, Hu, Moia, Calado, Leguy, Barnes and Docampo73 A key factor in either treatment is the stoichiometry of the precursor mixture; work on CH3NH3PbI3 has shown that if excess of PbI2 is present in the precursor film its ability to withstand moisture-induced perovskite decomposition is improved compared to samples prepared using equal quantities of organic and inorganic halides (Fig. 8). Reference Petrus, Hu, Moia, Calado, Leguy, Barnes and Docampo73 From this result, it was proposed that PbI2 acts as a protective barrier layer for CH3NH3PbI3 grains, residing at the surface and/or terminal positions of perovskite grains due to its delayed crystallization following precursor conversion. Understandably, films prepared using excess CH3NH3I exhibited the slowest formation of PbI2 degradation products during perovskite formation, and in the presence of moisture also underwent the largest changes in film morphology during a second annealing treatment, in agreement with previous studies. The positive outcome from this study was the clear demonstration of the interplay between perovskite precursor compositions, the benefits (if any) that can be brought by moisture-assisted perovskite formation, and the long-term stability of the final sample.
Time-resolved XRD measurements of CH3NH3PbI3 perovskite thin films during postformation hydration under conditions of 90% relative humidity/25 °C. Perovskite films were initially prepared using stoichiometric mixtures of CH3NH3I and PbI2 or 5% molar excess of either. Green, purple, and yellow symbols correspond to CH3NH3PbI3, PbI2, and CH3NH3PbI3·H2O phases respectively, and clarify the different onsets of perovskite degradation. Figure reprinted with permission from Ref. Reference Petrus, Hu, Moia, Calado, Leguy, Barnes and Docampo73. Copyright 2016 Wiley-VCH.

D. The role of precursor materials and casting solvents
The previous analysis provides a foundation on which to consider more widely how different precursor materials, stoichiometries, and casting solvents impact upon the quality of CH3NH3Pb(I x Cl1−x )3 and CH3NH3PbI3 films. Studies on the role of the lead anion by Weisner, Snaith, and co-workers showed how the thermal budget associated with precursor conversion can be reduced by using lead salts with high volatility. Reference Moore, Sai, Tan, Smilgies, Zhang, Snaith, Wiesner and Estroff54,Reference Zhang, Saliba, Moore, Pathak, Hörantner, Stergiopoulos, Stranks, Eperon, Alexander-Webber, Abate, Sadhanala, Yao, Chen, Friend, Estroff, Wiesner and Snaith74 Specifically, CH3NH3PbI3 films prepared by lead acetate (PbAc2) rather than PbI2 required shorter annealing times and facilitated the formation of ultra-smooth perovskite films with almost total substrate coverage. Reference Zhang, Saliba, Moore, Pathak, Hörantner, Stergiopoulos, Stranks, Eperon, Alexander-Webber, Abate, Sadhanala, Yao, Chen, Friend, Estroff, Wiesner and Snaith74 Average solar cell PCE metrics were 14% and 12%, respectively. PbAc2-route CH3NH3PbI3 films were further characterized by a weak preferential ordering of crystal domains, a feature that may be explained by the faster rate of precursor transformation, in addition to enhanced thermal stability as judged by the delayed emergence of PbI2 during extended isothermal annealing. For the most volatile lead anion, lead nitrate, the perovskite crystal growth can even take place at ambient temperature, leading to potentially uncontrolled perovskite growth and poor device efficiencies.
Insight into the role of chlorine on the perovskite formation process was provided by Nenon et al. who studied the formation of drop-cast CH3NH3Pb(I x Cl1−x )3 films from different precursors and organic- to inorganic-halide stoichiometries (Fig. 9). Reference Nenon, Christians, Wheeler, Blackburn, Sanehira, Dou, Olsen, Zhu, Berry and Luther57 During thermal annealing, a key difference in perovskite formation when Cl was present was the existence of a relatively crystalline Cl-rich intermediate perovskite phase at temperatures above 50 °C that mediated the growth of iodine rich CH3NH3Pb(I x Cl1−x )3 at temperatures above 70 °C. By noting the differences in the abundance of each precursor phase when comparing drop-cast films with films prepared via spin-coating, it was suggested that high-quality perovskite films can be realized by exerting greater kinetic control over the sample during precursor solution deposition, as well as during the early stages of the thermal annealing step (e.g., the temperature ramp). The presence of Cl also impacts upon the kinetics of perovskite breakdown at higher temperatures, in addition to influencing the yield of degradation by-products. As can be seen in Fig. 9, films of CH3NH3Pb(I x Cl1−x )3 prepared using either 1:1:1 mol% CH3NH3I:CH3NH3Cl:PbI2 or 3:1 mol% CH3NH3I:PbCl2 precursor stoichiometries undergo thermally induced decomposition before films of the pure triiodide. Although the onset temperatures for decomposition differ by roughly 40 °C the rate of perovskite breakdown is significantly faster for CH3NH3PbI3, with PbI2 forming rapidly as a result. Such findings potentially provide a foundation on which the interplay between perovskite- and non-perovskite phases in governing the optoelectronic properties of aged devices—particularly those subject to thermal stresses—can be understood.
(a)–(c) In situ temperature-dependant XRD scans of drop-cast perovskite precursor solutions prepared using 1:1 mol% CH3NH3I (MAI):PbI2, mol% 1:1:1 CH3NH3I:CH3NH3Cl (MACl):PbI2, or 3:1 mol% CH3NH3I:PbCl2. In parts (d)–(f), the same precursor samples are subject to in situ temperature-programmed desorption mass spectrometry (TPD-MS) measurements that provide insight into the loss of organic material during heating. Reference Nenon, Christians, Wheeler, Blackburn, Sanehira, Dou, Olsen, Zhu, Berry and Luther57 Reproduced by permission of The Royal Society of Chemistry.

A vital outcome from the Nenon study was the observed difference in precursor abundance in drop-cast films relative to those prepared by spin-coating, proving the relationship between precursor intermediate sample phases, film drying dynamics, and the final perovskite structure. Such relationships are a crucial component in solar cell process optimization and in the medium-term, research of this type also helps to rationally design scalable processing methods—where any given technique can involve distinct film formation dynamics—to maintain device performance parity. As an optimization strategy therefore, solvent engineering is a valuable approach to realizing low defect-density semiconductor films with high performance metrics. Reference Jeon, Noh, Kim, Yang, Ryu and Seok75 Although in situ experiments are less developed in this area, an analysis of significant ex situ sample characterization papers is instructive to appreciate how future studies may be inspired.
The first detailed report on the effects of different casting solvents evidenced a link between slowly dried precursor films, specifically those cast from relatively high boiling-point (b.p.) solvents such as dimethyl sulfoxide (DMSO), and hybrid perovskite layers containing voids and other large-scale thickness non-uniformities. Reference Eperon, Burlakov, Docampo, Goriely and Snaith61 Upon integration into a solar cell device, such films facilitated significant electrical shorting (amongst other negative effects) and as a result PCEs were poor. To maximize the crystal grain size as well as overall surface coverage, low b.p. solvents are preferred. Within the literature on single precursor casting solvents, a recent study by Noel et al. has shown how acetonitrile can be used to prepare pinhole-free, highly specular CH3NH3PbI3 films over areas exceeding 100 cm2 and solar cells with PCEs of up to 18%. Reference Noel, Habisreutinger, Wenger, Klug, Hörantner, Johnston, Nicholas, Moore and Snaith76 To realize these positive sample characteristics, acetonitrile must be first mixed with methylamine gas to facilitate its dissolution of the precursor lead salt, which would otherwise be insoluble.
Rather than working with a single casting solvent, the use of solvent additives provides an alternative approach to realizing high solar cell efficiencies. Diiodooctane (DIO) is one such example and can be used in perovskite solar cell fabrication by dissolving at a few vol% in DMF. Reference Liang, Liao, Chueh, Zuo, Williams, Xin, Lin and Jen77,Reference Chueh, Liao, Zuo, Williams, Liang and Jen78 Generally characterized by its high boiling point and low volatility, the proposed mechanism for the benefits brought by DIO is its chelation with the precursor lead halide, which results in a modified and extended process of film formation. Reference Manser, Reid and Kamat79,Reference Yoon, Stamplecoskie and Kamat80 Given the relatively low C–I bond strength (∼50 kcal/mol), during thermal annealing residual DIO in the cast film can provide an additional source of halide material to the precursor-perovskite transformation process. A follow-up study on a wider range of alkyl halide additives supported this model and demonstrated solar cell PCEs of up to 13% through synergistic improvements in the device open circuit-voltage (V OC), short circuit-photocurrent density (J SC), and fill factor (FF), suggesting a route for fine control of halide stoichiometry and morphology in perovskite films. Reference Chueh, Liao, Zuo, Williams, Liang and Jen78 Elsewhere, the use of hypophosphorous acid (HPA) has been demonstrated to alter the volume fractions of perovskite- and non-perovskite phases within a CH3NH3PbI3 film by acting as a reducing agent for oxidized I2, a species that would otherwise favor the formation of metallic lead/charge recombination centers in the sample. Reference Zhang, Pathak, Sakai, Stergiopoulos, Nayak, Noel, Haghighirad, Burlakov, deQuilettes, Sadhanala, Li, Wang, Ginger, Friend and Snaith81 Its ability to retard the crystallization dynamics of the perovskite can also result in large grains being formed, and as a consequence of both processes efficient solar cells can be realized (average stabilized power outputs for HPA-processed and reference solar cells were 13% and 7%, respectively).
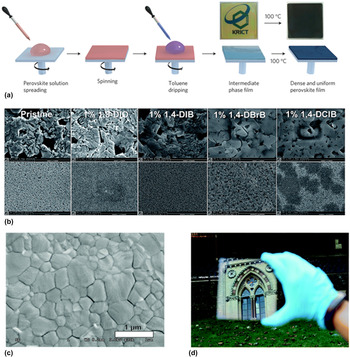
A final example of solvent engineering is solvent washing, which involves the deposition of a neat antisolvent such as toluene or chlorobenzene to the precursor film during casting. Reference Jeon, Noh, Kim, Yang, Ryu and Seok75,Reference Jung, Williams and Jen82,Reference Ahn, Son, Jang, Kang, Choi and Park83 This step induces a rapid (few seconds) precipitation and partial-crystallization of precursor material, enabling the production of a uniform and compact film prior to the standard thermal annealing step. Although solvent washing is clearly beneficial for device performance, as relative efficiency improvements of up to 30% have been realized, its short duration may frustrate attempts to characterize its effects in situ. In Fig. 10, an overview of perovskite films processed via solvent engineering methods is presented.
Overview of solvent engineering methods that promote the formation of perovskite films with improved optoelectronic properties. Part (a) outlines the main steps in “one-step” processing of CH3NH3Pb(I1−x Br x )3 perovskite films, with an additional step (the toluene drip) applied within the final 30 s of the precursor spin coating step. Reprinted with permission from Ref. Reference Jeon, Noh, Kim, Yang, Ryu and Seok75. Copyright 2014 Nature Publishing Group. In part (b), a series of scanning electron micrographs are presented for CH3NH3PbI3−x Cl x films prepared using various alkyl-chain additives in the precursor solution, where the top row of images correspond to a field-of-view of approximately 5 × 4 µm2. Reference Chueh, Liao, Zuo, Williams, Liang and Jen78 Reproduced by permission of The Royal Society of Chemistry. Parts (c) and (d) correspond to films of CH3NH3PbI3 prepared using an acetonitrile/methylamine solution. Reference Noel, Habisreutinger, Wenger, Klug, Hörantner, Johnston, Nicholas, Moore and Snaith76 Reproduced by permission of The Royal Society of Chemistry.

E. “Two-step” processing
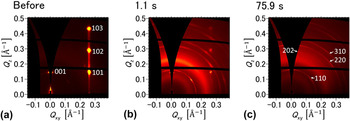
The sequential deposition of inorganic- and organic-halide precursors potentially affords greater control over the final perovskite film morphology due to the intermediate preparation and optimization of the inorganic material (e.g., PbI2). Typically, the organic-halide is introduced to the inorganic film in the solution phase using a solvent that is orthogonal to the underlying layer. Reference Burschka, Pellet, Moon, Humphry-Baker, Gao, Nazeeruddin and Grätzel32 Vapor-phase deposition methods have also been shown to produce high-quality films with promising solar cell figures of merit. Reference You, Yang, Hong, Song, Meng, Liu, Jiang, Zhou, Chang, Li and Yang71 Insight into the dynamics of the solution-phase process was provided by Miyadera et al. who performed in situ GIWAXS measurements on CH3NH3I solutions drop-cast onto pre-made PbI2 films. Reference Miyadera, Shibata, Koganezawa, Murakami, Sugita, Tanigaki and Chikamatsu84 As with the in situ GIWAXS studies on one-step processed perovskite films, an important observation in this work was the disruption in PbI2 grain orientation during perovskite formation, as can be seen in Fig. 11. For example, when PbI2 crystallites are initially highly orientated, as may be the case following vapor-phase deposition, CH3NH3I quickly disturbs this alignment by infiltrating and swelling the film. With increasing reaction time, the formation of relatively large perovskite grains is encouraged; note however that the density of the PbI2 layer plays a key role in governing the kinetics of process, as layers that are compact and relatively free of voids and pinholes require more time for CH3NH3I inclusion and reaction.
In situ GIWAXS characterization of CH3NH3PbI3 perovskite during two-step processing. (a) GIWAXS pattern for a vacuum-deposited PbI2 thin film before CH3NH3I drop-casting. Parts (b) and (c) correspond to the same sample shortly after drop-casting and at a later time where diffraction features relating to the perovskite can be identified. Reprinted with permission from Ref. Reference Miyadera, Shibata, Koganezawa, Murakami, Sugita, Tanigaki and Chikamatsu84. Copyright 2015 American Chemical Society.

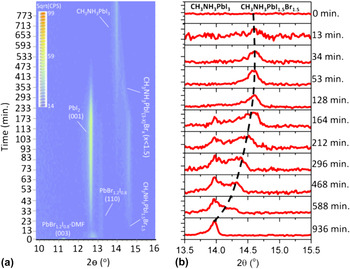
In a study that is complementary to the work in Ref. Reference Miyadera, Shibata, Koganezawa, Murakami, Sugita, Tanigaki and Chikamatsu84, the formation of CH3NH3PbI3 via diffusion of CH3NH3I vapor into pre-grown PbI2 was characterized by Yang et al. Reference Yang, Keum, Ovchinnikova, Belianinov, Chen, Du, Ivanov, Rouleau, Geohegan and Xiao85 Here, both the lead-halide film and the CH3NH3I source were placed in a heated chamber within an XRD setup. During a continuous temperature ramp, the nucleation and early stage growth of CH3NH3PbI3 took place at temperatures exceeding 120 °C. At higher temperatures (200–240 °C), the crystallinity of CH3NH3PbI3 underwent a rapid increase before decomposing, indicative of late-stage grain reorientation and coalescence. Compared to 1-step processing of CH3NH3Pb(I x Cl1−x )3, the activation energy for CH3NH3PbI3 formation via this route is much higher, at around ∼180 kJ/mol. Furthermore, the dominant growth mode of perovskite crystals is in-line with the expected pathways by which CH3NH3I infiltrates the PbI2 layer, i.e., surface initiated and further enabled by disruptions to crystal orientation that is induced by the perovskite growth process. These measurements provided a basis on which the growth dynamics of multiple mixed-halide perovskite films could be considered. For both mixed I/Br and I/Cl compositions, it was found that CH3NH3PbI3 was the preferred growth phase, a result that is rationalized by the relatively reactive nature of iodine. Data relating to the mixed I/Br sample are shown in Fig. 12. For the case of mixed I/Cl films, time-of-flight secondary ion mass spectroscopy (TOF-SIMS) imaging evidenced an in-plane network of Cl-enriched regions that were presumed to correspond to CH3NH3PbI3 grain boundaries. Perhaps counterintuitively, Br and Cl facilitated the growth of larger CH3NH3PbI3 grains compared to samples prepared without the additional halide, providing supporting evidence to related studies that showed improved optoelectronic performance for films prepared via the mixed-halide route. Reference Chen, Zhou, Fang, Stieg, Song, Wang, Xu, Liu, Lu, You, Sun, McKay, Goorsky and Yang44,Reference Stranks, Eperon, Grancini, Menelaou, Alcocer, Leijtens, Herz, Petrozza and Snaith45
In situ XRD scans of vapor-phase grown CH3NH3Pb(I1−x Br x )3 films. Here, the temperature of the environment is 120 °C and the composition of the initial lead halide film is PbBr1.2I0.8. The data show that with increasing reaction time, the formation of CH3NH3PbI3 is favored. Reprinted with permission from Ref. Reference Yang, Keum, Ovchinnikova, Belianinov, Chen, Du, Ivanov, Rouleau, Geohegan and Xiao85. Copyright 2016 American Chemical Society.

F. Other perovskites
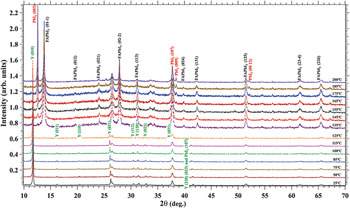
Substitution of methylammonium for formamidinium [HC(NH2)2 or ‘FA’] in lead halide perovskites is one example of composition engineering. Reference Eperon, Stranks, Menelaou, Johnston, Herz and Snaith86,Reference Koh, Fu, Fang, Chen, Sum, Mathews, Mhaisalkar, Boix and Baikie87 Due to its larger size, the presence of FA cations within the perovskite lattice structure permits the preparation of semiconductors with relatively low band-gaps. The conditions in which the perovskite forms also change, with annealing temperatures (during “one-step processing”) above 130 °C being used for precursor transformation. Aguiar et al. provided insight into this process for films of FAPbI3 using in situ XRD alongside in situ transmission electron microscopy (TEM). Reference Aguiar, Wozny, Holesinger, Aoki, Patel, Yang, Berry, Al-Jassim, Zhou and Zhu88 Between the onset temperature for perovskite formation and ∼175 °C, the growth of FAPbI3 crystallites takes place alongside the growth of crystalline PbI2 (Fig. 13), with the latter residing at the perovskite grain boundaries as determined by TEM. Complementary valence electron energy loss (VEEL) spectroscopy measurements correlated the spatial distribution of PbI2 with hydroxyl species, suggesting a pathway by which water molecules may penetrate and potentially degrade the entire sample. During sample thermal annealing, whilst films of CH3NH3PbI3 would quickly degrade at these temperatures, films of FAPbI3 are relatively stable and can consume PbI2 to increase the phase purity of the sample. Only at temperatures above 175 °C does PbI2 formation outcompete perovskite growth, as the sublimation temperature of organic material has been significantly exceeded (∼145 °C for formamidinium iodide Reference Leyden, Lee, Raga and Qi89 ).
In situ XRD patterns of FAPbI3 formation and degradation, with peaks labeled according to each crystalline phase. Reference Aguiar, Wozny, Holesinger, Aoki, Patel, Yang, Berry, Al-Jassim, Zhou and Zhu88 Reproduced by permission of The Royal Society of Chemistry.

G. Degradation studies
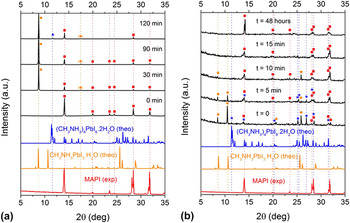
Alongside in situ structural studies of perovskite formation, scattering techniques have also been applied to understand the kinetics and mechanisms of perovskite degradation. The effects of high temperatures on material sublimation have already been discussed in this review article. For moisture, its effects have so far been considered in the context of perovskite formation. Under the most stressful conditions, exposing pre-made CH3NH3PbI3 to condensed water will result in its irreversible breakdown into methylamine and lead iodide, with hydroiodic acid as an additional by-product. Reference Leguy, Hu, Campoy-Quiles, Alonso, Weber, Azarhoosh, van Schilfgaarde, Weller, Bein, Nelson, Docampo and Barnes51,Reference Yang, Siempelkamp, Liu and Kelly90 The relatively lower solubility of lead iodide in water results in its increased concentration in the degraded film, thereby increasing the likelihood of it being detected in XRD measurements. For example, Yang et al. identified PbI6 4− in CH3NH3PbI3 films exposed to high relative humidity (>80%) for several hours and hypothesized that such a phase mediates the early stages of film decomposition. Reference Yang, Siempelkamp, Liu and Kelly90 As an alternative, exposing the same perovskite to water vapor delays the onset of irreversible material breakdown. Here, degradation evolves via a transitional phase where the semiconductor is partially hydrated and may return back to CH3NH3PbI3 by extended drying. Figure 14 provides insight into this process, where in situ XRD data are presented for both the hydrating and dehydrating steps. Through combined X-ray and spectroscopic ellipsometry measurements on unencapsulated CH3NH3PbI3 films, Leguy et al. demonstrated that water molecules hydrate the perovskite over several minutes, suggesting that crystal grain boundaries play an important role in their ability to ingress the film. In a manner that is analogous to the infiltration of CH3NH3I into PbI2 during “two-step” perovskite formation, water molecules swell the film and hydrate individual grains from their exterior inwards, partially disrupting their orientation in the process. For working solar cells, these ‘monohydrate’ phases (i.e., CH3NH3PbI3·H2O) act as insulating barriers between unreacted perovskite domains, resulting in substantially reduced charge transport and extraction efficiencies. Although dehydration of the monohydrate phase can result in the full recovery of the original perovskite composition, its optoelectronic properties will remain altered, supporting the notion of a recrystallized perovskite morphology. Extended moisture exposure induces full conversion of the perovskite into a hydrated phase before undergoing decomposition, where excess water facilitates the dissolution of methylammonium.
In situ XRD patterns for a CH3NH3PbI3 film exposed to humid air (80% relative humidity) (a) and a subsequent drying step (35% relative humidity) (b). Reprinted with permission from Ref. Reference Leguy, Hu, Campoy-Quiles, Alonso, Weber, Azarhoosh, van Schilfgaarde, Weller, Bein, Nelson, Docampo and Barnes51. Copyright 2015 American Chemical Society.

In situ degradation studies for perovskite semiconductors are at an earlier stage of development compared to processing studies; however they are likely to grow in popularity to provide insight into the intrinsic stabilities of different perovskite compositions and dimensionalities. Stability issues that are currently poorly understood are the decomposition-induced effects of UV light and oxygen, Reference Aristidou, Sanchez-Molina, Chotchuangchutchaval, Brown, Martinez, Rath and Haque91–Reference Pearson, Eperon, Hopkinson, Habisreutinger, Wang, Snaith and Greenham93 either synergistically or as individual stress factors. For oxygen, interaction between methylammonium lead iodide, oxygen, and a free electron results in the perovskite breaking down into methylamine and lead iodide, with iodine and water as additional by-products. Reference Koh, Fu, Fang, Chen, Sum, Mathews, Mhaisalkar, Boix and Baikie87 Initial studies have provided strong evidence for this process being as severe, if not more so, than the effects of moisture on the properties of the semiconductors, however the role of intermediate/non-perovskite phases remains unknown.
III. IN SITU MORPHOLOGY CHARACTERIZATION FOR ORGANIC PV FILMS
A major theme within solution processable organic photovoltaics (OPVs) research is the study of active layer nanostructure or morphology. Reference Li, Zhu and Yang8,Reference Chen, Nikiforov and Darling14,Reference Huang, Kramer, Heeger and Bazan94–Reference Brady, Su and Chabinyc96 As the primary photoexcited state in organic semiconductors is a singlet exciton with a typical binding energy of ∼0.3 eV, Reference Bardeen97 a key requirement for efficient photocurrent generation in these devices is the semiconductor bulk-heterojunction (BHJ), where differences in electron affinity and molecular aggregation between an electron donor and electron acceptor provide a driving force for charge separation. Reference Bakulin, Rao, Pavelyev, van Loosdrecht, Pshenichnikov, Niedzialek, Cornil, Beljonne and Friend98–Reference Clarke and Durrant102 Because of the short (∼several nm) diffusion length of singlet excitons, Reference Bardeen97,Reference Halls, Pichler, Friend, Moratti and Holmes103,Reference Shaw, Ruseckas and Samuel104 the characteristic lengthscale within BHJ semiconductor blends is commensurate with this distance to ensure that the efficiency of exciton dissociation is maximized. From a structural standpoint, therefore, achieving high overall PCE in an OPV requires careful designing of the light harvesting layer nanostructure, such that the bulk interfacial area between the electron donor and electron acceptor is balanced with the volume and connectivity of the pure semiconductor material that facilitates efficient charge transport and extraction. Factors that significantly affect the morphology of OPV thin films processed from solution include the chemical structures of the molecular semiconductors, their relative mixing ratio, the composition of the casting solvent, the dynamics of film formation, and the use of postcasting annealing treatments.
A. Structure formation during solution processing
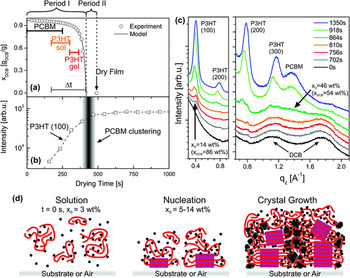
The donor:acceptor blend poly(3-hexylthiophene):[6,6]-phenyl C61-butyric acid methyl ester (P3HT:PCBM) has long acted as a reference system for constructing structure–property relationships in OPV research. Reference Brady, Su and Chabinyc96,Reference Dang, Hirsch and Wantz105 During solution casting, structure formation in this semi-crystalline blend proceeds via material crystallization and aggregation, processes that are triggered by the solid content of the drying film exceeding certain thresholds. Through in situ GIWAXS measurements on bar-coated thin films, Wang et al. identified a critical solid concentration of 50% in 1:0.8 wt% P3HT:PCBM blends, beyond which the rate of P3HT lamella stacking increased significantly. Reference Wang, Dunbar, Staniec, Pearson, Hopkinson, MacDonald, Lilliu, Pizzey, Terrill, Donald, Ryan, Jones and Lidzey106 Using spectroscopic ellipsometry, this behavior was correlated with the rapid increase in the film extinction coefficient and absorption red-shift, changes that are consistent with the planarization and extended effective conjugation length of P3HT chains. By casting the film at relatively low temperatures or by using a low-volatility/high boiling point solvent, the absolute crystallinity of the sample was enhanced through an extended crystallization time. A closely related GIWAXS study by Schmidt-Hansberg et al. identified a lower solid concentration for the onset of weak lamella ordering of P3HT—14% for the same blend composition—alongside a threshold concentration for PCBM aggregation (50%). Reference Schmidt-Hansberg, Sanyal, Klein, Pfaff, Schnabel, Jaiser, Vorobiev, Müller, Colsmann, Scharfer, Gerthsen, Lemmer, Barrena and Schabel107 The evolution in the film texture during drying, where P3HT chains initially aligned edge-on to the substrate before adopting a wider orientation distribution, highlighted the role of the buried interface in defining the film nanostructure and reaffirmed the vertically heterogeneous character of these blend thin films. From these results, a multi-stage description of blend structure formation was proposed, where P3HT crystallization drives PCBM molecules into amorphous regions of the wet film, increasing their local concentration. In parallel with continued solvent evaporation, this process proceeds until fullerene ordering is triggered; however the presence of P3HT crystallites restricts their growth and as a consequence only nanoscale aggregations can form (Fig. 15). When the fullerene loading is sufficiently high however, and the polymer is relatively amorphous, the stages of film formation can be reversed. Time-resolved measurements on 1:4 wt% poly[N-9′-heptadecanyl-2,7-carbazole-alt-5,5-(4′,7′-di-2-thienyl-2′,1′,3′-benzothiadiazole)] (PCDTBT):PCBM blends cast from dichlorobenzene have shown that whilst PCBM aggregation occurs once its solubility limit in the drying film has been reached (∼4% solid concentration), short-range ordering of the polymer only takes place in the final stage of the drying process (>75% solid concentration). Reference Pearson, Wang, Dunbar, Yi, Watters, Coles, Staniec, Iraqi, Jones and Lidzey108
Evolution in P3HT:PCBM film morphology during solution casting. Part (a) depicts the evolution in film solid concentration as a function of drying time, as determined from in situ optical reflectivity measurements. The growth kinetics of P3HT crystallization—inferred from the integrated intensity of the (100) X-ray reflection that corresponds to polymer lamella ordering—are shown in (b). Out-of-plane GIWAXS patterns at key points in the drying process are shown in part (c). These datasets are used to construct a model for film formation, which is illustrated schematically in part (d). Reprinted with permission from Ref. Reference Schmidt-Hansberg, Sanyal, Klein, Pfaff, Schnabel, Jaiser, Vorobiev, Müller, Colsmann, Scharfer, Gerthsen, Lemmer, Barrena and Schabel107. Copyright 2015 American Chemical Society.

B. The role of co-solvents and solvent additives
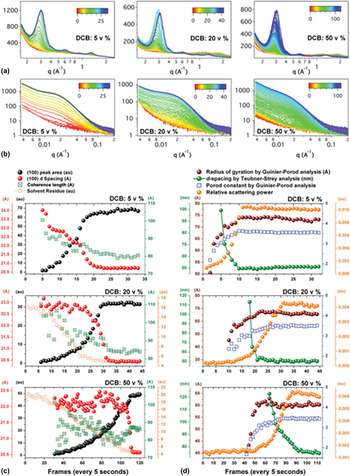
In semi-crystalline diketopyrrolopyrrole (DPP):PCBM blends cast from chloroform/dichlorobenzene (CF/DCB) solvent mixtures, a similar sequence of structure formation to P3HT:PCBM blends has been identified. Reference Liu, Gu, Wang, Zhao, Chen, Briseno and Russell109 Mechanistically, the as-cast morphology of this blend results from mixing a low volatility solvent that affords good solubility for the fullerene component (DCB) with a highly volatile solvent that provides greater solubility for the polymer (CF). During solution casting, fast evaporation of the ‘good’ polymer solvent in the film worsens the overall quality of any remaining solvent and encourages polymer aggregation and crystallization. Extended evaporation of the remaining solvent eventually triggers fullerene aggregation within the partially formed semi-crystalline polymer matrix. Adjusting the CF-to-DCB solvent ratio in favor of either component influences the film drying kinetics as well as the sizes and purities of polymer- and fullerene-rich domains, as the data presented in Fig. 16 show. Here, the in situ X-ray scattering measurements were made on slot-die coated blends of diketopyrrolopyrrole-quaterthiophene (DPPBT):PC71BM. Reference Liu, Ferdous, Schaible, Hexemer, Church, Ding, Wang and Russell110 It is interesting to note that for the case for 5 vol% DCB in the casting solution, phase separation of the fullerene precedes lamella crystallization of the polymer (inferred from the intensity of X-ray scatter from the (100) plane), a process that is likely due to the rapid loss of solvent from the film. Furthermore, as the data for the 50 vol% DCB sample show, the crystallinity of the polymer can be enhanced either through changes in the casting solvent composition or film drying time, neatly highlighting the complexity of morphology optimization in polymer:fullerene blend systems.
Evolution in film morphology for blends of DPPBT:PC71BM cast from chloroform/dichlorobenzene solvent mixtures, as characterized by in situ GIWAXS (a) and GISAXS (b). Here the GIWAXS measurements are used to characterize the crystallization of the polymer and the loss of solvent residue forms the film, and the GISAXS measurements are used to probe the characteristic domain size of phase separated aggregates. Detailed kinetic analyses on both datasets are presented in parts (c) and (d), respectively. Figure reprinted with permission from Ref. Reference Liu, Ferdous, Schaible, Hexemer, Church, Ding, Wang and Russell110. Copyright 2015 Wiley-VCH.

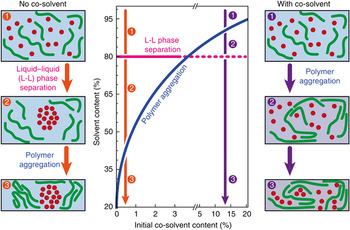
Under optimized conditions, the delayed aggregation of PCBM (alternatively the preferred crystallization of the DPP copolymer) during solution casting promotes the growth of a phase separated morphology with a characteristic lengthscale and phase purity that enable efficient PV behavior, obviating the need for further processing steps such as thermal annealing. As shown in Fig. 17, combined optical interference, scattering, and absorption measurements have suggested that a solid concentration of 20% in drying DPP:PCBM blend films sets the threshold for fullerene aggregation via liquid–liquid phase separation, Reference van Franeker, Turbiez, Li, Wienk and Janssen111 and that large scale polymer:fullerene phase separation can only be prevented by triggering polymer aggregation in solution before this point.
Phase diagram highlighting the conditions for polymer aggregation in DPP:fullerene blends prepared with varying concentrations of co-solvent in the casting solution. Accompanying figures illustrate schematically the key steps in structure formation with or without co-solvent processing. Reprinted with permission from Ref. Reference van Franeker, Turbiez, Li, Wienk and Janssen111. Copyright 2015 Nature Publishing Group.

The generality of this behavior can be appreciated when considering other studies and reviews on co-solvent and additive processed OPV blends. Reference van Franeker, Turbiez, Li, Wienk and Janssen111–Reference Lee, Ma, Brabec, Yuen, Moon, Kim, Lee, Bazan and Heeger113 High boiling point additives such as octanedithiol (ODT) and DIO exhibit good solubility of PCBM. Reference Lee, Ma, Brabec, Yuen, Moon, Kim, Lee, Bazan and Heeger113 When used in small vol% with standard processing solvents such as chlorobenzene, the deposition of co-polymer–PCBM blends prioritizes aggregation and ordering of the polymer phase over the potentially large scale phase separation of PCBM. Reference Liu, Zhao, Tumbleston, Wang, Gu, Wang, Briseno, Ade and Russell114 In addition, the time required for the film to completely dry is significantly extended because of the additives’ low volatility. This means that during the final stages of film formation (corresponding to solid concentrations exceeding 80 or 90%), domain coarsening can still take place as residual amounts of additive become trapped within the sample. Reference Tremolet de Villers, O’Hara, Ostrowski, Biddle, Shaheen, Chabinyc, Olson and Kopidakis115
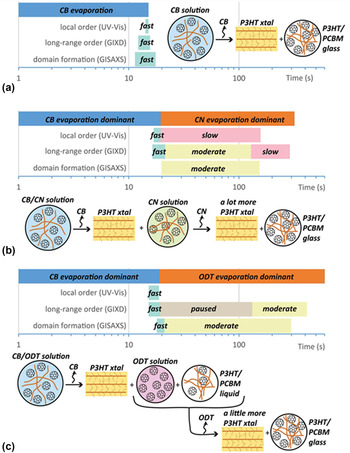
A general description of additive-controlled BHJ formation was provided by Richter et al., Reference Richter, DeLongchamp, Bokel, Engmann, Chou, Amassian, Schaible and Hexemer116 who studied blade-coated P3HT:PCBM blends prepared using ODT or 1-chloronaphthalene (CN) in the casting solvent (Fig. 18). When no additive is present, the growth of P3HT crystallites is frustrated by (i) the presence of PCBM and (ii) a high glass transition temperature (T g) of the blend relative to the casting temperature (∼50 °C Reference Pearson, Wang, Jones, Lidzey, Staniec, Hopkinson and Donald117 versus 40 °C). When CN additive is present, P3HT undergoes prolonged crystallization after the primary solvent has evaporated from the film, facilitated by a CN-plasticized mixed amorphous phase with low T g. In contrast, ODT initiates the formation of two liquid/amorphous phases that are rich in PCBM and P3HT, respectively. The selective dissolution of PCBM into ODT (i.e., a liquid phase) provides the basis for a P3HT-rich phase, again lowering T g. Importantly, only the ODT process requires the additive to selectively dissolve PCBM, its poor solubility for P3HT allows the creation of a second liquid phase which separates the two semiconductors.
Overview of film formation mechanisms and kinetics for P3HT/PCBM blends cast from (a) CB, (b) CB with CN additive, and (c) CB with ODT. Figure reprinted with permission from Ref. Reference Richter, DeLongchamp, Bokel, Engmann, Chou, Amassian, Schaible and Hexemer116. Copyright 2015 Wiley-VCH.

In contrast to any of these processes, thermal annealing of an as-cast film (or a polymer:fullerene bilayer sample) does not afford the same level of morphology control because the aggregation and/or crystallization of one material takes place in parallel with (and may consequently be limited by) the thermally activated diffusion of the second material. Reference Liu, Zhao, Tumbleston, Wang, Gu, Wang, Briseno, Ade and Russell114,Reference Treat, Brady, Smith, Toney, Kramer, Hawker and Chabinyc118 Alongside a reduced thermal budget, it is the ability to optimize the donor, acceptor, and mixed phases in sequence that has led to solvent engineering becoming a popular strategy for OPV optimization.
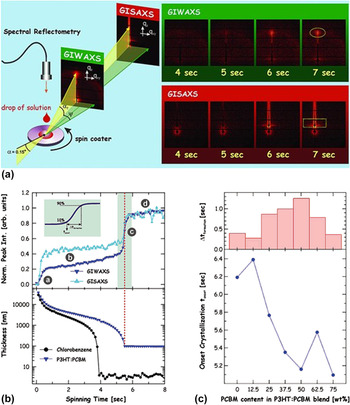
The studies reviewed so far have provided an improved understanding of the common dynamics of film formation in OPV blends; however they rarely directly replicate the conditions used in the preparation of high-efficiency OPVs. In general, these devices are prepared via spin-coating of the semi-conductor blend ink, and as a consequence measurements are required with much higher time resolution to accurately monitor the film as its structure and composition evolves. Using fast (100 ms/frame) GIWAXS/GISAXS measurements, this challenge was overcome by Amassian and co-workers who characterized the spin-coating process for blends of P3HT:PCBM, as shown in Fig. 19. Reference Chou, Yan, Li, Li, Zhao, Anjum, Alvarez, Gassaway, Biocca, Thoroddsen, Hexemer and Amassian119 For device optimized P3HT:PCBM blend compositions, polymer crystallization and fullerene phase separation were measured to occur in parallel within the first second of spin-coating, corresponding to a film solid concentration of a few %. Such structures were determined to be relatively stable in size and population until a film sold concentration of ∼17% was reached, after which time a rapid increase took place. Modifying the semiconductor blend solution toward P3HT- or PCBM-rich compositions favored the formation of larger polymer and fullerene domains, respectively, in the formed film, in addition to reducing the volume fraction of mixed-phase material. Here, it is important to recognize that the morphology of rapidly cast P3HT:PCBM does not enable favorable PV behavior, and that thermal and/or solvent annealing treatments are necessary to realize high PCEs. Reference Huang, Kramer, Heeger and Bazan94,Reference Brady, Su and Chabinyc96
In situ grazing-incidence X-ray scattering measurements of P3HT:PCBM during spin coating. Part (a) illustrates the principle components of the experimental setup. In part (b), the evolution in polymer ordering (inferred from the GIWAXS signal intensity), fullerene aggregation (inferred from the GISAXS signal intensity), and the thickness of the drying film are compared. Part (c) compares the time for morphology formation with the onset time for material crystallization, as a function of P3HT:PCBM blend composition. Figure reprinted with permission from Ref. Reference Chou, Yan, Li, Li, Zhao, Anjum, Alvarez, Gassaway, Biocca, Thoroddsen, Hexemer and Amassian119. Copyright 2013 Wiley-VCH.

A follow-up study on spin-coated blends prepared using CB/DIO confirmed that many of the mechanisms of structure formation for polymer:fullerene systems are also applicable to small molecule:fullerene systems. Reference Perez, Chou, Love, van der Poll, Smilgies, Nguyen, Kramer, Amassian and Bazan120 Here, the emergence of novel and efficient small molecule electron donors—promoted as a route to achieving reproducible semiconductor batches at a relatively low cost—has motivated the study of structure formation in these systems to provide a point of comparison to polymeric blends. For 7,7′-(4,4-bis(2-ethylhexyl)-4H-silolo[3,2-b:4,5-b′]dithiophene-2,6-diyl)bis(6-fluoro-4-(5′-hexyl-[2,2′-bithiophen]-5-yl)benzo[c][1,2,5] thiadiazole) (p-DTS(FBTTh2)2):PC71BM blends, a metastable p-DTS(FBTTh2)2 polymorph was identified during the first few seconds of spin-coating, which was proposed to influence the final film morphology. As with other studies on the use of DIO, its low volatility results in residual amounts remaining in the blend film, prolonging its drying time and promoting enhanced crystallization of the solid components. A factor that cannot be overlooked for this BHJ system however is that DIO is a relatively good solvent for p-DTS(FBTTh2)2. Reference Engmann, Bokel, Herzing, Ro, Girotto, Caputo, Hoven, Schaible, Hexemer, DeLongchamp and Richter121 Accordingly, aggregation and crystallization of the small molecule are delayed from the solution phase to the final stages of film drying, with intermediate vitrification of the amorphous material taking place directly rather than indirectly through the preferred solvation of PC71BM out of the mixed phase, as is often seen in polymer:fullerene blends. The direct or indirect plasticization of semiconductor material in BHJ systems during film therefore results in two distinct pathways of morphology formation (see the discussion of P3HT:PCBM blends prepared using CN or DIO), with the favored route depending upon the solvent quality of the additive relative to the electron donor material.
C. Up-scaling of promising OPV systems
The different formation kinetics and final morphologies between spin-coated and bar- or blade-coated OPV films provide some insight into why a solar cell performance gap exists between each processing method. Specifically, champion OPVs are more likely to be demonstrated using spin-coating because of the ease with which uniform films can be realized over small (∼1 cm2) substrates. As with the commercialization of perovskite PVs, the challenge of maintaining performance parity when moving to a scalable solution deposition method is not simply a case of maintaining layer thickness parity, as this does not necessarily replicate the relatively rapid solvent loss characteristics and kinetically trapped morphologies of spin-coating. Furthermore, a processing factor that is exclusive to BHJ organic solar cells is the tolerance of high PCE values to multiple donor:acceptor morphologies. In situ studies on current state-of-the-art OPV blends have helped to rationalize these differences and provide a framework for the informed design of semiconductor ink formulations that are optimized for a given solution deposition process.
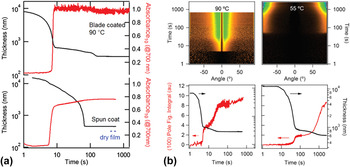
The electron donor copolymer poly[(5,6-difluoro-2,1,3-benzothiadiazol-4,7-diyl)-alt-(3,3‴-di(2-octyldodecyl)-2,2′;5′,2″;5″,2‴-quaterthiophen-5,5‴-diyl)] (PffBT4T-2OD) has been shown to exhibit PCE values above 10% when paired with several fullerene-derivative electron acceptors. Reference Liu, Zhao, Li, Mu, Ma, Hu, Jiang, Lin, Ade and Yan122 Because of the tendency of the copolymer to excessively aggregate in solution at ambient temperatures, blend films have to be deposited from hot (∼90 °C) solutions. This approach has a clear impact on the film drying time; however when moving from spin-coating to blade-coating, differences in film morphology do not necessarily translate to differences in solar cell PCE. The work by Ro et al. has shown that optimized blade-coated PffBT4T-2OD:PC71BM films have a preferential edge-on orientation of polymer crystallites compared to face-on orientation for spin-coated films Reference Ro, Downing, Engmann, Herzing, DeLongchamp, Richter, Mukherjee, Ade, Abdelsamie, Jagadamma, Amassian, Liu and Yan123 as well as a bimodal versus singular characteristic phase separation length-scale. These differences are partly explained by the controlled temperature history of the blade coated sample—spin-coating a hot solution is likely to result in a rapid and uncontrolled cooling process—that accelerates the onset of polymer aggregation [Fig. 20 part (a)]. The difference in polymer orientation can be understood by considering the preference and enhanced ability for dissolved PffBT4T-2OD to align edge-on with respect to the air interface, thereby minimizing its interface energy over a pre-formed aggregate. For optimized spin- and blade-coating procedures, both morphologies retained high phase purity and it was concluded that this factor was a key to realizing high PCEs, above 9% in each case.
(a) Comparison of film drying dynamics for PffBT4T-2OD:PC71BM blends prepared using CB/DIO solvent mixtures. Here, sample absorbance at 700 nm is used as a measure of PffBT4T-2OD aggregation. The data show that during blade coating the polymer undergoes aggregation at a higher film solid concentration (smaller thickness) than for spin-coated samples. Part (b) compares the differences in polymer lamella ordering and crystallite orientation during blade coating at 90 °C or 55 °C, where the lower temperature corresponds to a regime where polymer pre-aggregation in solution is favored. Note that the in situ GIWAXS figures are presented using a pole figure notation that clearly highlights variations in crystal orientation. Here an angle of 0° corresponds to the out-of-plane direction. Reference Ro, Downing, Engmann, Herzing, DeLongchamp, Richter, Mukherjee, Ade, Abdelsamie, Jagadamma, Amassian, Liu and Yan123 Reproduced by permission of The Royal Society of Chemistry.

The results clearly show that the different film formation dynamics give rise to distinct PffBT4T-2OD:PC71BM semiconductor layer morphologies. Although this is a fortuitous outcome in the context of identical OPV efficiencies, other polymer:fullerene blends require certain modifications to the casting semiconductor ink to achieve performance parity. Mixtures of poly[[4,8-bis[(2-ethylhexyl)oxy]benzo[1,2-b:4,5-b′]dithiophene-2,6-diyl][3-fluoro-2-[(2-ethylhexyl)carbonyl]thieno[3,4-b]thiophenediyl]] (PTB7):PC71BM fall into the category of OPV blends that are primarily optimized using solvent/solvent additive ink formulations, the mechanistic benefits of this approach have been discussed earlier. Here, however, the direct use of an ink formulation that is optimized for spin-coating does not afford good device efficiencies using blade-coating because of the excessively delayed onset of the additive-dominated evaporation regime in the latter, resulting in a BHJ morphology that is too finely mixed. Reference Zhao, Hu, Spada, Jagadamma, Yan, Abdelsamie, Yang, Yu, Munir, Li, Ndjawa and Amassian124 Whilst decreasing the concentration of the semiconductor blend ink for blade-casting provides a straightforward means to achieve thickness parity when all other processing parameters (such as substrate temperature, blade speed, and angle) are kept constant, correcting for differences in the additive-solute volume ratio is critical to replicating the nanostructures present in spin-coated films. For blends of PTB7:PC71BM and other high performance copolymer:fullerene pairings, Zhao et al. have shown that how performance parity in blade-coated layers was reached by increasing the DIO concentration from 3 vol% up to 6–9 vol%. The maximum efficiency obtained in this study for blade-coated solar cells—9.7%—is the highest for OPVs prepared using this deposition technique, confirming the benefits of their approach.
D. Structure evolution during film thermal and solvent annealing
Thermal and solvent annealing, as strategies for improving the efficiency of OPVs, have dropped in popularity since the growth of additive processing and solvent engineering. In general, subjecting a blend thin-film to either annealing treatment ripens the degree of phase separation between the constituent semiconductors, resulting in enhanced crystallization and aggregation as well as a modified phase composition (i.e., the volume fractions of pure and mixed material). When two different semiconductors are interfaced in a simple bilayer geometry, annealing can be used to activate intermixing; the information obtained from such experiments is highly valuable for determining semiconductor diffusion rates and equilibrium mixed-phase compositions. Reference Liu, Zhao, Tumbleston, Wang, Gu, Wang, Briseno, Ade and Russell114,Reference Collins, Gann, Guignard, He, McNeill and Ade125 For thermal annealing, these processes are activated when the temperature of the film exceeds certain values; for example, T g of the polymer or the onset temperature for small molecule crystallization. Thermal annealing also facilitates the loss of trapped solvent within the film, either at its boiling point or at temperatures exceeding T g. Reference Wang, Pearson, Lidzey and Jones126 In contrast, semiconductor phase separation and restructuring via solvent annealing are achieved by exposing the materials to a solvent vapor. Under these conditions, a semiconductor thin film swells due to the partial dissolution of solid material, resulting in enhanced chain and molecular mobilities. In a manner that is similar to the use of co-solvent deposition, solvent annealing in vapor that is orthogonal/of poor solubility to one blend component permits the sequential restructuring of the film; however the impact of this step is limited by the processing history of the sample, in particular the structures already formed during film casting.
For BHJ polymer:fullerene blends, the factors identified from in situ annealing measurements that are relevant to the growth modes and kinetics of polymer crystallites and fullerene aggregates have been recently reviewed elsewhere. Reference Pearson, Wang and Lidzey7 For small molecule:fullerene blends, Sharenko et al. combined in situ GIWAXS/GISAXS to study thin films of DPP(TBFu)2:PC71BM as well as films of neat DPP(TBFu)2 during a thermal anneal. Reference Sharenko, Kuik, Toney and Nguyen127 Across a broad composition range of 30–70 wt% fullerene loading, DPP(TBFu)2 crystallization was found to be the dominant driving force for phase separation in the blend, which facilitated improved charge carrier mobilities and overall solar cell efficiencies. By driving fullerene molecules into the mixed phase of the blend, this crystallization step resulted in enriched electron donor and electron acceptor domains in the film; this process being analogous to the evolution in morphology in polymer rich P3HT:PCBM blends during solution casting and thermal annealing. The observed increase in the cold-crystallization temperature of DPP(TBFu)2 with increasing PC71BM concentration—from 50 °C to 100 °C—was ascribed to a DPP(TBFu)2 dilution effect that results in a reduced density of crystal nucleation sites.
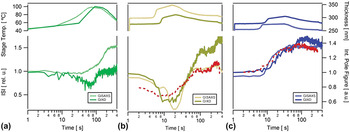
Morphology evolution in small molecule:fullerene blends during solvent vapor annealing was investigated by Engmann et al. Reference Engmann, Ro, Herzing, Snyder, Richter, Geraghty and Jones128 Here, thin films of benzodithiophene terthiophene rhodamine (BTR):PC71BM were subjected to brief (<1 min) periods of exposure to either CF or tetrahydrofuran (THF) vapors alongside a 110 °C thermal anneal (Fig. 21). Whilst CF is a good solvent for both semiconductors, THF is a poor solvent for PCBM. Reference Verploegen, Miller, Schmidt, Bao and Toney129 As a consequence, CF solvent annealing drives enhanced phase separation over THF annealing by efficiently dissolving amorphous material and relatively small crystallites. The limited ability of THF to dissolve small crystallites maintained a high density of nucleation sites within the blend, resulting in a balance between enhanced crystallization, domain purity, and overall phase separation. PCEs of up to 6.5% were realized for solar cells prepared via the TFH annealing route, which represented significant improvements over CF annealing (5.4%) and thermal annealing routes alone (3.4%).
In situ structural characterization data for thin film small molecule blends of BTR:PC71BM during annealing. The presented data show the evolution in GISAXS integrated scattering intensity (ISI)—sensitive to domain purity—and GIXRD integrated pole figure intensity—a probe of domain crystallinity—during thermal annealing (a), combined thermal/solvent annealing (CF for the first 15 s) (b) and combined thermal/solvent annealing (THF for the first 30 s) (c). Red lines correspond to fits of the GISAXS data using a two phase model consisting of pure BTR and a three-component mixed-amorphous phase of BTR, PC71BM, and solvent vapor. Reference Engmann, Ro, Herzing, Snyder, Richter, Geraghty and Jones128 Reproduced by permission of The Royal Society of Chemistry.

E. Relating film nanostructures to device evolution
For OPVs, the initial burn-in phase of device operation is relatively pronounced compared to other forms of emerging PV. Specifically, photocurrent densities and PCEs can decrease by several % over 10 s of hours of continuous simulated solar illumination. In operando structural measurements have provided some insight into this effect by probing a region of a device substrate that is close to, but not covered by, the metal electrode. GISAXS measurements using a focused X-ray beam (µ-GISAXS) by Buschbaum and co-workers were used to correlate reduced J SC values in P3HT:PCBM OPVs to a reduction in the donor acceptor interfacial area within the light harvesting layer, through the amalgamation of smaller domains into larger ones. Reference Schaffer, Palumbiny, Niedermeier, Jendrzejewski, Santoro, Roth and Müller-Buschbaum130 Here a model was constructed to predict the solar cell photocurrent based upon a domain size-dependent probability of charge generation, the output from which is presented in Fig. 22. A separate study showed the improved stability of inverted device structures relative to normal device structures; however the fundamental reason(s) for why the morphology was unstable in the first place remained unclear. Reference Wang, Schaffer, Song, Körstgens, Pröller, Indari, Wang, Abdelsamie, Bernstorff and Müller-Buschbaum131 Given the relatively low glass transition temperature of P3HT, it is plausible that the amorphous phase of the blend is unstable at the operating temperature of the solar cell. Reference Pearson, Wang, Jones, Lidzey, Staniec, Hopkinson and Donald117,Reference Hopkinson, Staniec, Pearson, Dunbar, Wang, Ryan, Jones, Lidzey and Donald132 For this reason, it may be the case that future in operando measurements consider the role of pre-aging treatments (e.g., light-soaking or annealing at modest temperatures Reference Li, Wong, Huang, Zhong, Tan, Tsoi, Kim, Durrant and Cabral133 ) in more detail, alongside the design of thermally stable semiconductor blends, as routes to realizing OPVs with greater operational lifetimes.
Comparison of measured (red line) and modeled (black squares) photocurrent values for a P3HT:PCBM OPV during burn-in. Parts (a)–(c) schematically illustrate the P3HT:PCBM blend nanostructure at different times, as determined through in situ µ-GISAXS measurements. In these figures, the red and green regions correspond to pure and mixed semiconductor phases of the dominant light absorber, respectively, where photons absorbed in these regions may be converted into free charge carriers (d). Figure reprinted with permission from Ref. Reference Schaffer, Palumbiny, Niedermeier, Jendrzejewski, Santoro, Roth and Müller-Buschbaum130. Copyright 2013 Wiley-VCH.

IV. SUMMARY & OUTLOOK
Time-resolved measurements of film structure and composition in situ of sample preparation have grown in popularity over the past few years to enhance our understanding of organic- and perovskite-semiconductor device processing. As key steps can now be identified in real-time of a process being carried out, research of this type is crucial for understanding how optimized semiconductor films are produced. As a consequence, the outcomes from these studies allow researchers to design new fabrication methods with greater awareness than characterizing a sample postproduction alone permits, thereby accelerating technology development and commercialization. Although perovskite and organic PV have fundamentally different modes of operation, an analysis of the recent literature from both areas highlights the importance of intermediate phases, both solid and liquid, in governing the final semiconductor film structure, as well as the sensitivity of such phases to the initial sample conditions. Given the growth in solvent engineering as the sole means of preparing high quality semiconductor films, it is likely that future studies on sample preparation will continue to investigate the interplay between different solution compositions and deposition conditions, to identify the crucial stages of film drying that must be replicated when moving to scalable manufacturing techniques. Furthermore, a subset of in situ studies have been devoted to understanding the mechanisms and kinetics of semiconductor film degradation, rather than film formation, demonstrating how these measurements can also be used to underpin research on PV stability.
A. Opportunities and challenges
The rapid pace of development in perovskite optoelectronics means that new semiconductor compositions are becoming readily available to researchers. In particular, the use of multiple A, B, and X components in state-of-the-art perovskite films (as well as in films of low-toxicity, as Pb removal would permit) raises questions about how films prepared using several precursors are formed. The role of perovskite grain orientation on sample optoelectronic properties is also only beginning to be understood, Reference Leblebici, Leppert, Li, Reyes-Lillo, Wickenburg, Wong, Lee, Melli, Ziegler, Angell, Ogletree, Ashby, Toma, Neaton, Sharp and Weber-Bargioni134,Reference Lilliu, Dane, Alsari, Griffin, Barrows, Dahlem, Friend, Lidzey and Macdonald135 and whilst differences in crystal alignment have been resolved dynamically in some of the studies reviewed here, there is currently no proposed framework for controlling this. Lastly, in the context of advanced film formation methods, state-of-the-art solvent removal processes are becoming relatively fast (sub-minute), Reference Noel, Habisreutinger, Wenger, Klug, Hörantner, Johnston, Nicholas, Moore and Snaith76,Reference Li, Bi, Yi, Decoppet, Luo, Zakeeruddin, Hagfeldt and Gratzel136 thus making it a challenge to accurately capture the important features in a time-resolved X-ray scattering measurement.
For OPVs, research into the dynamics of film formation is likely to continue to understand how BHJ nanostructures form during novel deposition methods. The use of high performance non-fullerene electron acceptors Reference Zhao, Qian, Zhang, Li, Inganäs, Gao and Hou137 and ternary semiconductor mixtures in contemporary champion solar cell devices will also motivate new studies as their crystallization and aggregation behavior is likely to differ from conventional binary polymer:fullerene or small molecule:fullerene blends. As noted in the discussion on solvent engineering, the glass transition temperature of the polymer—and its relation to the substrate and solution casting temperatures—remains an important parameter in the design of optimized deposition conditions. Likewise, the role of additives as selective or non-selective solvents will be a key to understanding how they can be mimicked when OPVs undergo scale-up and commercialization.
Finally, whilst organic and perovskite PV are at different stages of technological maturity, it is important to recognize that they each face similar issues relating to the use of hazardous materials and/or solvents during their fabrication. Additional challenges relating to the intrinsic stability of the semiconductor films, long-term device stability and performance gaps between proof-of-concept solar cells and small modules are also shared, suggesting that researchers working on either technology can learn from the in situ and in operando experiments taking place in each field. Indeed, for organic PV, a greater number of in situ studies have been carried out using scalable deposition methods (e.g., compact slot-die coaters and roll-to-roll processing systems that are relatively straightforward to install within an XRD or GIXRD setup) than for perovskites. Combined X-ray scattering, optical reflectivity, and absorption measurements are also at a more advanced stage of development, and by demonstrating how multiple techniques can be used to identify indirect measures of semiconductor crystallinity and nanostructure, the design of in-line tools for process monitoring can be supported.
ACKNOWLEDGMENTS
The author acknowledges support from the EPSRC through the grant EP/M024873/1 “Singlet Fission Photon Multipliers—Adding Efficiency to Silicon Solar Cells”.