Introduction
The sea-level history of oceanic, tectonically stable islands during the Holocene has strong implications for our understanding of the melting history of ice sheets, the rheological structure of the Earth’s mantle (e.g., Nakada, Reference Nakada1986; Mitrovica and Milne, Reference Mitrovica and Milne2002; Lambeck et al., Reference Lambeck, Rouby, Purcell, Sun and Sambridge2014), the development of coral reefs and reef islands, and the subsequent history of human settlement on these islands (e.g., McLean and Woodroffe, Reference McLean and Woodroffe1994; Dickinson, Reference Dickinson2003; Perry et al., Reference Perry, Kench, Smithers, Riegl, Yamano and O’Leary2011; Nunn, Reference Nunn2016). A late Holocene sea-level high stand is widely evident in the equatorial Indo-Pacific islands (Grossman et al., Reference Grossman, Fletcher and Richmond1998; Kench et al., Reference Kench, Smithers, McLean and Nichol2009), and the subsequent fall in sea level is inferred to have affected reef-island accumulation (e.g., Kayanne et al., Reference Kayanne, Yasukochi, Yamaguchi, Yamano and Yoneda2011; Yasukochi et al., Reference Yasukochi, Kayanne, Yamaguchi and Yamano2014).
The atoll reef islands in the west-central Pacific (Marshall Islands, Gilbert Islands of Kiribati, and Tuvalu) are oceanic, tectonically stable islands whose future stability is receiving increased attention under the threat of rising sea levels (e.g., Yamano et al., Reference Yamano, Kayanne, Yamaguchi, Kuwahara, Yokoki, Shimazaki and Chikamori2007; Webb and Kench, Reference Webb and Kench2010; Kench et al., Reference Kench, Thompson, Ford, Ogawa and McLean2015). McLean and Hosking (Reference McLean and Hosking1991) proposed a schematic model of reef and island response to sea-level change over the last 8000 yr, based on available radiocarbon dates from the Gilbert Islands and Tuvalu (Schofield, Reference Schofield1977; Kaplin, Reference Kaplin1981; Marshall and Jacobson, Reference Marshall and Jacobson1985). They suggested that sea level reached the modern position around 4500 yr ago, reef flats reached sea level around 4000 yr ago, and reef-island development took place from 2000 to 1000 yr ago. However, until now, no reliable late Holocene sea-level curve, which is the basis of discussion on island formation, has fully accommodated the Gilbert Islands of Kiribati or Tuvalu, although the late Holocene sea-level change, reef island formation, and human settlement history have been reported for the Marshall Islands (Kayanne et al., Reference Kayanne, Yasukochi, Yamaguchi, Yamano and Yoneda2011). By radiocarbon dating fossil corals and Tridacna shells at several locations, Schofield (Reference Schofield1977) showed that in the late Holocene, sea level in this region was approximately 2.4 m higher than at present, and also suggested that sea-level oscillations have occurred, with six transgressions during the last 5000 yr. Most of the dates reported by Schofield (Reference Schofield1977) were calculated from transported materials (e.g., cemented coral rubble deposits); therefore, a paleo-sea level reconstruction based on more reliable sea-level indicators (e.g., in situ fossil coral microatolls; Meltzner and Woodroffe, Reference Meltzner and Woodroffe2015) is required. Other researchers have suggested the existence of fossil in situ Heliopora in the Gilbert Islands (Tarawa Atoll and Makin, Fig. 1; McLean and Woodroffe, Reference McLean and Woodroffe1994; Falkland and Woodroffe, Reference Falkland and Woodroffe1997; Woodroffe and Morrison, Reference Woodroffe and Morrison2001), but the sea-level history has not been examined in detail. Therefore, the aim of this study was to update the late Holocene sea-level curve for the Gilbert Islands of Kiribati based on reliable sea-level indicators and a re-examination of the past literature.
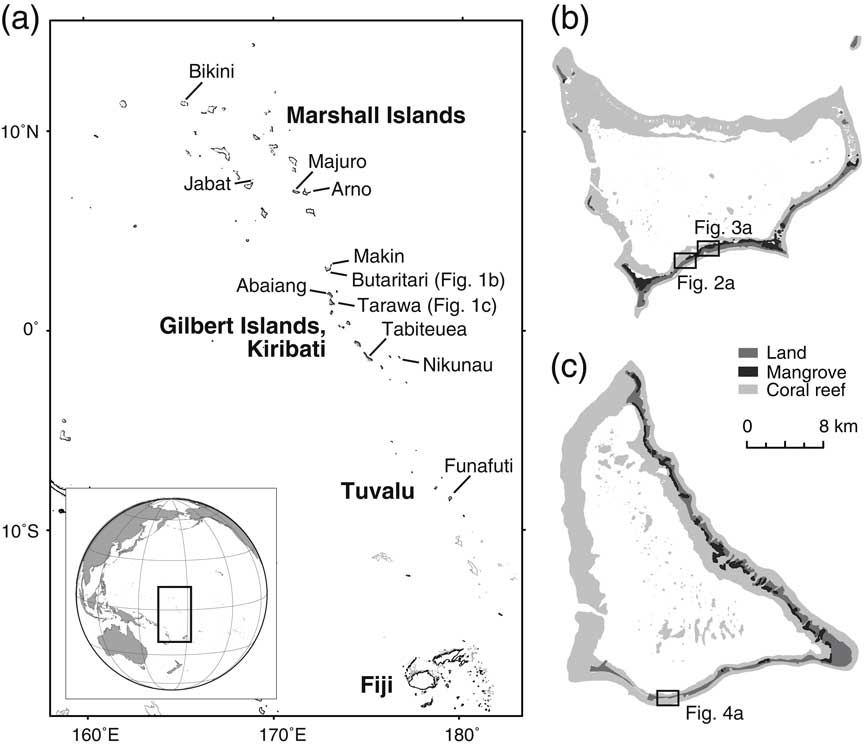
Location of the study area. (a) Location of atolls and islands mentioned in the text. Maps of (b) Butaritari and (c) Tarawa atolls. Coral reef and mangrove map data are from Andréfouët et al. (Reference Andréfouët, Muller-Karger, Robinson, Kranenburg, Torres-Pulliza, Spraggins and Murch2006) and Environment and Conservation Division of Kiribati (2011), respectively.

METHODS
Sampling sites
Emergent coral reef pavements and microatolls were found at four sites on the Tarawa and Butaritari atolls, Gilbert Islands, Kiribati (Fig. 1). Three of the four sites were newly discovered in the present study. Porites microatolls, often used to reconstruct paleo-sea level (e.g., Kayanne et al., Reference Kayanne, Yasukochi, Yamaguchi, Yamano and Yoneda2011; Woodroffe et al., Reference Woodroffe, McGregor, Lambeck, Smithers and Fink2012; Meltzer and Woodroffe, Reference Meltzner and Woodroffe2015), were observed at our study sites. In addition, we observed Heliopora colonies forming microatolls with flat surfaces (e.g., Tracey and Ladd, Reference Tracey and Ladd1974; Chappell and Polach, Reference Chappell and Polach1976; Harii et al., Reference Harii and Kayanne2003). As with Porites, the development of flat surfaces of Heliopora microatolls is controlled by sea level (Harii et al., Reference Harii and Kayanne2003), because the flat surfaces develop due to the restriction of upward growth when the coral reaches the air–water interface. Heliopora microatolls are therefore also a reliable indicator of paleo-sea level (Tracey and Ladd, Reference Tracey and Ladd1974). We measured the elevations of each microatoll and collected samples with hammer and chisel.
Site B-1
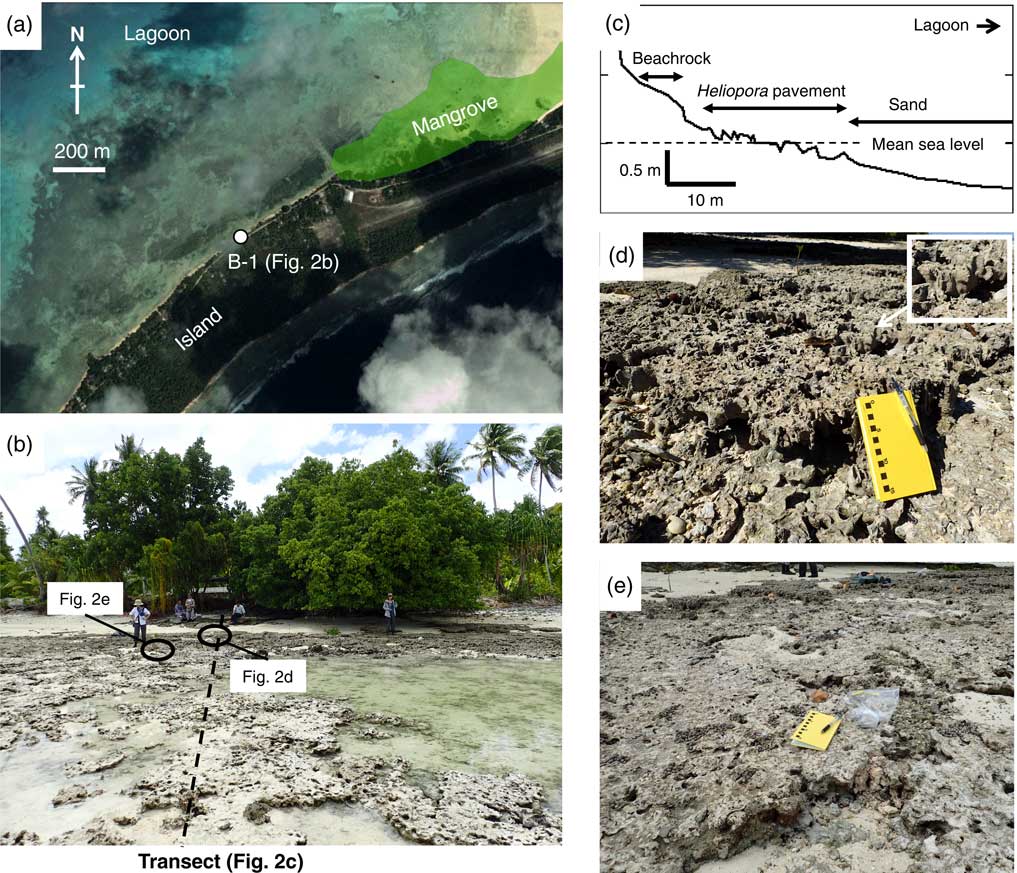
An emergent reef pavement formed by an aggregation of fossil Heliopora microatolls was found on the lagoon side of south Butaritari Atoll (03°05.0′N, 172°48.1′E), with an area of ca. 500 m2 (Fig. 2). It is fully exposed (Fig. 2b), and lacks the upper unit of cemented coral rubble that is found elsewhere in the Gilbert Islands (McLean and Woodroffe, 1994; Woodroffe and Morrison, Reference Woodroffe and Morrison2001). The fossil Heliopora microatolls vary in their surface elevation, and our leveling survey indicated higher surface elevations close to the shore (Fig. 2c). We collected four Heliopora microatoll specimens from the edges of microatolls with various elevations (Table 1).
(color online) Location of site B-1 on Butaritari Atoll. (a) Google Earth image was overlain with a mangrove area polygon (Environment and Conservation Division of Kiribati, 2011). (b) Photograph of the fossil Heliopora pavement at B-1. (c) Topographic profile from the shore to the lagoon, crossing the Heliopora pavement. (d) Heliopora microatolls at the highest elevation, showing distinct colony branches and the preserved surface structure at the outer margin (inset). (e) The surface structures of Heliopora microatolls at lower elevations are relatively poorly preserved.

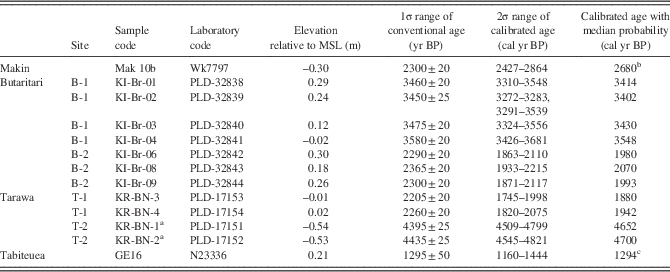
Radiocarbon ages of fossil corals on the Gilbert Islands, Kiribati.

Notes: See Methods for calibration details.
a KR-BN-1 and KR-BN-2 are Porites; all others are Heliopora.
b Date from Woodroffe and Morrison (Reference Woodroffe and Morrison2001).
c Date from Schofield (Reference Schofield1977).
Site B-2
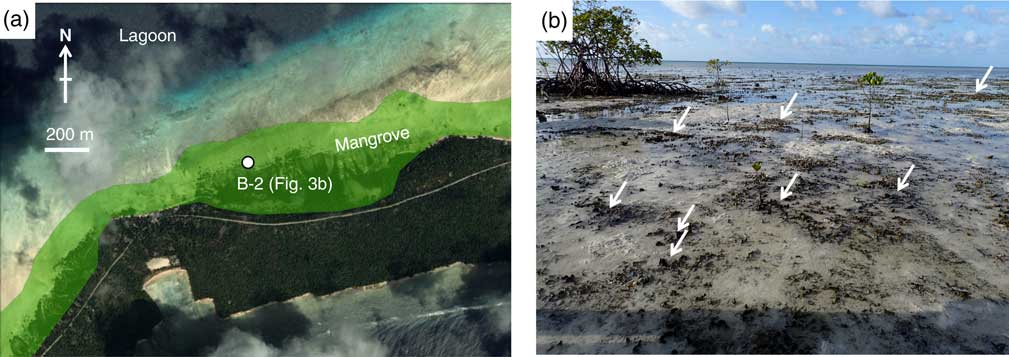
An extensive aggregation of fossil Heliopora microatolls was found on the lagoon side of a mangrove forest at south Butaritari Atoll (03°05.9′N, 172°49.6′E; Fig. 3 and 3b). They were almost buried by sand, and only the tips of the branches were exposed. The area could not be determined because of the burial of the microatolls in sand. As with B-1, the surface elevations were higher close to the shore. We collected three Heliopora microatoll specimens from the edges of microatolls with various elevations (Table 1).
(color online) Location of site B-2 on Butaritari Atoll. (a) Google Earth image overlain with a mangrove area polygon (Environment and Conservation Division of Kiribati, 2011). (b) Photograph of fossil Heliopora microatolls buried by sand. Tips of Heliopora branches are indicated with arrows.

Site T-1
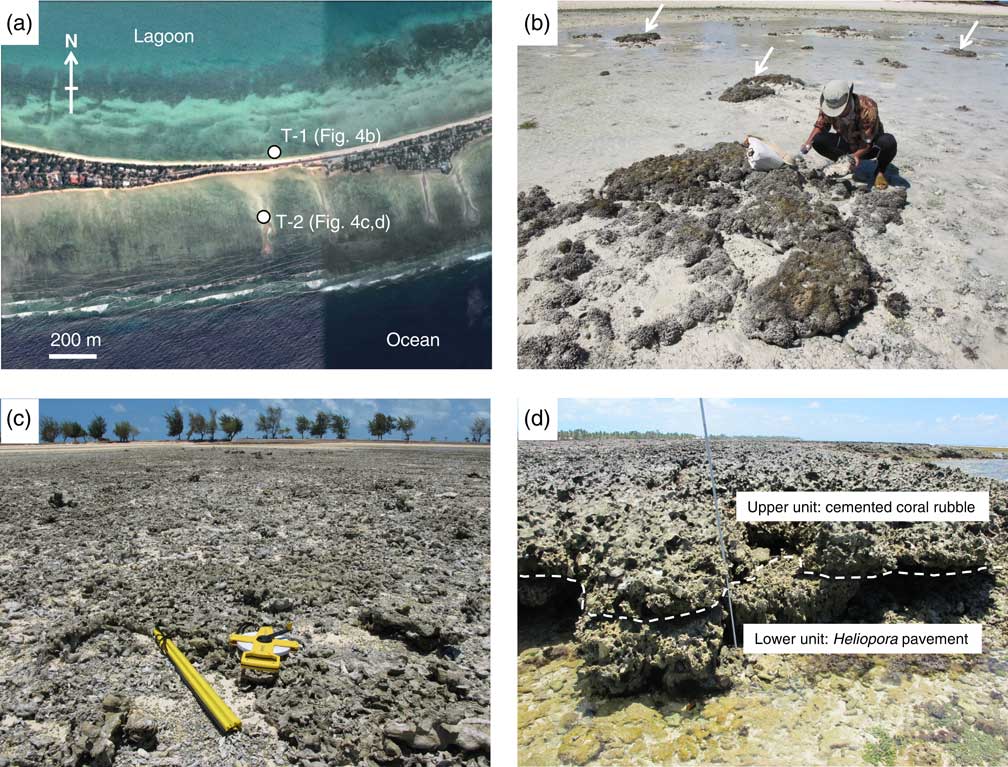
A scattered distribution of fossil Porites microatolls, with diameters of up to ~2 m, was observed on a sand apron on the lagoon side close to a causeway at South Tarawa (01°19.3′N, 172°59.5′E; Fig. 4 and 4b). Their surfaces had similar elevations. Although they were almost completely buried by sand and their surfaces were covered with macroalgae, they retained their surface structures. We collected two Porites microatoll specimens from the edges of the microatolls (Table 1).
(color online) Locations of sites T-1 and T-2 on Tarawa Atoll. (a) Google Earth image. (b) Photograph of Porites microatolls at T-1. Microatolls are indicated by arrows. (c) Photograph of Heliopora pavement at T-2. (d) Photograph of the oceanward pavement covered by cemented coral rubble. Broken line indicates the boundary between the upper unit (cemented coral rubble) and lower unit (Heliopora pavement).

Site T-2
This site (01°19.6′N, 172°59.5′E; Fig. 4) was described by McLean and Woodroffe (Reference McLean and Woodroffe1994, p. 285) as “extensive areas of fossil Heliopora reef exposed on modern reef flats of southern Tarawa.” This reef pavement is an aggregate of Heliopora microatolls (Fig. 4c), and the oceanward side is covered by heavily cemented disoriented coral rubble (Fig. 4d). Similar features may occur elsewhere in the Gilbert Islands. Woodroffe and Morrison (Reference Woodroffe and Morrison2001, p. 251) found conglomerate on a reef flat at Makin and noted that “the conglomerate comprises two distinct units; the lower contains upright, columnar fossil branches of the blue octocoral Heliopora, and the upper is a heavily cemented unit containing disoriented coral rubble.” We collected two Heliopora microatoll specimens from the edges of the microatolls (Table 1).
Examining elevations
All four sites are open to the ocean or a lagoon, meaning that no local ponding occurred during low tides. To reconstruct the paleo-sea levels, the surface elevations of both the fossil microatolls and the modern microatolls were measured, following Meltzner and Woodroffe (Reference Meltzner and Woodroffe2015), so that the former sea level is estimated through the difference in elevation between the fossil and the modern microatolls. The elevations of modern microatolls were determined by the mean and standard deviation (1-sigma) of those of eight living microatolls found in our study sites. Although annual sea-level variability due to ENSO has been inferred from changes in the vertical height of surface annuli of modern Porites microatolls at Abaiang Atoll in the Gilbert Islands (Flora et al., Reference Flora, Ely and Flora2009), we could not detect such signature in the fossil microatolls. This is probably because the Porites microatolls were covered by macroalgae and Heliopora branches do not form prominent annuli. Microatoll elevations were determined during sampling via levelling surveys at B-1, T-1, and T-2, while microatoll elevations at B-2 and modern microatolls were measured from sea level using a folding scale or a leveling rod. All the elevations were measured with reference to the sea level when the survey was conducted, and were then reduced to the mean sea level (MSL) based on a SEAFRAME gauge set on the lagoon side of Betio Island, Tarawa Atoll (1.644 m above the tide gauge zero; Australian Bureau of Meteorology, 2010), using hourly observed sea-level data provided by the SEAFRAME gauge (http://www.bom.gov.au/oceanography/projects/spslcmp/data/index.shtml). The data reveal a semi-diurnal tide, suggesting that no ponding occurred in Tarawa lagoon during low tide, as is observed in some semi-enclosed lagoons (e.g., Kinsey, Reference Kinsey1972; Kayanne et al., Reference Kayanne, Suzuki and Saito1995). This is probably because the prominent channel in the western part of the atoll (Fig. 1b) allows for water exchange between the lagoon and the ocean. The Butaritari lagoon is expected to exhibit a similar semi-diurnal pattern, given the presence of prominent channels on the western part of the atoll (Fig. 1b). Thus, the elevations of the microatolls in our study should be suitable to indicate sea level in the ocean, after further examination as described below.
We examined the surface structures of the fossil Heliopora, because these corals have columnar branches that more readily undergo postmortem erosion than those of massive Porites. On the ocean side of Tarawa Atoll, we found Heliopora reef pavement covered by heavily cemented disoriented coral rubble at T-2 (Fig. 4d). Coral rubble is transported from oceanward reef slopes primarily by storm (e.g., Maragos et al., Reference Maragos, Baines and Beveridge1973), which implies possible truncation of Heliopora during the storm event, although erosional lowering after the storm is considered unlikely because it is topped by a veneer of coral rubble. A similar feature was found by Woodroffe and Morrison (Reference Woodroffe and Morrison2001), who observed contact between the lower (Heliopora) and upper (cemented coral rubble) units.
Although no upper unit was present at B-1 or B-2 on the lagoon side of Butaritari Atoll, there were variations in the surface elevations of the fossil Heliopora microatolls (Fig. 2c). Microatolls are coral colonies with living outer margins but with flat, dead upper surfaces constrained by low water levels (Meltzner and Woodroffe, Reference Meltzner and Woodroffe2015). We assume that microatolls with surface structure (i.e., corallites) at their outer margins did not suffer from postmortem erosion. Based on the surface structure of the outer margins of the microatolls (Fig. 2d and e), as well as the preservation of the whole colony branches, we infer that the microatolls at the highest elevations at both B-1 and B-2 had not been significantly eroded and were therefore reliable indicators of paleo-sea levels. We also considered that the Porites microatolls at T-1 had not been significantly eroded, as inferred from the preservation of their surface structures and the similar elevations among the microatolls.
Age determination
Radiocarbon dating was performed on the fossil coral microatoll samples (Table 1). X-ray diffraction analysis showed no evidence of any diagenetic alteration of the coral specimens. All the age determinations were made by Paleo Labo Co., Ltd (Saitama, Japan). The radiocarbon age data were corrected for carbon isotopic fractionation and calibrated to calendar years BP using the software Calib version 7.1 (Stuiver et al., Reference Stuiver, Reimer and Reimer2017) with the Marine13 dataset (Reimer et al., Reference Reimer, Bard, Bayliss and Beck2013). We estimated the marine reservoir effect at the Gilbert Islands based on Paulay and Kerr (Reference Paulay and Kerr2001), who showed conventional radiocarbon ages of 410±60 yr BP and 420±60 yr BP for two Porites cylindrica specimens collected at Abaiang Atoll in the 1860s. The ΔR values were calculated to be –72±60 yr and –62±60 yr with reference to the marine reservoir correction database (Reimer and Reimer, Reference Reimer and Reimer2001). We used the mean and mean standard deviation, –67±42 yr, as the ΔR value for the Gilbert Islands.
We also calibrated the radiocarbon ages reported for late Holocene to reconstruct late Holocene sea-level change (Schofield, Reference Schofield1977) and to infer the reef island development (Woodroffe and Morrison, Reference Woodroffe and Morrison2001) and human settlement history of the Gilbert Islands (Takayama and Takasugi, Reference Takayama and Takasugi1988; Di Piazza, Reference Di Piazza1999). Notably, we re-examined the Gilbert Island samples reported by Schofield (Reference Schofield1977). Of 10 samples (GE11–GE20), we accepted only one age for Heliopora at Tabiteuea Atoll (sample GE16) as a reliable indicator of past sea levels, because this was the only in situ sample from the Gilbert Islands. Schofield’s dates were based on the actual 14C half-life (5730 yr) rather than the Libby half-life (5568 yr), so the Heliopora age was corrected by dividing the age by 1.029 (=5730 / 5568 yr), as suggested by Stuiver and Reimer (Reference Stuiver and Reimer1993) and Grossman et al. (Reference Grossman, Fletcher and Richmond1998). Because the δ13C value was not available for this sample, we assumed the value of –1‰ for marine carbonate (Stuiver and Polach, Reference Stuiver and Pollach1977). Furthermore, although there was no description of the elevation of sample GE16 by Schofield (Reference Schofield1977), other than “low tide”, we assumed the datum was relative to the spring low tide, because those of other samples (e.g., GE9 at Tuvalu, Schofield, Reference Schofield1977, p. 519) were measured relative to spring low tide. For consistency, all the carbonate 14C ages of Schofield (Reference Schofield1977), as well as those of Woodroffe and Morrison (Reference Woodroffe and Morrison2001) and Takayama and Takasugi (Reference Takayama and Takasugi1988), were calibrated to cal yr BP, based on the procedure described above, whereas we used the IntCal13 dataset (Reimer et al., Reference Reimer, Bard, Bayliss and Beck2013) for the charcoal 14C ages of Di Piazza (Reference Di Piazza1999). The radiometric ages discussed are the values with median probability.
RESULTS AND DISCUSSION
Sea-level indicators and updated late Holocene sea-level curve
The fossil coral microatolls had similar ages within each site, although the difference in elevation within a single site reached up to 0.31 m and 0.12 m at B-1 and B-2, respectively (Table 1). Age clusters were recorded at 4700 (T-2), 3500–3400 (B-1), and 2000–1900 cal yr BP (T-1 and B-2). The ages within each cluster overlap within the 2σ range (95% confidence interval), indicating that the reef pavements and microatolls are homochronous features at each site. This supports our observation that the lower elevations of the Heliopora microatolls at B-1 and B-2 (KI-Br-03, KI-Br-04, and KI-Br-08) were the result of postmortem erosion. Because the microatolls at T-2 and at Makin (Woodroffe and Morrison, Reference Woodroffe and Morrison2001) might have been truncated during storms, the reliable sea-level indicators among our samples were the Porites microatolls at T-2 (KR-BN-1 and KR-BN-2) and the Heliopora microatolls with higher elevations at B-1 and B-2 (KI-Br-01, KI-Br-02, KI-Br-06, and KI-Br-09). The Heliopora at Tabiteuea Atoll, which yields an age of 1294 cal yr BP (Table 1), could be another reliable indicator of paleo-sea level. Its age may be inaccurate because of minor contamination by secondary aragonite (Schofield, Reference Schofield1977), which would reduce its apparent age relative to its actual age.
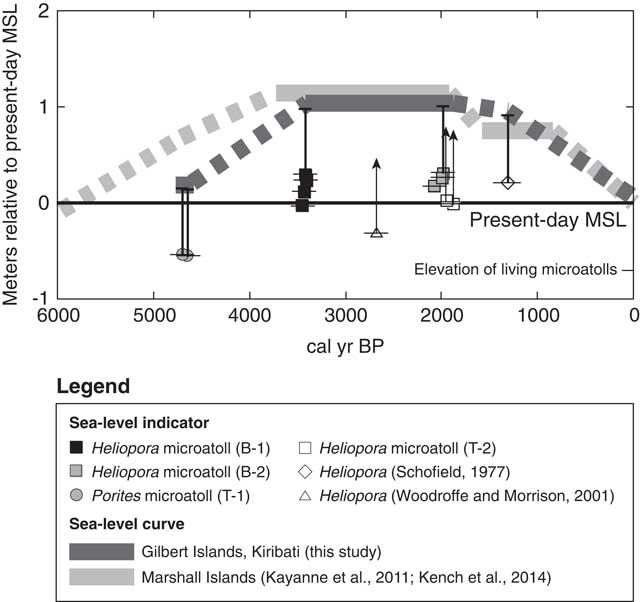
The elevations of the living microatolls are 0.70±0.04 m below MSL, which is consistent with the elevations of living microatolls at Majuro Atoll, Marshall Islands (0.73±0.06 m below MSL; Kayanne et al., Reference Kayanne, Yasukochi, Yamaguchi, Yamano and Yoneda2011). The mean paleo-sea levels were 0.17±0.04 m, 0.99±0.04 m, and 1.00±0.04 m at 4700, 3414, and 1980 cal yr BP above the present level, respectively (Table 1). The late Holocene sea-level change may have been constant or oscillating. Sea-level oscillations in the late Holocene have been inferred from the Great Barrier Reef of Australia (Baker and Haworth, Reference Baker and Haworth2000; Lewis et al., Reference Lewis, Wüst, Webster and Shields2008) and Fiji (Nunn, Reference Nunn2000). On the other hand, Woodroffe et al. (Reference Woodroffe, McGregor, Lambeck, Smithers and Fink2012) reported negligible sea-level oscillations during the past 5000 yr in the mid-Pacific (Kiritimati Island) based on extensive examinations of fossil Porites microatolls (n>100). Because the Gilbert Islands and Kiritimati Island are characterized by similar oceanic settings and far from former ice sheets, we could tentatively infer a relatively stable late Holocene sea level.
From these data, we infer that a sea-level high stand, approximately 1.0 m above the present level, occurred at ~3500–1900 cal yr BP (Fig. 5), although sea-level oscillations might have occurred between the age clusters (3500–3400 and 2000–1900 cal yr BP), as represented by the Heliopora at Makin (Woodroffe and Morrison, Reference Woodroffe and Morrison2001) that could show sea-level high stand lower than 1.0 m. Before this high stand, a possibly stable sea level, at approximately 0.17 m above the present level, occurred at ~4700 cal yr BP. A fall in sea level after 1900 cal yr BP is plausible, but its timing and magnitude depend on the age of the Heliopora sample of Schofield (Reference Schofield1977). Falkland and Woodroffe (Reference Falkland and Woodroffe1997) showed that the fossil corals in Tarawa are typically 0.7–0.8 m above their modern living counterparts, which suggests a sea-level high stand of 0.7–0.8 m. These values could be minimal estimates, because their fossil corals were derived from a reef pavement identical or similar to that at T-2, which could have been eroded, causing an apparent sea-level high stand of 0.7–0.8 m to be estimated (Fig. 5).
Reconstructed sea-level curve for the late Holocene at the Gilbert Islands, Kiribati, together with sea-level indicators. Horizontal bars indicate 2-sigma ranges of radiocarbon ages. Vertical bars indicate the elevation differences between the present-day mean sea level (MSL) and modern microatolls. Arrows indicate the sea level that is assumed to be above the arrowhead because the corals could have suffered from postmortem erosion and truncation (see text).

Our updated late Holocene sea-level curve for the Gilbert Islands is consistent with that for the Marshall Islands (Kayanne et al., Reference Kayanne, Yasukochi, Yamaguchi, Yamano and Yoneda2011; Kench et al., Reference Kench, Owen and Ford2014), which showed a sea-level rise until 3700 cal yr BP, a sea-level high stand of ~1.1 m above the present level ~3700–2000 cal yr BP, and a subsequent sea-level fall (Fig. 5), based on information from fossil microatolls at Bikini, Majuro, and Arno atolls and Jabat Island. This suggests the general applicability of the sea-level curve to the west-central Pacific, including Tuvalu (Ellice Islands) and Fiji, where late-Holocene sea-level high stands have been reported (Miyata et al., Reference Miyata, Maeda, Matsumoto, Matsushima, Rodda, Sugimura and Kayanne1990; Dickinson, Reference Dickinson1999; Nunn, Reference Nunn2000; Nunn and Peltier, Reference Nunn and Peltier2001). In particular, our results encourage a re-examination of the timing and magnitude of the late Holocene sea-level high stand at Tuvalu, where a late Holocene sea-level high stand of approximately 2.4 m above the present level has been inferred based mainly on cemented coral rubble deposits (Schofield, Reference Schofield1977; Dickinson, Reference Dickinson1999). David and Sweet (Reference David and Sweet1904) reported the occurrence of extensive fossil Heliopora reefs at Funafuti Atoll, and their careful examination could present a more reliable sea-level history for Tuvalu.
Implications for reef island development and human settlement
Late Holocene sea-level change has strongly affected the formation of reef flats and reef islands (McLean and Hosking, Reference McLean and Hosking1991; McLean and Woodroffe, Reference McLean and Woodroffe1994; Perry et al., Reference Perry, Kench, Smithers, Riegl, Yamano and O’Leary2011). Yamano (Reference Yamano2002) suggested that sea-level fall in the late Holocene not only enhanced the deposition of storm-generated coral rubble on reef flats, but also caused the change in reef-building organisms on the reef crest from corals to foraminifera. This is a result of subaerial exposure at low tide due to shallowing of the reef flat. The sea-level history and reef island formation in the Gilbert Islands warrants examination. The study of Woodroffe and Morrison (Reference Woodroffe and Morrison2001) is the only one to examine the reef island development in the Gilbert Islands based on radiocarbon dating of island sediments. Because the materials composing reef islands are the products of reef-building organisms (e.g., coral and benthic foraminifera) distributed on adjacent reef flats, and are transported to the reef platform where they accumulate and build reef islands, it is difficult to obtain precise dates for island formation. The tests of large shallow-water benthic foraminifera (e.g., Baculogypsina sphaerulata and Calcarina gaudichaudii) with spicules still attached should be suitable for dating, and can be used to infer the age of formation of the facies in which they are contained, because the foraminifera would have been transported from their original habitats by currents soon after their death (Yamano et al., Reference Yamano, Kayanne and Yonekura2001, Reference Yamano, Cabioch, Chevillon and Join2014; Weisler et al., Reference Weisler, Yamano and Hua2012; Dawson et al., Reference Dawson, Smithers and Hua2014; Yasukochi et al., Reference Yasukochi, Kayanne, Yamaguchi and Yamano2014). Woodroffe and Morrison (Reference Woodroffe and Morrison2001) dated the foraminifera tests in island sediment at Makin to 2530 cal yr BP. Although no preservation data for the foraminiferal spicules were available in that study, it is likely that the island began to form when sea level was ~1.0 m higher than the present level (Fig. 5).
This suggests that a post-high-stand fall in sea level was not a prerequisite to initiate the formation of the Makin islands, as demonstrated elsewhere in the Indo-Pacific in the Maldives (Kench et al., Reference Kench, McLean and Nichol2005), Marshall Islands (Weisler et al., Reference Weisler, Yamano and Hua2012; Kench et al., Reference Kench, Owen and Ford2014) and New Caledonia (Yamano et al., Reference Yamano, Cabioch, Chevillon and Join2014). In contrast, the Great Barrier Reef (Kench et al., Reference Kench, Smithers and McLean2012) and Marshall Islands (Kayanne et al., Reference Kayanne, Yasukochi, Yamaguchi, Yamano and Yoneda2011; Yasukochi et al., Reference Yasukochi, Kayanne, Yamaguchi and Yamano2014) formed under falling sea levels. As suggested by Kench et al. (Reference Kench, Smithers and McLean2012), there is no single model linking Holocene sea-level change to reef development and island building, although there is a critical water depth at which sediment production is enhanced, making sediment available for subsequent transport to reef islands. Nunn (Reference Nunn2016) further suggested that in the case of an adequate sediment supply, the importance of accommodation space for reef-island development depends on the stage of reef development and sea level.
The oldest human settlement date inferred from artificial remains at the Makin reef island is 1449 cal yr BP (Takayama and Takasugi, Reference Takayama and Takasugi1988), suggesting that human settlement occurred after the establishment of the main body of the island (Woodroffe and Morrison, Reference Woodroffe and Morrison2001). Di Piazza (Reference Di Piazza1999) found evidence of the earliest known human settlement in the Gilbert Islands (2025 cal yr BP and 1790 cal yr BP) in charcoals from an earth oven excavated on the reef island of Nikunau. Because the geomorphic development of Nikunau island has not yet been examined, a collaboration of geomorphological and archaeological surveys, combined with sea-level reconstruction, could reveal the times of island emergence and human settlement, as demonstrated by Kayanne et al. (Reference Kayanne, Yasukochi, Yamaguchi, Yamano and Yoneda2011) for the Marshall Islands. Our updated sea-level curve provides a baseline from which to understand the evolution of reef flats and reef islands, and allows further discussion of the first human settlement on the islands, not only at Nikunau and Makin, but also in the west-central Pacific.
ACKNOWLEDGMENTS
Our sincere thanks go to Mr. Anote Tong, the former President of the Republic of Kiribati, Ministry of Environment, Lands and Agriculture Development of the Republic of Kiribati Government, Mr. Minoru Abe (Alice Enterprises Inc., Kiribati), and Mr. Fumio Kinoshita (Japan International Cooperation Agency) for field, logistic, and moral support. Mr. Hiroaki Takasugi (Arc Fieldwork System Co., Ltd, Japan) provided information on the Makin excavation. Ms. Fumi Hayashi helped draw Figure 1. Comments and suggestions from the editors (Drs. Barbara Mauz and Derek Booth) and reviewers (Drs. Patrick Nunn and Colin Woodroffe) helped improve an earlier version of the manuscript. This research was supported by the Strategic Research and Development Fund of the Ministry of the Environment, Japan (project nos A-0805 and S-14), and an International Environmental Activities Grant from the National Institute for Environmental Studies, Japan.