


1. Introduction
Public perceptions matter in politics, particularly in representative democracies. They provide the basis for effective accountability and control of elected officials, after all. Not surprisingly, a large and growing body of research examines public responses to objective conditions, much of it focused on the economy. This research finds that the public does update its perceptions based on changing conditions (Lewis-Beck et al., Reference Lewis-Beck, Martini and Kiewiet2013; Wlezien, Reference Wlezien2015; Wlezien et al., Reference Wlezien, Soroka and Stecula2017). When the economy gets better (worse), people notice and adjust their perceptions accordingly, i.e., upward (downward).
Economic conditions are known to be especially important for public judgments of governments: incumbent politicians around the world are punished (rewarded) by voters for a poorly (well) performing economy.Footnote 1 While the general pattern is clear, it is less obvious how exactly economic developments filter into evaluations. We know that for the objective economy to be influential, people must have reasonably accurate information about it. But what does the public make of a 0.5% increase in GDP or a 4% increase in inflation? What makes this information “good” or “bad”? Some scholars argue that when it comes to voting, the effects of economic conditions are relative, moderated by comparison, for instance to what is happening in other countries (Powell and Guy, Reference Powell and Guy1993; Kayser and Peress, Reference Kayser and Peress2012; Hansen et al., Reference Hansen, Olsen and Bech2015) or in the same country in the recent past (Aytaç, Reference Aytaç2018).Footnote 2
This emerging research—and the associated debate—has potentially important implications for public opinion research because it raises the possibility that preexisting perceptions of social conditions are a source of heterogeneity in public responsiveness to changing conditions. What remains unclear is whether and to what extent benchmarking to the recent past influences how people update their perceptions based on new information. Do people react differently to equivalent “shocks” in conditions depending on perceptions of the conditions themselves, namely, whether they are seen as good or bad? For example, are they more likely to respond to a positive shock when times are perceived to have been bad rather than good? Or to a negative shock when times have been viewed as good instead of bad? These questions are important to answer because doing so may help us understand variation in responsiveness to new information that we observe but cannot explain based on existing models. That responsiveness matters in a variety of ways for both economics and politics.
Finding that prior perceptions of social conditions moderate how people update views of those conditions would comport with established literature in psychology on decision-making. This research shows that information contrasting with expectations stands out and weighs more heavily in subsequent judgments (Johnson and Busemeyer, Reference Johnson and Busemeyer2005; Stewart et al., Reference Stewart, Chater and Brown2006; Vlaev et al., Reference Vlaev, Chater, Stewart and Brown2011). An implication is that when the status quo is perceived to be bad (good), additional bad (good) news is less noteworthy, and increasingly so as conditions worsen (improve). If individuals systematically update their perceptions in this way, the tendency should emerge at the macro-level when we consider patterns of responsiveness in aggregate public perceptions.
To investigate the possibility, we consider the question: How do people update their perceptions of conditions? We are especially interested in how priors about conditions matter: Do people effectively consider the past when responding to new information? Do they do so on a (fairly) continuous basis? And how exactly do prior perceptions matter? We begin with a review of research on public responsiveness to information, some of which points to heterogeneity associated with different types of shocks—whether positive or negative—but not to prior perceptions of conditions. We then outline how and why we might expect heterogeneity in responses to similar shocks based on differences in perceptual circumstances. We next turn to an empirical analysis that builds directly on previous research relating economic indicators and the public’s perceptions of economic conditions in the United States. Results reveal that preexisting perceptions powerfully moderate the public response to economic change; indeed, new information appears to matter either a great deal or not at all, depending on when it takes place. The results have important implications for politics and other aspects of social life, which we consider in the concluding section.
2. Benchmarking in public perceptions
Most of the vast literature on how sociopolitical conditions matter for aggregate perceptions and political judgments assumes that new information has homogeneous effects (Durr, Reference Durr1993; Wlezien, Reference Wlezien1995; Stevenson, Reference Stevenson2001; Erikson et al., Reference Erikson, Mackuen and Stimson2002; Soroka and Wlezien, Reference Soroka and Wlezien2010). Consider research on government approval and election outcomes, in which economic growth is a common independent variable, and most models posit little heterogeneity in the effect of new information, or else do not test for it, putting aside the size of shocks, of course.Footnote 3 Thus, a two percent increase is expected to have twice the effect of a one percent increase, and exactly the opposite effect of a two percent decrease, at least assuming zero growth is the neutral point. Moreover, that hypothetical two percent increase has identical positive effects regardless of circumstances—whether we are coming out of a recession, experiencing a boom, or plodding along somewhere in between. Those circumstances and public perceptions of them are irrelevant.
Soroka (Reference Soroka2014) pushed back against some of these assumptions, specifically as regards different types of shocks, positing that positive and negative information affects people differently. His idea is that because humans are risk-averse, prioritizing losses over gains, negative information would have a larger effect on (media coverage and) public perceptions than the equivalent amount of positive information. Moreover, he demonstrated that this differential pattern of responsiveness is a widely shared general tendency, not the purview of a small subgroup of people, and is not confined to particular places or times (Soroka et al., Reference Soroka, Fournier and Nir2019).Footnote 4
Another branch of research argues that reference points are an important part of how the public makes sense of new economic information, at least when evaluating incumbent governments prior to voting. Some of this work focuses on cross-national benchmarking (Powell and Guy, Reference Powell and Guy1993; Kayser and Peress, Reference Kayser and Peress2012; Hansen et al., Reference Hansen, Olsen and Bech2015; Park, Reference Park2019). The idea here is that people are guided by news that makes comparisons with other countries when reporting on economic developments and consequently evaluate economic changes in a relative way. Because of this, the electoral effects of economic change within a country depend on what is happening in other countries. Positive developments, thus, might actually lead to fewer votes for incumbents if other countries are outperforming the domestic economy.
Aytaç (Reference Aytaç2018) builds on this scholarship with a “reference point theory” of economic voting, arguing that, in addition to making international comparisons, voters benchmark against past performance domestically when assessing whether incumbent politicians have done a good job managing the economy. Consistent with this idea, he finds that relative performance—measured by comparing economic growth during the current incumbency term to growth over the previous term—is a better predictor of the incumbent vote than election-year growth. In theory, therefore, an incumbent could gain votes even with a poorly performing economy so long as the downturn is less steep than it was during the previous term. Olsen (Reference Olsen2017) advances a similar argument but in the context of evaluations of organizational performance, fielding experiments to test if people draw comparisons to the past or external reference points. His findings suggest that external reference points are a stronger moderator of attitudes, though both types of comparisons impact evaluations.
Arel-Bundock et al. (Reference Arel-Bundock, Blais and Dassonneville2021) push back on some of this research, identifying what they see as a flaw in the specification of models benchmarking scholars employ. When reestimated in their alternative way, the positive results largely disappear, and this finding is robust to a variety of other specifications and tests. That said, the authors do explicitly recognize that some voters with sufficient information may benchmark growth when evaluating incumbent governments; they just do not find any evidence based on their reanalysis of data used in the previous research. Kayser and Peress (Reference Kayser and Peress2019) challenged Arel-Bundock et al.’s arguments and evidence, and provided additional support for their benchmarking claims.
While we do not take a side in this debate, we want to underscore that any benchmarking of economic growth in electoral behavior presumes fairly accurate public perceptions of economic developments over time and/or across space. Indeed, any economic voting depends on it; that is, voters need accurate information in order to reward and punish incumbent governments on the basis of the real economy, in this case, economic growth.Footnote 5 Previous research does not examine how people update their perceptions of economic conditions, however. This is true for those who put forward evidence of benchmarking affecting the vote, as well as those who challenge it.
We posit that people update perceptions of the economy in response to economic change in relative terms, through the lens of their view of past conditions. When times are thought to be good, for example, positive economic news matters less than negative economic coverage. When conditions are seen as bad, by contrast, positive economic news matters more than negative economic news. This may be true even as negative news is generally more impactful, per previous research (Soroka, Reference Soroka2014). A strong “lensing” effect would make perceptions of the present hostage to the past, as the public could be highly responsive or indifferent to very large changes in economic conditions, depending on the state of existing perceptions when the changes occur. The tendency may be true even if voters do not reward or punish elected officials for benchmarked economic change, which involves the use of economic information on Election Day. Importantly, it also may apply to other social phenomena, not just the economy.
One reason to expect public benchmarking of economic (and other) perceptions is that most psychological models of decision-making see priors as having a pivotal role in preference formation. The values assigned to various alternatives, what economists often refer to as “utilities,” matter for choices but, contrary to (most) rational choice theory, they are not the only things that matter. Both observational and experimental evidence demonstrate that judgments are heavily context-dependent (Nieuwenhuis et al., Reference Nieuwenhuis, Heslenfeld, Alting von Geusau, Mars, Holroyd and Yeung2005; Vlaev et al., Reference Vlaev, Chater and Stewart2007; Plassmann et al., Reference Plassmann, O’doherty and Shiv2008; Engelmann and Hein, Reference Engelmann and Hein2013). One well-known expression is the “endowment effect,” where individuals assign greater value to objects in their possession (Thaler, Reference Thaler1980; Kahneman et al., Reference Kahneman, Knetsch and Thaler1990). Another is “prospect theory,” which posits that individuals generally behave in ways that are risk-averse, using internal reference points when evaluating potential gains or losses, not only the expected utilities (Kahneman and Tversky, Reference Kahneman and Tversky1979).
A reference point could be anything, but often it is the status quo, which is used as a benchmark to evaluate choices or new developments (Tversky and Kahneman, Reference Tversky and Kahneman1991; Baillon et al., Reference Baillon, Bleichrodt and Spinu2020). Social science provides a number of examples of this type of process in action. For example, attitudes about climate change and other types of environmental degradation are known to be governed by a “shifting baseline syndrome,” where perceptions of current conditions are compared to an evolving status quo (Pauly, Reference Pauly1995; McClenachan, Reference McClenachan2009). Moore et al. (Reference Moore, Obradovich and Lehner2019) find that the noteworthiness of extreme weather events rapidly diminishes through repeated exposure as people evaluate new events with reference to the recent past. Grillo and Prato (Reference Grillo and Prato2023) argue that something similar can take place with democratic backsliding if people’s expectations are endogenous to incumbent behavior, adjusting to view new (lower) standards as a reference point. Epp and Thomas (Reference Epp and Thomas2022) look at the COVID-19 pandemic, showing that states that saw a protracted deterioration in their health situation were less likely to respond with social distancing policies than those that saw an abrupt deterioration to the same point.
In summary, people appear to use reference points when forming perceptions, and if the status quo serves as one, then changes to conditions would be assessed in light of preexisting perceptions of those conditions. Moreover, if this behavior is general, rather than limited to certain types of people or certain regions, then it should be evident in aggregate public perceptions. Voting decisions—where existing research on benchmarking has focused—may also involve reference points, or they may not. Regardless, determining whether and how aggregate perceptions evolve in a relative way has important implications for our understanding of public responsiveness to sociopolitical events.
3. Expectations
Let us explicitly spell out our expectations. It is useful to begin with the general model of updating that pervades most of the literature, even if only implicitly. There, people respond equally to all shocks. Thus, changes in perceptions of conditions (ΔP) at time t are a function of changes in conditions (ΔC), as follows:
 \begin{equation}\Delta {P_t} = {\alpha _0} + {\beta _1}\Delta {C_t} + {e_t},\end{equation}
where et represents the error term.Footnote 6 The coefficient β 1 captures the effects of changes in conditions on perceptions, and is expected to be positive. That is, the larger and more positive the shock, the larger and more positive the change in perceptions.
Equation 1 is a macro-level representation of an underlying micro-level process. It captures the average response across individuals, all of whom may not—and almost surely do not—respond in the same way and to the same degree. The macro implications nevertheless follow fairly directly, i.e., aggregate perceptions respond to changing conditions because individuals respond (Stubager et al., Reference Stubager, Lewis-Beck and Nadeau2013). We care about the macro because it is what matters politically. It is also something we can directly test given the available data.
While the representation in Equation 1 is common in previous research, some scholars see shocks as differing in type (Lewis-Beck and Stegmaier, Reference Lewis-Beck and Stegmaier2013). Most importantly, Soroka (Reference Soroka2014) argues and finds that people respond more to negative shocks (ΔCN) than positive ones (ΔCP), which we can incorporate directly into the model, as follows:
 \begin{equation}\Delta {P_t} = {\alpha _1} + {\beta _2}\Delta {C_t}^N + {\beta _3}\Delta {C_t}^P + {e_t}.\end{equation}
Here, β 2 reflects the effect of negative shocks and β 3 the effect of positive ones. If the public adjusts its economic perceptions in response to these different shocks, both coefficients will be greater than 0 but, following Soroka’s research, there is reason to suppose that the former is larger than the latter.Footnote 7
Now we take into account prior perceptions. For this, we need to incorporate a variable reflecting the history of public perceptions. Let us conceive of this as a moving average, e.g., Pt −1 + Pt −2, … + Pt −x divided by x. This we represent as P̅t −1,t−x. To assess whether the variable moderates the influence of shocks, we include interactions between it and the terms capturing negative and positive shocks, as follows:
 \begin{equation}\Delta {P_t} = {\alpha _2} + {\beta _4}\Delta {C_t}^N + {\beta _5}\Delta {C_t}^P + {\beta _6}{{{\bar{P}}_{t - 1,t - x}}} + {\beta _7}\left( {\Delta {C_t}^N} \right)\left( {{{\bar{P}}_{t - 1,t - x}}} \right) + {\beta _8}\left( {\Delta {C_{t1}^P}} \right)\left( {{{\bar{P}}_{t - 1,t - x}}} \right) + {e_t},\end{equation}
in which we also include the additive effect of the variable that we must estimate, about which we have no expectations. As for Equation 2, we expect that both negative and positive shocks matter and that the effect of the former is larger than that of the latter, i.e., that β 4 is greater than β 5 in Equation 3. If the public is benchmarking its responses to shocks as we have hypothesized, however, the effect of negative shocks will decline when perceptions are already highly negative. This implies that β 7 will be greater than 0, indicating that the public response to negative shocks increases as preexisting perceptions are more positive and decreases as they are more negative. If a similar pattern holds for positive shocks, β 8 will be less than 0, indicating that the public response to shocks declines as preexisting perceptions are more positive and increases as they are more negative. This is our model of public updating of social conditions.Footnote 8
Figure 1 plots these expectations as well as those implied by Models 1 and 2. The blue lines show the effects of a +1 standard deviation improvement in a social condition on public perceptions of that condition, whereas the orange lines show a deterioration of equivalent magnitude. The x-axis tracks preexisting perceptions. Model 1 predicts that because positive and negative changes are equivalent, they will have equivalent effects on perceptions, so Figure 1 shows the dashed lines spaced an equal distance from the x-axis. Moreover, because Model 1 has nothing to say about preexisting perceptions, the lines are flat across the range of the x-axis. Model 2 is similar, but consistent with prospect theory and the work of Soroka (Reference Soroka2014), anticipates that negative changes matter more for perceptions than positive ones, so the dotted lines are spaced unequally relative to the x-axis.Footnote 9
Benchmarking of public perceptions.

Model 3 (our model) is the only one that accounts for preexisting perceptions.Footnote 10 When a larger percentage of the public thinks that a social condition has been bad, then a positive change in that condition has a larger effect than when a larger percentage thinks the situation has been good. The opposite is true for negative changes, but notice that the slope is less steep than for positive changes because if negative changes matter more, then we should expect less of a moderating effect from preexisting perceptions. These are our general expectations, ones that follow directly from our theoretical model. We do not have more specific expectations about effect sizes, as that is not clear a priori. Now, let us see what the data reveal.
4. Data and methods
Testing our expectations requires temporally fine-grained measures of public perceptions of a social condition that can itself be independently measured at frequent intervals. We therefore turn to measures of economic conditions and aggregate public perceptions of those conditions.Footnote 11 There is nothing about our theoretical model that is specific to the economy—it may apply to housing costs, public health, or any other social condition—but the economy is one of the few issues for which there are enough survey data and objective indicators to allow robust empirical modeling.
To measure economic conditions, we use the index of leading economic indicators (LEI) from the Conference Board.Footnote 12 Previous research on public perceptions shows that the public is more responsive to these leading indicators than to indices of coincident or lagging indicators (Wlezien, Reference Wlezien2015).Footnote 13 Other research shows that LEI also better predicts mentions of “the economy” as the most important problem (MIP) facing the nation (Wlezien, Reference Wlezien2005). LEI effectively captures economic effects on the vote in US presidential elections as well (Erikson and Wlezien, Reference Erikson and Wlezien2020). There, thus, is evidence that the LEI index not only anticipates economic trends but captures realities that matter to the public’s perceptions, preferences, and votes. Moreover, as we will see, people effectively respond to the broader index, not only to the particular components.
The LEI index for the period between January, 1978, and December, 2023, is displayed in Figure 2, in which Panel A plots levels and Panel B changes. For levels, there is a clear upward trajectory, which is as expected given that the economy has grown over time. For changes, we see a lot more fluctuation around a seemingly constant mean, what time series analysts refer to as “difference stationarity.” These changes are of importance in our analysis, recalling that Equations 1–3 all represent public responsiveness to economic “shocks.” As spelled out in Equation 3, we are especially interested in seeing if the updating process is moderated by preexisting perceptions of those conditions. The (massive) monthly drop associated with COVID-19’s onset stands out in the plot of changes, though we also see indications of various recessions, which are also apparent in the plot of LEI levels.
Leading economic indicators (LEI). (A) Monthly levels of LEI. (B) Monthly changes in LEI.

To capture perceptions, we rely on consumer sentiment data from the Thomson Reuters/University of Michigan Surveys of Consumers. Specifically, we use the monthly retrospective sociotropic measure of economic sentiment, which is based on responses to a survey item that asks about whether past “business conditions” have gotten better or worse.Footnote 14 Importantly, these items ask about changes in, not levels of, conditions, the latter of which we might more directly associate with “good” and “bad.” That said, we cannot be sure how people respond to the wording, and it may be that people’s responses do reflect economic levels, as we will see.Footnote 15 Note also that our theory of benchmarking is a general one, in that we expect that where changes in any condition X predict changes in attitudes about X, then the relationship should be moderated by historical attitudes about it. (There may be heterogeneity in the degree of moderation across issues or types of people.) To test this idea, we are simply trying to match objective indicators of social conditions with attitudes about those conditions, which, in the case of the economy, leads us to consider retrospective consumer sentiments together with LEIs. In the appendix (see Supplementary Tables H16 and H17), we consider other combinations, pairing lagging and coincident economic indicators together with prospective and retrospective consumer sentiments. The relationship between leading indicators and retrospective sentiments is the strongest and most reliable, consistent with previous scholarship on the subject (Wlezien, Reference Wlezien2015). Perhaps not surprisingly, given these results, the correspondence between public economic retrospections and prospections is weak, as Pearson’s r is 0.18 in levels and 0.37 in changes.
Panel A of Figure 3 plots monthly values in perceptions between January 1978 and December 2023. The series ebbs and flows with real macroeconomic events, e.g., the recessions of the late-1970s and early-1980s, the early-1990s, the early-2000s, the late-2000s, and COVID. In other words, people’s perceptions decrease as the economy declines, and increase as it rebounds. People presumably update their economic perceptions more or less continuously as they encounter new information, and we use monthly data because it is the best we can do. (While the Michigan Survey of Consumers has data on a quarterly basis starting in 1960, monthly data is not available until 1978.)Footnote 16 Notice in Figure 3 that economic sentiment rarely approaches the floor, where 100% of respondents say the economy has been doing worse, and never approaches the ceiling, where 100% think that conditions have gotten better. We take a 12-month moving average of this series as our measure of preexisting perceptions, which we expect to moderate public responsiveness to new economic information. The decision to use a 12-month window is based on empirical analysis that we report below. Panel B of the figure shows changes in monthly values of perceptions, and this series serves as the dependent variable in our analysis.
Economic perceptions. (A) Retrospective perceptions of the economy. (B) Monthly changes in perceptions.

5. Results
Estimation follows Equations 1–3 except that we add the lagged (t − 1) level of retrospections to the equations to account for (slight) regression to the mean.Footnote 17 We begin by estimating the most basic Equation (1) using LEI and retrospections, the results of which are shown in the first column of Table 1. Recall that Model 1 assesses the concurrent relationship between changes in LEI and changes in perceptions. The positive coefficient thus indicates that when economic indicators improve (worsen), the public immediately updates its retrospective evaluations of the economy to be more positive (negative). The size of this effect is substantively large, as a 1-unit (or 1.5 s.d.) increase in indicators predicts a 7.32-unit increase in perceptions, which is over 70% of a standard deviation.Footnote 18 The negative, statistically significant coefficient on retrospections (t − 1) further reveals that there is some regression to the mean, where effects on retrospections decay very slowly over time, about 6% per month.Footnote 19
Regression coefficients characterizing the effect of changes in leading economic indicators (LEI) on changes in retrospective economic attitudes

Table 1 Long description
Regression results link changes in leading economic indicators to changes in retrospective economic attitudes across three models. In Model 1, overall change in the leading index is a strong positive predictor, while prior retrospective attitudes predict a small decrease in current change. Model 2 separates the index into positive and negative changes; both are positive and statistically reliable, and the negative-change effect is larger than the positive-change effect. Model 3 adds an average of prior attitudes and interaction terms; the negative-change main effect remains large, and the positive-change main effect is smaller. In Model 3, the interaction with prior attitudes is negative for positive changes and positive for negative changes, indicating the effect of indicator changes varies with earlier attitudes. The added terms improve model fit modestly, with adjusted fit rising from about 0.23 in Models 1 and 2 to about 0.27 in Model 3. Sample size is 549 for Models 1 and 2 and 538 for Model 3, so comparisons involving Model 3 reflect a slightly smaller dataset.
** p < 0.01; * p < 0.05.
Model 2 is similar, but here we separate the economic indicator variable into positive and negative changes, following Equation 2 from above. This allows us to assess the possibility that the public processes good and bad news differently.Footnote 20 Consistent with expectations, we find that negative changes have a bigger effect on perceptions than positive changes, as the coefficient on the former (8.48) is about 60% larger than for the latter (5.17). The coefficients also appear to be significantly different from each other (p-value = 0.059), consistent with the hypothesis that people are more sensitive to bad news than good news. Note that the linear relationships captured by the coefficients for “Δ Positive LEI” and “Δ Negative LEI” are both described in terms of a 1-unit increase. If we observe a 1-unit increase in LEI, then Model 2 predicts a 5.17 change in economic perceptions (1 × 5.17); if we observe a 1-unit decrease, then the model predicts a −8.48 change in perceptions (−1 × 8.48). As expected, good economic news predicts more positive sentiments and bad news more negative. That said, the differences contribute only marginally to model performance, as the explained variance increases a tiny amount.
Based on these results, people respond to economic shocks, possibly more to negative ones than positive ones, and the changes to perceptions tend to be fairly long-lasting, i.e., effects decay only slightly (0.06) each month.Footnote 21 We have not yet considered whether the effect of changes in economic indicators on perceptions (shown in Models 1 and 2) is dependent on existing perceptions of the economy, however. Following Equation 3, Model 3 in Table 1 does so by adding our moderator variable capturing the average level of retrospective economic attitudes over the preceding 12 months. Higher values indicate that a larger percentage of respondents said the economy was “better” over the 12-month period, and lower values indicate that a larger percentage said the economy was “worse.” As discussed earlier, our expectations are that any interactive effects work differently for positive versus negative changes in the economy. For positive changes, the moderator should have a dampening effect, i.e., a negative coefficient, because good news arriving after perceptions have already been positive should be less consequential for changes in perceptions. For negative changes, we expect the opposite—an amplification effect signified by a positive coefficient. Bad economic news interrupting a period of positive economic sentiment should loom especially large.
Estimates in the third column of Table 1 are consistent with our expectations. The two interaction terms are statistically significant and have opposite signs for positive and negative changes.Footnote 22 Thus, as preexisting perceptions over the preceding 12 months become more positive, a 1-unit increase in LEI has less and less of an effect on current changes in attitudes. The opposite is true for negative changes, though the coefficient for this term is smaller, suggesting that the impact of negative changes is less affected by benchmarking than for positive changes. This fits with previous work showing that people are especially sensitive to bad news, the effects of which are consistently larger than those for positive news of an equivalent magnitude.Footnote 23
Our model (3), including preexisting perceptions also outperforms Models 1 and 2, as an F statistic (11.72) leads us to reject the null (p < 0.0000).Footnote 24 The increase in the explained variance (0.036) in Table 1 is still not massive, approximately 14 percent. Preexisting perceptions matter most for updating when there are large shocks that contrast with those perceptions, i.e., when they are very negative or positive, which we illustrate using COVID-19 as an example later in the paper.
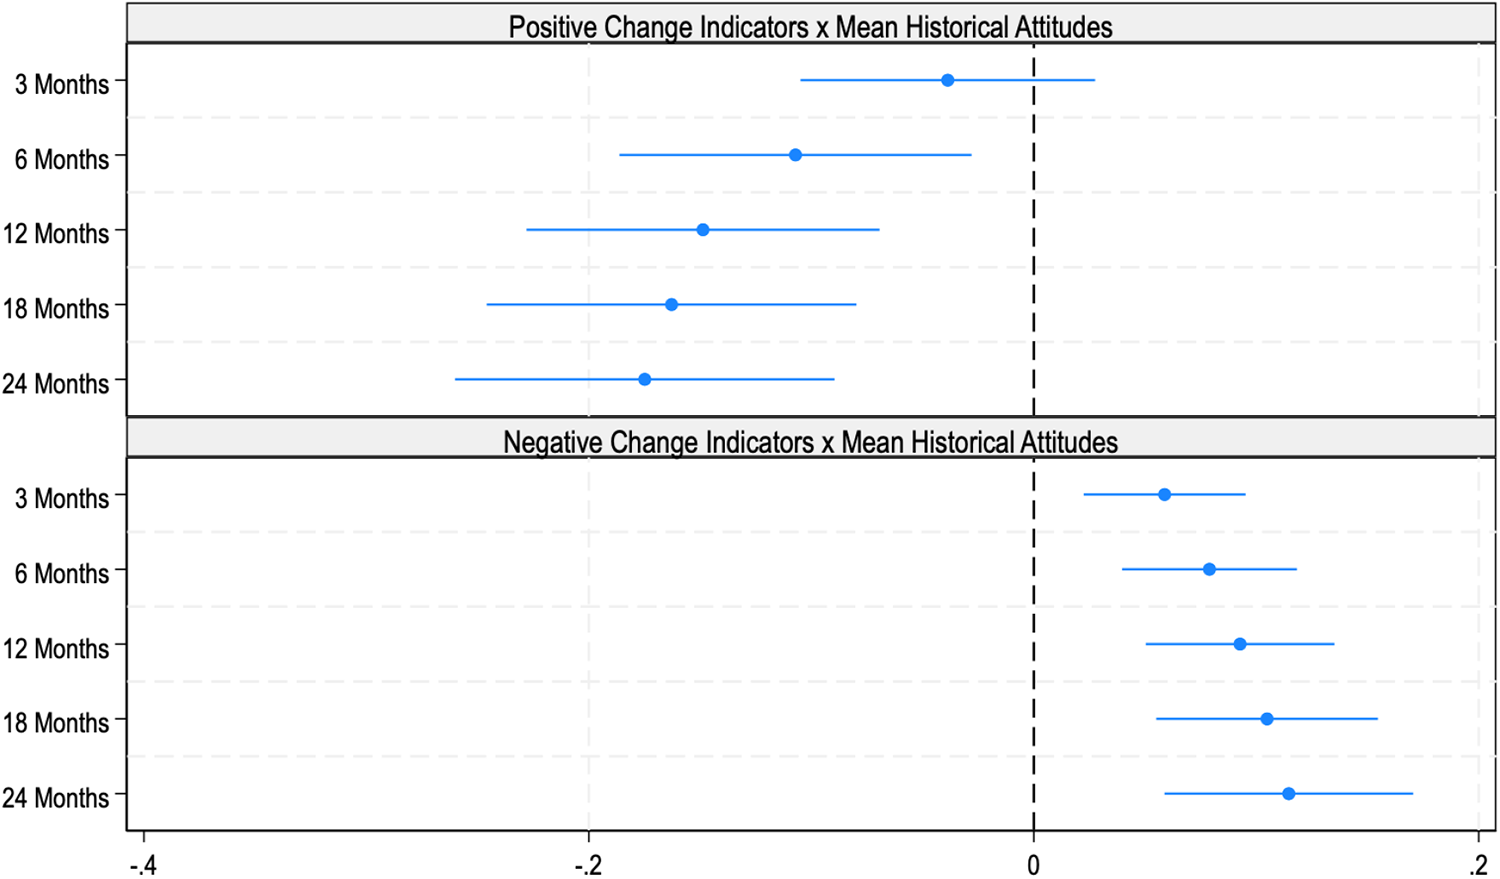
Our results indicate that prior perceptions matter to public updating, but over what time frame? What windows do people use to moderate how economic developments affect current perceptions? The decision to calculate average perceptions over the preceding 12 months may seem arbitrary, but it was based on empirical analysis.Footnote 25 Figure 4 plots the coefficients for the interaction terms estimated using various windows, ranging from 3 to 24 months. There we can see that priors start to matter quickly, sometime between 3 and 6 months for positive changes, and as soon as 3 months for negative changes. The moderating effect increases somewhat using longer windows, after the public has thought the economy is better or worse for a longer period of time, though the effect tends to level off, particularly for positive changes. Estimates using windows of 6 months or longer, for both positive and negative changes, are not significantly different from each other, however.
Interactive effects at different windows.

Are the estimated effects in Table 1 large or small? Let us explore the substantive significance of our results by predicting the impact of economic shocks across different circumstances. Drawing on Model 3, we estimate the effects of different magnitudes of change in LEI, starting with the mean change and moving to ±2 standard deviations. Furthermore, to estimate how different baselines moderate the estimates, we use standard deviations in the moving average of retrospections: “Bad times” when net retrospective attitudes about the economy over the preceding 12 months are extremely negative (−40%), “Average times” when net attitudes are at −5%, and “Good times” when net attitudes are positive (28%). These estimates are shown in Table 2.
Model estimates of changes in retrospective economic perceptions across varying conditions

Note: The table shows the estimated effect of changes in LEI on retrospective economic perceptions at three different periods: “bad times” when historical perceptions about the economy were 1 standard deviation below average, “average times,” and “good times” when historical perceptions were 1 standard deviation above average.
** p < 0.01 *p < 0.05.
These results make clear that prior perceptions matter a great deal. The effect sizes for the interaction terms from Table 1 are substantively meaningful. A 2 standard deviation increase in LEI, i.e., a massive positive shock to the economy, has a huge (12.06 point) effect on perceptions if it occurs during a period when preexisting perceptions are highly negative. But an increase of the exact same size has a small (1.29 point), statistically insignificant effect on attitudes if it takes place when attitudes are highly positive. A rapidly improving economic situation thus matters only conditionally for public economic perceptions. This asymmetry is not an obvious consequence of ceiling effects. Recall that Figure 3 shows that aggregate perceptions never approach the upper limit of positivity, where 100% of respondents say the economy has been doing better, so respondents have not simply run out of room on the survey. (At times nearly 100% have thought that the economy is doing worse, though this does not seem to be driving the results.)Footnote 26
A similar pattern emerges for negative shocks but here the consequences of benchmarking are less pronounced. A 1 standard deviation decrease in LEIs produces virtually the same reaction regardless of prior perceptions. Meaningful conditional effects do not emerge until we observe a 2 standard deviation decrease, but even these are more limited than what we see for positive changes. This again is consistent with the idea that people are especially, and consistently, attentive to economic loss.
The vast literature on public opinion and the economy has largely ignored this heterogeneity by (implicitly) assuming that existing perceptions do not matter in the evaluation of new economic information. Recall that Model 1 from Table 1 represents a conventional approach to representing the relationship between economic developments and opinion. In that model, the coefficient for a 1-unit increase in economic indicators is 7.33. But Table 2 makes clear that the effect an increase of this magnitude would have on economic perceptions is heavily contingent on preexisting perceptions. If those perceptions have reflected very good times in the preceding months, then further positive developments in the economy may not matter at all. The context in which changes take place appears to be critical to understanding the interplay between the economy and public opinion.
5.1. The COVID shock
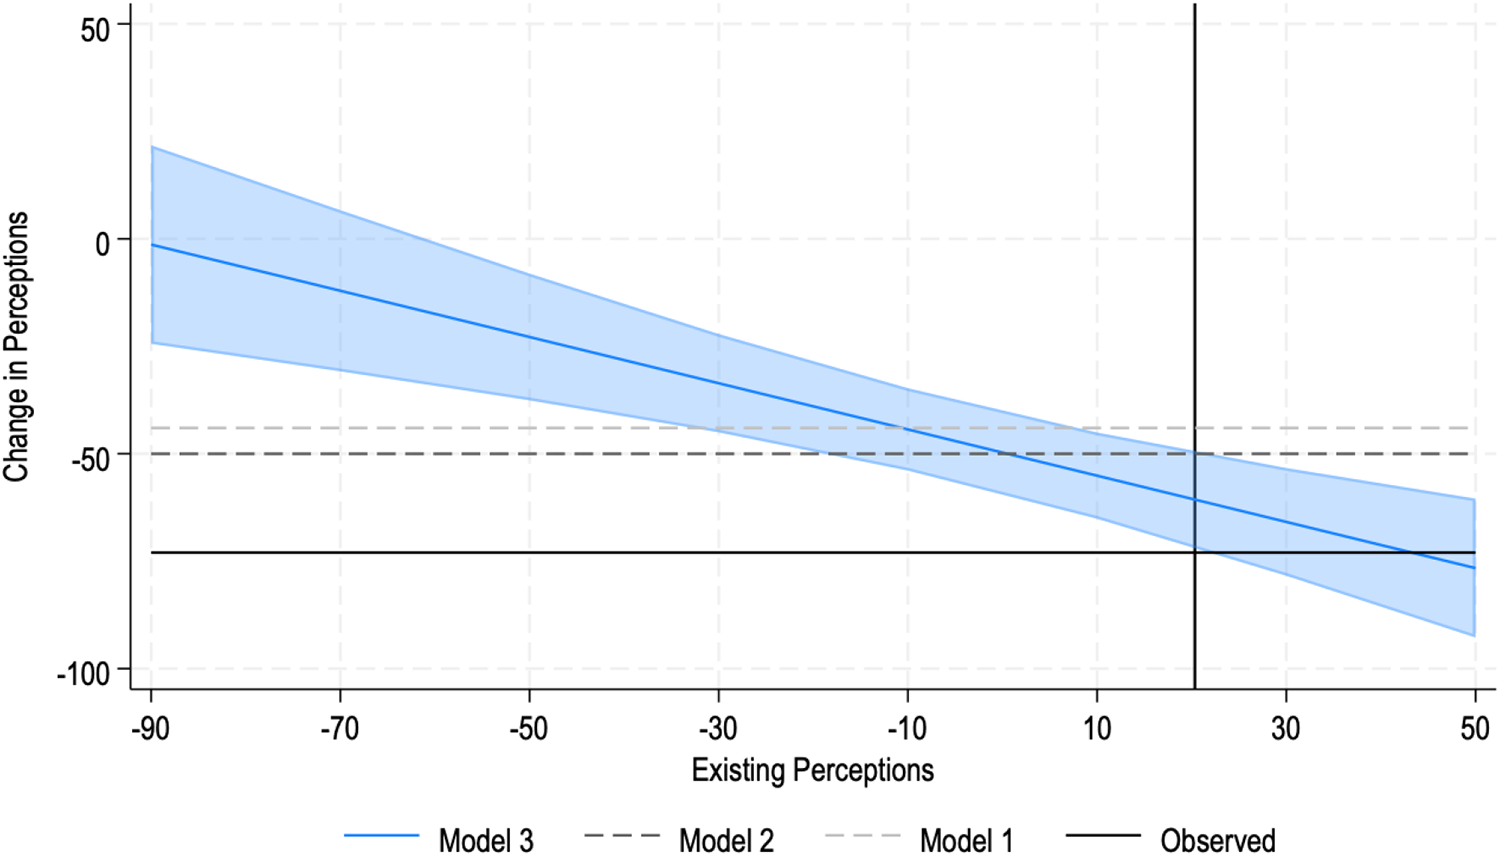
The degree of heterogeneity shown in Table 2 matters a lot for our understanding of how the public reacts to economic events. To illustrate further, we consider the economic collapse at the beginning of the COVID-19 pandemic. In April, 2020, the monthly change in LEI was −5.89, the largest monthly drop in the history of the series. (This change is clearly visible in Figure 2.) What corresponding change in public economic perceptions do we expect owing to this shock? Models 1–3 from Table 1 provide different answers, each of which is plotted in Figure 5.
Estimated change in public economic perceptions following a COVID-level economic setback.

The blue line (with confidence intervals) is from Model 3, and gives the marginal effect of a −5.89 change in LEI on economic perceptions across different circumstances. When existing perceptions are highly negative, even a COVID-level economic setback is estimated to have no meaningful effect on economic perceptions. But when existing perceptions are highly positive, such a decrease is predicted to have a massive (negative) effect on attitudes. The drop in LEI in April 2020 happened to occur when existing perceptions were relatively positive, as shown in the figure with a vertical black line. The intersection of this line with the blue line gives Model 3’s prediction for economic perceptions following an economic downturn of this magnitude.
The predictions of Model 1 (the baseline) and Model 2 (the asymmetric one implied by Soroka’s research) are also shown in Figure 5. Given that these models do not incorporate information about existing perceptions, they are represented with flat dashed lines. Finally, the figure shows what actually happened to economic perceptions (a drop of 73 points) with a solid horizontal black line. While none of the models perfectly predict the change in attitudes, Model 3 comes closest. Models 1 and 2 underestimate how strongly the public would react to the COVID downturn by (implicitly) assuming that the relatively positive feelings about the economy that the public held before the pandemic are irrelevant. (Model 1 performs worse than Model 2 because it further underestimates the effects of negative shocks.) As can be seen in the figure, Model 3 gives a similar prediction to Models 1 and 2 only when existing perceptions are closer to their average of −5, but this was not the state of the world at the beginning of the pandemic.
6. Robustness
We present the results of various robustness checks in the Supplementary Appendix.
First, we explore the sensitivity of our findings to outlying observations. Outliers might matter through ceiling (and floor) effects, where people may perceive that things are as good (or bad) as it gets, having reached a point where further changes are immaterial for perceptions. Here, similar shocks would have declining marginal effects because there are declining numbers of people who have not already selected the most extreme survey response. For example, if 97% of survey respondents already think the economy has been “doing worse” then any additional bad economic news, even a large recession, can make only a little difference, given that there are few people to convert.
We therefore reestimate Model 3 from Table 1 after dropping observations near the floor (when 100% of respondents think the economy has been “doing worse”) and the ceiling.Footnote 27 Specifically, we exclude observations at various cut-points: 2 standard deviations or less below the mean, 1.5 standard deviations or less below the mean, and 1.5 standard deviations or more above the mean. (There are no observations 2 standard deviations above the mean.) Results in Supplementary Table C5 strongly suggest that ceiling and floor effects are not driving our results.
Second, we consider another way to measure economic circumstances. For the preceding results, we used a 12-month moving average of perceptions. This formulation is intuitive given that we are interested in how perceptions are updated in response to new information. But economic information might matter more directly, through objective economic performance. To evaluate this possibility, we reestimate Model 3 from Table 1 using moving averages of detrended LEI as a moderator, so, in these specifications, current changes in indicators are interacted with past levels of indicators.Footnote 28
Supplementary Figure D2 plots the estimated coefficients for the interaction terms for positive and negative changes using different monthly windows to calculate moving averages of LEI levels. Results for positive changes are almost identical to those found when using perceptions as a moderator (see Figure 4). Things are more complicated for negative changes, however, as effects are negative and statistically significant (as expected) at short windows but indistinguishable from 0 at longer windows. Importantly, these results do support the finding that benchmarking in public updating is stronger for positive economic changes than negative ones. The results using perceptions just are more in line with expectations, which is as we theorize (and hypothesize).
Third, we reestimate Model 3 from Table 1 using slightly different specifications. These involve excluding the variable for lagged retrospective perceptions (Supplementary Table E7), including a variable for lagged levels of LEI (Supplementary Table E6), including squared terms for positive and negative changes as separate covariates (Supplementary Table E8), and aggregating to the quarterly rather than monthly level (Supplementary Table E9). These specifications alter the specific estimates somewhat but make no difference to the substance of our findings, i.e., the sign of each of the estimated coefficients is the same, and their size and statistical significance differ only marginally. We also reestimate Model 3 using different 15-year windows to see if the effects we report vary over time. These results are shown in Supplementary Table E10. The coefficients for the interaction terms are not always statistically significant, which is not surprising given that these regressions have relatively few observations, but their sign is the same, and their size is very similar to what we report in Table 1.Footnote 29
Fourth, we consider the possibility that our results are being confounded in some way by well-known partisan biases in economic evaluations. Republicans and Democrats are more likely to say that the economy is doing well when they share a political party with the US president (Wlezien et al., Reference Wlezien, Franklin and Twiggs1997; Bartels, Reference Bartels2002; Ladner and Wlezien, Reference Ladner and Wlezien2007; Donovan et al., Reference Donovan, Kellstedt and Key2020). We think it is unlikely that these differences matter for our results because the economic perceptions expressed by Republicans and Democrats move in parallel over time, indicating that they react much in the same way to economic developments (see Supplementary Figure I3). The correlation between economic perceptions for Democrats and Republicans is 0.845 during the first Trump Administration and 0.826 during the Biden Administration. Unfortunately, monthly data that separate Democratic and Republican identifiers are available only since 2017, so we are unable to estimate separate equations by partisanship. To be cautious, we can reestimate Model 3 from Table 1, including a control variable that is coded 1 if a Republican is in the White House and 0 if a Democrat. The results depicted in Supplementary Table I18 of the appendix are substantively the same as those presented above.
Fifth, we look at the salience of the economy to the public as a possible alternative explanation for our results. Perhaps the public reacts differently to economic information when the economy is highly salient. To explore this possibility, we estimate a model where changes in LEI predict changes in economic perceptions, but allow MIP data (Yildirim and Laron, Reference Yildirim and Laron2023) on the economy to moderate changes in LEI. Results can be found in Supplementary Table J19. The interaction term (between MIP and LEI) is not statistically significant, giving us confidence that our variable for preexisting perceptions is not simply capturing the effects of varying salience. We also reestimate Model 3 of Table 1, including MIP data as a control, and the results of the model are substantively unchanged (see Supplementary Table J20).
Sixth, we consider a more flexible specification following the Almon distributed lag model. Although our Model 3 of Table 1 is theoretically implied, and seems to work, a more complex structure may work even better. For this, we include two lagged terms into our model, and report the results in Supplementary Appendix Table E11. There, we can see very mixed results, and the model performance is not clearly better than what we see in Table 1, e.g., the BIC actually is larger (also see Supplementary Table A2). Even when excluding the second lag, the BIC is less than two points lower than for our basic model, which Raftery (Reference Raftery1995) refers to as “very weak” evidence of improvement. Based on this analysis, it appears there is little to be gained by the greater complexity the Almon model offers.
Finally, we consider public reactions on an issue other than economic performance, specifically, violent crime. That analysis relies on MIP data together with national homicide rates (see Table F12 in the Supplementary Appendix). In these results, we find a similar pattern, where preexisting perceptions about the severity of crime appear to condition how the public responds to changes in the homicide rate. When more of the public identifies crime as an important problem, subsequent increases in homicides, i.e., more bad news, have less of an effect on changes in perceptions, but decreases in homicides have a larger effect (though the coefficient for this interaction term is not statistically significant). This regression is based on fewer than 60 yearly observations, so we see the results as preliminary, but they do suggest that the dynamics that we uncover for economic performance are not limited to that issue.
7. Discussion and conclusion
There are good reasons to think that existing perceptions condition how people update their attitudes, political or otherwise, in response to new information. One plausible way that they might matter is by serving as a reference point for evaluations of “good” or “bad.” But this possibility has been largely ignored by the literature on public responsiveness. By updating standard models of public economic perceptions, we show that existing perceptions of the economy can powerfully condition how the public responds to new economic information. In fact, the link between positive economic changes and public perceptions appears to be greatly dependent on the state of prior perceptions, as large economic gains can matter either a great deal or not at all depending on when they occur. We also find evidence of benchmarking of negative economic changes, but less so than for positive ones, which is consistent with the well-known sensitivity of humans to negative information (Soroka, Reference Soroka2014).
Previous research on economic voting has found a similar type of heterogeneity—where voters appear to be making decisions by drawing relative economic comparisons. Such behavior can be seen as downstream of the updating process described by our results insofar as voting decisions are likely to be informed by perceptions. Our model requires little of people, only that they have as an internal reference point some idea of how the economy has been doing. It is hard to see how meaningful updating could occur in the first place without such perceptions being in place, so there is reason to suppose that our results generalize across different types of geographies and cultures. That nevertheless remains a subject for future research. Perhaps more importantly, the micro-level foundations of what we have observed at the macro-level in the US remain to be seen.
It also is important to consider the possibility that people experience the economy more locally, and that our analyses average across reactions to varying trends. This is as a good amount of recent research implies (Larsen et al., Reference Larsen, Hjorth and Dinesen2019; Hall et al., Reference Hall, Yoder and Karandikar2021; Bisbee and Zilinksy, Reference Bisbee and Zilinksy2023), and there also is reason to suspect that effects are fairly direct, not highly mediated (Kayser and Peress, Reference Kayser and Peress2026). Such an analysis is important to do, we think, but will require substantial new data collection. Our current analysis strongly suggests that this effort could be well worthwhile.
Our results do appear to shed light on some economic moments in recent US history. For example, the recession in 1980 had a relatively small effect on public economic perceptions, which might seem unusual except that perceptions were already quite negative after the high inflation (and gas shortages) of the late 1970s. On the other hand, positive economic developments in 1985 and 1986 failed to move public perceptions very much, which also makes sense given that perceptions were already highly positive following the post-recession economic boom of 1983 and 1984. Similar dynamics played out during other periods of economic prosperity, such as between 1997 and 2000 and 2017 to 2018.
What about other, non-economic conditions? We focused on the economy as a matter of empirical expediency, but our model and theoretical expectations are not specific to that domain. The mechanism that we think is at work points to a general process, and our basic analysis of crime perceptions is supportive. When people update their perceptions given new information about pollution, transportation, or other conditions, we might expect similar dynamics. That said, it is possible that prior perceptions may matter in different ways depending on the issue. The negativity bias we find—where preexisting perceptions matter less for economic decreases than increases—could be stronger or weaker in some cases. People may be highly sensitive to economic losses but less so to increases in environmental pollution.
There, we still might find benchmarking, but that existing perceptions matter similarly for positive and negative news. For low-salience issues, it is less likely that meaningful updating of public perceptions occurs in the first place, so benchmarking may not take place at all. Answering these questions requires new data collection, as time series like those that made our current study possible are not readily available for most non-economic issues.
For now, it appears that how events filter into public perceptions is likely more complicated than previous scholarship on public responsiveness has appreciated. People sometimes are hyper-responsive to new information, at other times totally unaffected. Scholars who incorporate public perceptions as a dependent variable—which a large number do—may want to be mindful of this heterogeneity. Models of public updating that estimate average effects without accounting for existing perceptions may have difficulties explaining a public that seems to be ignoring major developments or over-reacting to minor ones when, in fact, such behavior appears to be a fundamental component of public responsiveness.
Supplementary material
The supplementary material for this article can be found at https://doi.org/10.1017/psrm.2026.10113. To obtain replication material for this article, https://doi.org/10.7910/DVN/DWD4GI.
Acknowledgements
Previous versions of this article were presented at the Annual Meetings of the Elections, Public Opinion, and Parties Subgroup of the Political Studies Association, University of Exeter, 2025, and the Southern Political Science Association, San Juan, 2025, and also at the Policy Agendas Project group at the University of Texas at Austin. We are grateful to participants at those events, particularly Michael Auslen, Scott Cooley, Gauthier Fally, Steve Fisher, Max Goplerud, Jane Green, Stephen Jessee, Bryan Jones, Eric Kim, Alan Simmons, Paula Surridge, and Laron Williams. We also want to thank the editor, John Griffin, and the four anonymous reviewers, who invested a great deal of energy into probing pretty much every aspect of the manuscript, and we think to very good effect.
Competing interests
The authors declare none.





 Open access

