




1. Introduction
1.1. Emergence of AI
Artificial Intelligence (AI) is reshaping the way we work, study, and design (Russell & Norvig Reference Russell and Norvig2016; Brynjolfsson & McAfee Reference Brynjolfsson and McAfee2017). AI has surpassed many of the limitations of early machine learning and computer vision approaches, enabling greater efficiency and effectiveness across numerous fields, including design. State-of-the-art AI tools perform a broad range of cognitive tasks, including text and image analysis, text generation, and image generation (Brown et al. Reference Brown, Mann, Ryder, Subbiah, Kaplan, Dhariwal, Neelakantan, Shyam, Sastry, Askell, Agarwal, Herbert-Voss, Krueger, Henighan, Child, Ramesh, Ziegler, Wu, Winter, Hesse, Chen, Sigler, Litwin, Gray, Chess, Clark, Berner, McCandlish, Radford, Sutskever and Amodei2020; Feuerriegel et al. Reference Feuerriegel, Hartmann, Janiesch and Zschech2024).
There are many controlled studies exploring the implementation of AI in the design process, comparisons of ideation, innovation, and research with and without AI/ML (Chen et al. Reference Chen, Wang, Dong, Shi, Han, Guo, Childs, Xiao and Wu2019; Koch et al. Reference Koch, Lucero, Hegemann and Oulasvirta2019; Rahman et al. Reference Rahman, Yuan, Xie and Sha2020; Jeon et al. Reference Jeon, Jin, Shih and Han2021; Sarica et al. Reference Sarica, Song, Luo and Wood2021; Siddharth, Blessing, & Luo Reference Siddharth, Blessing and Luo2022; Zhu & Luo Reference Zhu and Luo2022; Cai et al. Reference Cai, Rick, Heyman, Zhang, Filipowicz, Hong, Toyoda, Klenk and Malone2023; Cheng Reference Cheng2023; Wan & Lu Reference Wan and Lu2023; Bouschery, Blazevic, & Piller Reference Bouschery, Blazevic and Piller2024; Ghasemi et al. Reference Ghasemi, Yuan, Marion and Moghaddam2024; Guo, Pataranutaporn, & Maes Reference Guo, Pataranutaporn and Maes2024; Norheim et al. Reference Norheim, Rebentisch, Xiao, Draeger, Kerbrat and de Weck2024; Papachristos et al. Reference Papachristos, Inal, Monllaó, Johansen and Hermansen2024; Sarica & Luo Reference Sarica and Luo2024; Wadinambiarachchi et al. Reference Wadinambiarachchi, Kelly, Pareek, Zhou and Velloso2024; Chong et al. Reference Chong, Lo, Rayan, Dow, Ahmed and Lykourentzou2025; Feng, Hélie, & Panchal Reference Feng, Hélie and Panchal2025; Kokate & Onkar Reference Kokate and Onkar2026), as a collaborative agent (Karimi et al. Reference Karimi, Rezwana, Siddiqui, Maher and Dehbozorgi2020; Lin et al. Reference Lin, Guo, Chen, Yao and Ying2020; Kim, Maher, & Siddiqui Reference Kim, Maher and Siddiqui2021; Siemon Reference Siemon2022; Lavrič & Škraba Reference Lavrič and Škraba2023; Shin et al. Reference Shin, Koch, Lucero, Dalsgaard and Mackay2023; Muller et al. Reference Muller, Houde, Gonzalez, Brimijoin, Ross, Silva Moran and Weisz2024; Nomura, Ito, & Ding Reference Nomura, Ito and Ding2024), approaches to optimise the output of AI results (Ge et al. Reference Ge, Sun, Cui and Wei2025; Meincke, Mollick, & Terwiesch Reference Meincke, Mollick and Terwiesch2024), to foster iteration (Zhou et al. Reference Zhou, Chai, Liao, Chen and Shi2020), to provide ideation stimulus (Li et al. Reference Li, Su, Zhang and Bai2021; Kim & Maher Reference Kim and Maher2023; Kwon, Rao, & Goucher-Lambert Reference Kwon, Rao and Goucher-Lambert2023; Wang & Han Reference Wang and Han2023; Ranscombe et al. Reference Ranscombe, Tan, Goudswaard and Snider2024), evaluate design reliability through FMEA (El Hassani et al. Reference El Hassani, Masrour, Kourouma and Tavčar2025) or support 3D modelling (Castro Pena et al. Reference Castro Pena, Carballal, Rodríguez-Fernández, Santos and Romero2021; Li, Xie, & Sha Reference Li, Xie and Sha2023), even design course planning (Meron & Araci Reference Meron and Araci2023), and novel AI-augmented methods that enhance design quality in specific activities such as TRIZ and bio-inspired design (Zhu & Luo Reference Zhu and Luo2023; Zhu, Zhang, & Luo Reference Zhu, Zhang and Luo2023; Siddharth & Luo Reference Siddharth and Luo2024; Jiang et al. Reference Jiang, Li, Qian, Zhang and Luo2025; Ren, Ma, & Luo Reference Ren, Ma and Luo2025). In parallel, recent studies compare human and AI performance in design generation and highlight emerging challenges for data-driven design (Chen et al. Reference Chen, Song, Guo, Sun, Childs and Yin2025; Monti et al. Reference Monti, Montagna, Cascini and Cantamessa2025; Vo Reference Vo2025). More recent work reviews studies of AI use across the full design-thinking cycle and frames it as a co-designer spanning divergent and convergent phases (Mirzaei et al. Reference Mirzaei, Pazhouhan, Jahanbakht and Eftekhari2026), diagnoses stagnation in problem framing and solution development across design project phases (Ito et al. Reference Ito, Taoka, Nakatani and Saito2026), and advances LLM-driven ideation methods evaluated against human and computational creativity measures (Tanaka, Nomaguchi, & Fujita Reference Tanaka, Nomaguchi and Fujita2026). Others formalise aggregation functions for ideation metrics such as variety, novelty, and quality (Sorensen et al. Reference Sorensen, Ashworth, Stapleton, Mattson and Anderson2026), and recast idea evaluation itself as a generative process of managing fixation and defixation (Boudier et al. Reference Boudier, Sukhov, Netz, Le Masson and Weil2023). At the same time, studies caution that AI-assisted ideation may dampen cognitive engagement and erode novice designers’ creative confidence, raising concerns of over-reliance (Krajcer et al. Reference Krajcer, Schut, Wang, Quanjer and Gonçalves2026). Overall, these studies show that under the right conditions, AI can be used to enhance creativity and offers significant promise for benefiting the future of design. While many prior works investigate the potential of AI for specific design tasks, the present study adopts a preliminary system-level perspective, opening a discussion on how AI integrates across the full design process and how designers may derive value from this emerging collaboration.
As the research group behind this paper is involved in frequent design thinking workshops for professionals, it was possible to develop and comparatively evaluate a modified design thinking approach with and without AI intervention. The core research questions extend the emerging body of work on AI applied to specific design tasks by examining process-level integration of AI through the following research questions:
-
1. How does integrating AI across the full design workflow – from problem definition through prototyping – affect participant preference compared to a human-only process?
-
2. Within sampled design methods, are AI-augmented outcomes of comparable quality to human-generated results, such that AI integration would not be expected to degrade those steps?
We propose that AI can function as a co-designer, expanding human capabilities at each phase of the design thinking process. This integration combines human designers’ contextual insights and holistic reasoning with AI’s ability to rapidly analyse and organize data, as well as draw from prior knowledge to generate new ideas or support critical design research tasks such as user needs analysis. This study spans over 5,000 person-hours dedicated to design workshops (including professional participants’ commitment).
The Triple Diamond model Figure 1 represents one possible evolution of the traditional 4D process, where AI accelerates iteration, augments exploration, and facilitates multiple design cycles within each phase. AI can expand or refine human inputs – such as questions, directions, or concept sketches – thereby extending knowledge and enabling smoother, more connected transitions across stages of the design process. While AI enhances creativity and speed, decision-making remains human-led, ensuring thoughtful integration of AI augmentation within design education and practice.
Design•AI Tri-Diamond, a modified design process flowchart. Illustrates the integration impact of AI in the design process; humans set intention and guide selection, AI accelerates and supports development efforts (reproduced from Camburn & Koh Reference Camburn and Koh2026).

Figure 1. Long description
The diagram reads from left to right. The first diamond has a red Discover half and an orange Define half, with Human above its peak. The last diamond has a green Develop half and a blue Deliver half, also labelled Human. A grey diamond labelled AI overlaps the Define and Develop regions between them. A horizontal white line runs through all three diamonds, while vertical white lines divide the two human diamonds. The expanding and narrowing shapes represent exploration and selection across the design process. Humans establish direction and guide decisions, while AI supports development and iteration between phases.
This study explores a practical implementation of an integrated design and AI workflow through an evaluation of design thinking workshops, comparing key design methods conducted with and without AI support. To establish the rationale for this work, we first provide a brief introduction to the overarching objectives of Design Innovation (Design Council 2005; Camburn et al. Reference Camburn2017; Sheppard et al. Reference Sheppard, Sarrazin, Kouyoumjian and Dore2018; Cross Reference Cross2023), followed by a detailed breakdown of the proposed integrated design and AI workflow. Finally, we review the methods and results of an experimental evaluation, examining the implementation across a series of professional development workshops.
1.2. Importance of DI
A structured approach to design can facilitate finding more innovative solutions via integration of best practices observed through experimentation and industry design studies. Design Innovation (DI) is a process framework encompassing design thinking, business design, systems engineering, and design engineering (Camburn et al. Reference Camburn2017). DI follows the 4D Triple Diamond model, derived from the UK Council’s “4D” model of design, which consists of four phases (Design Council 2005):
-
1. Discover – Engage various stakeholders to understand their needs.
-
2. Define – Analyse user data to identify and reframe opportunities.
-
3. Develop – Generates ideas or solutions in textual or visual form, then down-selects. Based on desirability, viability, and feasibility.
-
4. Deliver – Produce prototypes and test solutions with users, iterating for improvement.
Design also relies on key principles or strategic mindsets which may enhance process outcomes and are continuously integrated into the process. For instance, at McKinsey & Company, the value of design is structured principles such as Analytical Leadership, Cross-functional Talent, User Experience, and Continuous Iteration (Sheppard et al. Reference Sheppard, Sarrazin, Kouyoumjian and Dore2018). The DI methodology framework, developed at SUTD and implemented through in-person, studio-style workshops where teams create content collaboratively using interactive web-based collaborative media boards, also incorporates several key principles, as illustrated by the following examples (Camburn et al. Reference Camburn2017):
-
• Creativity Throughout – innovation requires creative thinking not just in generating solutions, but in identifying needs, framing opportunities, or strategically planning early prototypes.
-
• Empathy for all – empathy is a core component of design, as ultimately solutions must address human problems.
-
• Make, Test, Learn, Repeat – early testing is critical to long-term success, to refine requirements and identify failure points early in the process rather than later.
Figure 2 presents a snapshot from a digital collaboration board used by teams to document, organize, and present design results during typical 3–5 day workshops. This template systematically guides teams through the full design innovation sprint, covering Discover, Define, Develop, and Deliver, along with their respective methods.
Design innovation template commonly used in SUTD Academy workshops. Overview of a typical workshop activity flow; completed samples of selected individual methods are provided below.

Figure 2. Long description
A wide digital collaboration board contains three horizontal rows labelled Day 1, Day 2 and Day 3. Each row presents method templates in sequence, with instructions, examples and spaces for team contributions. Day 1 includes team alignment, personas and scenarios, needs analysis and activity mapping. Day 2 continues activity mapping, system functions and hierarchy of purpose before mind mapping. Day 3 includes trigger-based ideation, collaborative sketching, Real-Win-Worth selection, prototyping tools and canvas, storyboarding and pitching. Red, orange, green and blue accents distinguish the Discover, Define, Develop and Deliver phases. The board provides a shared workspace for documenting an entire design sprint.
These workshops are organized by the Design Innovation Office at the Singapore University of Technology and Design (SUTD), within the SUTD Academy research centre. The DI team has been active in Singapore for over 12 years, training thousands of design professionals in Design Innovation methodology.
2. Example AI-augmented design workflow
The approach presented in this paper represents Figure 1 is a synthesis of best practices identified in design and AI literature, combined with insights from the team’s practical experience and iterative efforts to integrate design and AI into innovation training. A particular instance of this approach is illustrated in Figure 3 where the sequence of methods introduced in each workshop is presented, along with callouts indicating where AI-augmented activities have been injected to support the process.
Applied sequence of design methods, contrasting AI- and human-driven methods. The design process evolves as a “dialogue” between human and AI agents.

Figure 3. Long description
A dotted arrow runs left to right through red heart, orange eye, green brain and blue hand symbols. Human activities appear above the line and AI-augmented activities below. In order, the labelled activities are: human personas and scenarios; AI user-needs clustering; human refinement of latent needs and activity diagram; AI refinement of the How Might We opportunity; human system functions, brainstorming and mind maps; AI expansion of mind maps; human C-Sketch and Real-Win-Worth selection, then strategic planning; AI high-fidelity renderings; and human physical prototyping. The alternating positions show AI contributions embedded within a process directed by people.
AI can support design as a tool to expand the possible number of interactions and refinements at each stage. It supports expanding the design space; thus, this figurative exploration provides a basis for the approach of formally introducing AI in specific methods as we demonstrated in Table 1. In each phase, human designers always develop initial insights first before AI is engaged to expand or organize results to reduce potential fixation on the initial AI-generated results. Table 1 details the applied methods within each design phase, as well as a description of how each method is conducted with strictly human-generated results versus human–AI collaboration. The following sections provide further details and sample content from each phase.
Detailing of the human–AI collaboration methods in the AI-Augmented workshop flow

Table 1. Long description
The table pairs nine methods with descriptions. Personas summarise user behaviour; humans create them, and AI generates scenarios. Affinity Analysis groups related needs extracted by humans, with AI clustering by similarity. Activity Diagrams map sequential and parallel user interactions. System Functions models represent product, service or system functions. Hierarchy of Purpose refines opportunity statements, with humans framing generic statements and AI making them more specific. Mind Mapping organises ideas hierarchically, with AI expanding human-generated maps. C-Sketch supports rapid collaborative sketching and development of team ideas. Real-Win-Worth assesses innovation risk, reward and marketability through questions. Prototyping includes canvases, mock-ups, paper prototypes, wireframes, role-play, Wizard-of-Oz and storyboards, with AI enhancing visual and aesthetic aspects of initial human prototypes.
2.1. Discover
In the Discover phase, designers focus on three key methods: Personas, Scenarios, and Affinity Analysis. Personas and Scenarios provide an understanding of user experiences when interacting with a product, service, or system. Human designers create the relevant personas, while AI designers assist in generating scenarios based on persona profiles.
For Affinity Analysis, human designers extract user needs from the generated scenarios and cluster the needs into categories, either manually or using AI (Figure 4).
An example of the Personas & Scenarios template used in design innovation workshops, implemented on a Miro board (a digital collaboration platform).

Figure 4. Long description
The left side explains personas and scenarios and shows a worked example for a transport-goods company chief executive. Three larger persona columns follow, illustrated with blue, red and pink helmeted characters. They represent aplatform supervisor aged 28, an operations analyst aged 30 and a maintenance engineer aged 33. Each column contains name, age and occupation, followed by key characteristics, behaviour patterns, goals, needs, frustrations and motivations, then existing, extreme or hypothetical scenarios. Green, orange and yellow sticky notes organise the three profiles. The layout links each user’s characteristics and needs to situations in which a product, service or system may be used.
Figure 5 illustrates two types of devices used for design tasks within Miro: laptops and Microsoft Surface Hubs. Workshop participants collaborate as teams to develop design outputs under the guidance of a facilitator, who supports each team to ensure cohesion and structured progress.
The facilitator (far left) coaching the design team on completing their design tasks in a workshop.

2.2. Define
In the Define phase, participants apply Activity Diagrams, System Functions, and Hierarchy of Purpose to systematically structure and refine design opportunities. In the Activity Diagram method, human designers map sequences of user interactions with the product, service, or system, providing a structured representation of key activities. The System Functions method then involves defining and categorizing the functional requirements of the intended design solution, ensuring alignment with user needs and design objectives. Finally, the Hierarchy of Purpose method supports the reframing of the original opportunity statement by abstracting it into broader opportunity statements, allowing for a more strategic exploration of design directions. At this stage, AI is introduced to refine and generate more specific opportunity statements based on an initial HMW to support the Hierarchy of Purpose method. Before progressing to the Develop phase, human designers select one or two refined opportunity statements to serve as the foundation for ideation. An example of the Hierarchy of Purpose template used in the design innovation workshop is presented in Figure 6.
Template for the Hierarchy of Purpose method done in a Miro board. Participants abstract their problem statement into more generalized (“why,” green in this sample) or more specific problem statements (“how,” blue in the sample) in order to develop a more actionable and impactful problem statement. AI use in this step is generally limited to ensure contextual alignment is driven by empathy.

Figure 6. Long description
The left side gives instructions for moving from an original How Might We statement to broader and more specific alternatives. On the right, a yellow central statement asks how to design a streamlined decision-support system for operators in high-stress, time-sensitive operations to reduce cognitive overload and improve decision accuracy. Connected green notes above explore why this matters, including information overload, mismatches between systems and human judgement, and conflicting opinions. Connected blue notes below explore how to address it through more specific questions and possible directions. Arrows connect related statements at different levels. The hierarchy supports reframing the design opportunity before choosing a direction for ideation.
2.3. Develop
In the Develop phase, the methods applied for ideation are Mind Mapping, C-Sketch, and Real-Win-Worth. Mind Mapping enables human designers to generate a diverse set of ideas by structuring text-based concept descriptions in a hierarchical tree, which are then expanded with the assistance of AI (in the AI-enhanced workflow) to introduce additional variations and explore alternative directions. C-Sketch is a collaborative sketching technique in which each participant draws three ideas on a sheet of paper before passing it to a teammate. Each participant then iterates on the sketches, adding new ideas or modifying ideas already on the page, before passing the sheet again at timed intervals until the sheets return to the original participants. C-Sketch leverages group efficiency by having each team member actively contribute in parallel. Real-Win-Worth is a structured decision-making method that allows designers to systematically evaluate and filter ideas based on three key criteria: Win (desirability), Worth (viability), and Real (feasibility). RWW provides systematic filtering through sequential elimination and facilitates a smooth, rapid selection process that is suitable for evaluating large ideation sets. By applying this approach, designers identify the most promising concepts to advance into the Deliver phase.
An example of the Mind Mapping template used in the design innovation workshop is presented in Figure 7.
Template for the Mind Mapping method done in a Miro board. Here, each participant chooses a colour of post-its to track their ideas; these are clustered in the traditional manner, and in the AI-augmented workflow participants use foundation models to generate additional ideas after a first round of human-led ideation.

Figure 7. Long description
The left panel asks each team member to choose a sticky-note colour and brainstorm at least ten ideas individually, encouraging novel ideas without judgement. Six coloured note sets distinguish contributors. In the centre, a How Might We statement is surrounded by branching clusters and subclusters of related ideas. Participants discuss and categorise the notes, then generate at least ten more ideas. The right panel demonstrates ChatGPT prompting using a job-matching opportunity. It asks for ten novel, varied, high-quality and creative ideas and shows how to assign ChatGPT an experienced professional role. Participants select useful answers, add them as sticky notes using “Yes, and…,” and tag AI-aided ideas to distinguish them from human contributions.
2.4. Deliver
In the Deliver phase, human designers engage in rapid paper prototyping, culminating in a pitching exercise which is typically attended by senior stakeholders in their organization to secure buy-in and seed future projects. Methods applied in this section are storyboarding, paper prototyping, and pitching. In storyboarding, participants craft a sequence of images depicting usage of the proposed solution; while in paper prototyping, the form is rapidly expressed using basic crafting materials to support a live-action demonstration, which is not functional but serves to demonstrate the concept. AI can support this process by providing high-fidelity images for storyboards, as well as rapid mock-ups of user interfaces or detailed renderings of design concepts to support the pitch exercise (prototypes of UI interfaces or other software may be partially functional through AI-accelerated workflows).
An example of one of the prototyping methods, the Storyboarding template, used in the design innovation workshop is presented in Figure 8.
Template for the Storyboarding method done in a Miro board. Participants prepare content through web search, drawing, or AI generation to populate the storyboard sequence.

Figure 8. Long description
Instructions on the left explain that a storyboard tells a sequence of events through images and captions. Six numbered frames are arranged in two rows of three and read left to right. Frame 1 shows a patient receiving test instructions. Frame 2 shows a lung-function test without visual feedback. Frame 3 shows preparation and waiting. Frame 4 shows the patient undertaking cardiopulmonary exercise testing on exercise equipment. Frame 5 shows the monitoring screens seen during the test; its caption notes a lack of stimulation or motivation to reach the target. Frame 6 shows staff checking the patient manually and verbally; its caption notes that arm movement can affect readings and that staff must look away from vital-sign displays to check the patient. The sequence illustrates how a storyboard reveals issues across a user experience.
In each workshop, participants are encouraged to deliver an engaging and interactive pitch to a panel consisting of the design trainer, design facilitators, fellow participants and senior stakeholders from their organization (when possible). This presentation involves demonstrating the developed prototypes and articulating the proposed solutions’ value and feasibility. To foster engagement and recognize exceptional work, a mini competition is typically held at the conclusion of the workshop, where all participants vote on the most compelling pitch and the winning team receives an award.
3. Research methodology
This section presents the overall research methodology applied in the study, as shown in Figure 9. Participants engaged in one of two workshop formats, either human-only or AI-augmented. We first directly compare the quality of the results from individual methods generated by humans in the traditional, human-only workflow against results using an AI tool. This allows direct comparison with metrics using identical problem statements. Second, we evaluated the participant preference for the AI-augmented workshop format versus the baseline workshop format. It should be noted that while ChatGPT 3.5 was used in generating synthetic data for direct comparison to the human-only workshop flow, participants in the augmented workshop flow are encouraged to apply a variety of AI tools at the end of each method to enhance results and streamline their workflows, thus enabling the proposed approach to remain relevant as AI tools rapidly evolve. The qualitative comparison investigates the overall perception of an end-to-end AI-augmented workflow. The direct comparisons are designed to evaluate whether replacing certain steps of the design process with AI augmentation is associated with any reduction of quality of those steps; the comparison is intended to check that AI augmentation does not degrade the quality of individual steps; it is illustrative and boundary-setting rather than a controlled performance test.
Research and data collection strategy.

Figure 9. Long description
Two parallel horizontal flows represent Human–AI Teaming (augmented) and Human (baseline). Both progress through Discover, Define, Develop and Deliver, followed by a Survey box. Under the baseline pathway, arrows from Define and Develop lead to two Replicate boxes for AI-generated content. The human outputs and replicated AI outputs feed an Evaluate box for comparison. The legend identifies white boxes as design phases or activities, pink boxes as qualitative analysis, pale green boxes as AI-generated content and pale blue boxes as quantitative analysis. The design separates participant feedback on the complete workshop from comparisons of matched human and AI outputs for selected methods.
3.1. Prompting strategy for AI-driven design tasks
Prompts for ChatGPT 3.5 were crafted to parallel typical design workshop instructions and problem statements, maintaining consistency in task framing and language while allowing the natural variation inherent to real design communication. This approach follows the prompting guidelines provided in the workshop for AI-augmented methods and prioritizes ecological validity, acknowledging that minor differences in prompt phrasing or output fidelity are characteristic of authentic design practice – while AI tools continually advance in practice the objective is to evaluate integration into the workflow and using tools available at the time of the study.
Both ideation and clustering tasks were conducted through ChatGPT 3.5. For clustering, GPT was prompted to group user need statements by semantic similarity, mirroring the logic of human affinity diagramming to ensure that both conditions followed comparable synthesis workflows. As AI baseline models and refined design tools continue to evolve, this study represents a snapshot of capability at the time of investigation rather than an exhaustive analysis of prompt engineering or verbosity effects. The focus is on demonstrating whether AI-augmented steps can produce outputs of comparable quality to human-only teams within an authentic workshop workflow.
Example prompts used during the replication exercise included the following:
Clustering:
-
• Can you help me cluster these statements by semantic similarity: User need 1; User need 2; User need; …
Ideation (30 ideas total, 10 per prompt):
-
[1] Give 10 ideas that are novel, varied, high quality, and creative + [reframed opportunity statement].
-
[2] Give 10 ideas that are wild and imaginative + [reframed opportunity statement].
-
[3] It is the year 2080 – list 10 crazy and inventive ideas based on new technologies, lifestyles, and discoveries in the future + [reframed opportunity statement].
3.2. Participants and data collection
Data for this study were collected from past design innovation workshops done with local professional organisations; these were workshops where the AI enhancement methods had not yet been introduced. Each team consisted of 5–6 members. Participants were industry professionals from varied backgrounds, including design engineering, systems engineering, architecture, management, and operations, with experience typically ranging from 3–15 years in their respective fields. The teams were self-formed and addressed real problems faced by their respective organizations over the course of a three-day workshop. For the direct comparison of single-method results (AI vs. Human), data sets analysed included the results of Affinity Analysis and Mind-Mapping as representative samples of two activity types: organization (synthesis) and expansion (ideation).
This experimental design allowed for a direct one-to-one comparison of human versus AI-generated results. In the AI-augmented workshops, humans will first generate results, and then refine them using AI, replacing certain steps in the design process as outlined above. Our objective here was to examine, within the constraints of a practice-based setting, whether AI-augmented steps remained of comparable quality to human-only steps; we do not treat this as a fully controlled comparison. We also report on user feedback for the integrated AI-augmented design workshops at the end of this experimental evaluation section. Direct comparison of results between AI- and non-AI-augmented workshops was deemed less suitable owing to the large amount of variations in problem statements. Some are more abstract, others less abstract, making direct comparison difficult. Therefore, we directly replicate AI-generated results for the exact problem statement addressed by each human team and compare these.
For the Affinity Analysis dataset, for AI data generation, we used ChatGPT 3.5 to cluster the user needs extracted from each of the human team’s collaboration boards. This clustering was performed for each team, resulting in an equal number of AI-augmented cluster datasets.
For the mind-mapping dataset, for AI data generation, we used the same Reframed Opportunity Statement as each human team as a prompt in ChatGPT 3.5 to generate ideas for each prompt that the human teams used. We asked ChatGPT to generate the same number of ideas as the human teams, and then categorise those ideas to form a mind map. This process resulted in an AI-generated dataset for mind mapping, each mapping one-to-one with the 20 human teams’ data.
3.3. Metric selection
With numerous creativity metrics established in design research, such as novelty, feasibility, and user-centred impact, the present study focused on a targeted set of evaluation criteria aligned with the methods under examination. The metrics of Accuracy, Insightfulness, Quality, and Desirability were selected to reflect the specific nature of the synthesis and ideation tasks. This deliberate focus enables a clear assessment of method-level performance and provides a foundation for incorporating broader creativity metrics in subsequent investigations.
3.4. Data analysis methods
The performance metrics of Affinity Analysis are Accuracy of the user need clusters and Insightfulness of the user need clusters. Herein, we define accuracy as “degree to which a need is in the correct cluster,” and insightfulness as “degree to which the inclusion of a need in a cluster adds meaningfully to understanding the user.” The performance metrics of Mind Mapping are Quality of the ideas and Desirability of the ideas. Where quality and desirability follow typical definitions “degree to which the solution is well-formed and potentially useful,” “degree to which the solution addresses user needs effectively.” Two independent designers evaluated each design method using their respective assessment metrics, and inter-rater agreement was computed using Cohen’s Kappa correlation technique. The AI-generated content was produced separately by the research team, while the evaluators were experienced design practitioners who did not participate in generating either the AI or human workshop outputs. To ensure impartiality, the raters were blinded to the source condition (human-only or AI-generated) before performing the evaluations. For Affinity Analysis, inter-rater agreement values were 0.645 for Accuracy and 0.634 for Insightfulness. For Mind Mapping, agreement values were 0.658 for Quality and 0.638 for Desirability. These fall within the range of moderate to substantial agreement. Following the blind evaluation, the raters jointly reviewed and resolved any discrepancies to establish the final consensus scores used for analysis. The coding scheme for Accuracy of the user need clusters in Affinity Analysis is given in Appendix.
3.5. Accuracy rating description
To evaluate the Accuracy, each reviewer determined a rating for 259 clusters of user needs (clusters-by-human and clusters-by-AI) where each cluster contains at least 1 user need. There are 152 clusters-by-human and 107 clusters-by-AI. The metric scale for the Accuracy rating is given in Appendix.
We confirm that each need is valid and fits the category into which it was assigned using the following logic sequence:
-
1. What does a “valid user need” mean? A valid user need contains a requirement/need/desire of a user that ought to be addressed. It does not contain a solution, function, or a scenario.
-
2. What does a “user need that fits the cluster name” mean? A user need that fits the cluster name means this user need aligns with the cluster name that is being represented/defined.
3.6. Insightfulness rating description
To evaluate the Insightfulness, each reviewer determined a rating for the same 259 clusters of user needs (clusters-by-human and clusters-by-AI) as in the Accuracy rating, where each cluster contains at least 1 user need. There are 152 clusters-by-human and 107 clusters-by-AI. The metric scale for the Insightfulness rating is given in Appendix.
We also consider whether the inclusion of a user need in a given cluster is insightful as follows:
-
1. What does a “user need is insightful” mean? A user need is insightful when it is useful, and there are some surprising/non-obvious elements being observed. It answers the question of “Would you have thought of this new perspective if the user need is not mentioned?”
An example of Insightfulness ratings applied to a small subset of the ideas is given in Appendix.
3.7. Quality rating description
To evaluate the Quality, each reviewer determined a rating for 1,779 ideas (ideas-by-human and ideas-by-AI). There are 152 ideas-by-human and 107 ideas-by-AI. The metric scale for the Quality rating is given in the table below. The rubric to rate the Quality of the ideas in Mind Mapping is given in Appendix.
3.8. Desirability rating description
To evaluate the Desirability, each reviewer determined a rating for the same 1,779 ideas (ideas-by-human and ideas-by-AI) as in the Quality rating. There are 1,089 ideas-by-human and 690 ideas-by-AI. The metric scale for the Desirability rating is given in the table below. The rubric applied to rate the Desirability of the ideas in Mind Mapping is given in Appendix.
4. Results
Overall ratings are accumulated and summarized into a table (Appendix). The table below shows the averages of the 20 selected Opportunity Statements from the 20 teams in the human-only condition. These data sets were evaluated for the metrics of Affinity Analysis (Accuracy and Insightfulness) and Mind Mapping (Quality and Desirability). The columns “Human” and “AI” mean that the respective metrics have their outputs done by humans and AI separately. For clarity, the same team–problem statement pairing was applied consistently across statements 2–20. For statement 1, one team’s Mind Mapping data were unavailable, and an additional team dataset was substituted to maintain a complete set of 20 samples. As this study draws from practice-based workshops rather than laboratory conditions, some variance in experimental parameters is expected.
4.1. Accuracy and insightfulness overall average
Next, we report the overall average of the Accuracy and the Insightfulness metrics across all the Opportunity Statements separated by Human and AI (Table 2).
Overall average between human and AI (affinity clustering)

Table 2. Long description
The table compares overall mean ratings for human and AI affinity clustering on two metrics, each rated from 1 to 5. Accuracy is 3.83 for humans and 4.22 for AI. Insightfulness is 2.40 for humans and 2.41 for AI. AI has the higher average accuracy rating, while the insightfulness averages are almost identical.
The results for Accuracy and Insightfulness averaged over all Opportunity Statements/groups are then calculated using a t-test. With a paired t-test done for the Accuracy results, the p-value is 0.0092, which is less than 0.05. This indicates that the result is statistically significant. With a paired t-test done for the Insightfulness results, the p-value is 0.8259, which is more than 0.05. Since the twentieth Opportunity Statement has no Insightfulness average in clusters-by-human, we only did the t-test for the first 19 Opportunity Statements. This indicates that there is no statistical difference in the results.
4.2. Quality and desirability overall average
Table 3 states the overall average of the Quality and the Desirability metrics across all the Opportunity Statements separated by Human and AI.
Overall average between human and AI (ideation)

Table 3. Long description
The table compares overall mean ratings for human and AI ideation on two metrics, each rated from 1 to 5. Quality is 2.59 for humans and 4.75 for AI. Desirability is 3.10 for humans and 4.42 for AI. AI outputs receive higher average ratings on both study-specific metrics. These are rubric scores; the accompanying discussion notes possible effects of output detail and rubric design.
The results for Quality and Desirability averaged over all Opportunity Statements/groups are then calculated using a t-test. With a paired t-test done for the Quality results, the p-value is less than 0.0001. This indicates that the result is statistically significant. With a paired t-test done for the Desirability results, the p-value is less than 0.0001, indicating a statistically significant difference on this metric.
AI-augmented ideas scored higher on these metrics on average. We interpret this cautiously: as discussed below, these scores could be confounded by output verbosity and study-specific rubrics, so we read them as evidence that AI augmentation did not reduce quality, rather than as evidence of intrinsic superiority.
4.3. General feedback from participants
This section reports participants’ self-reported perceptions of the AI-augmented workflow; it characterises overall preference and satisfaction rather than a fine-grained analysis of how participants engaged with AI at each step. Data were gathered using short surveys administered at the end of each workshop day to capture evolving perceptions of engagement, relevance, and learning across the multi-day sessions. The survey instrument consisted of Likert-scale and numerical rating questions designed to measure participant engagement, perceived relevance, clarity of delivery, and confidence in applying the introduced methods. The surveys included questions such as “I found the workshop engaging,” “The methods covered are relevant to my work,” and “I feel confident applying these methods.”
Results presented here represent the aggregated averages across all survey questions and all participants. Data include end-of-day responses from each day of the workshops (Day 1, Day 2 and Day 3) and from both experimental conditions – the human-only and AI-augmented workshops. Because the question phrasing and number of items varied slightly between workshop instances, aggregate scores were computed to enable cross-comparison. All ratings were converted to a standardized 1–10 scale, where 10 represented the highest level of agreement or satisfaction. This approach ensured consistency in evaluating both the AI-enhanced design methods and the overall workshop experience across different participant groups.
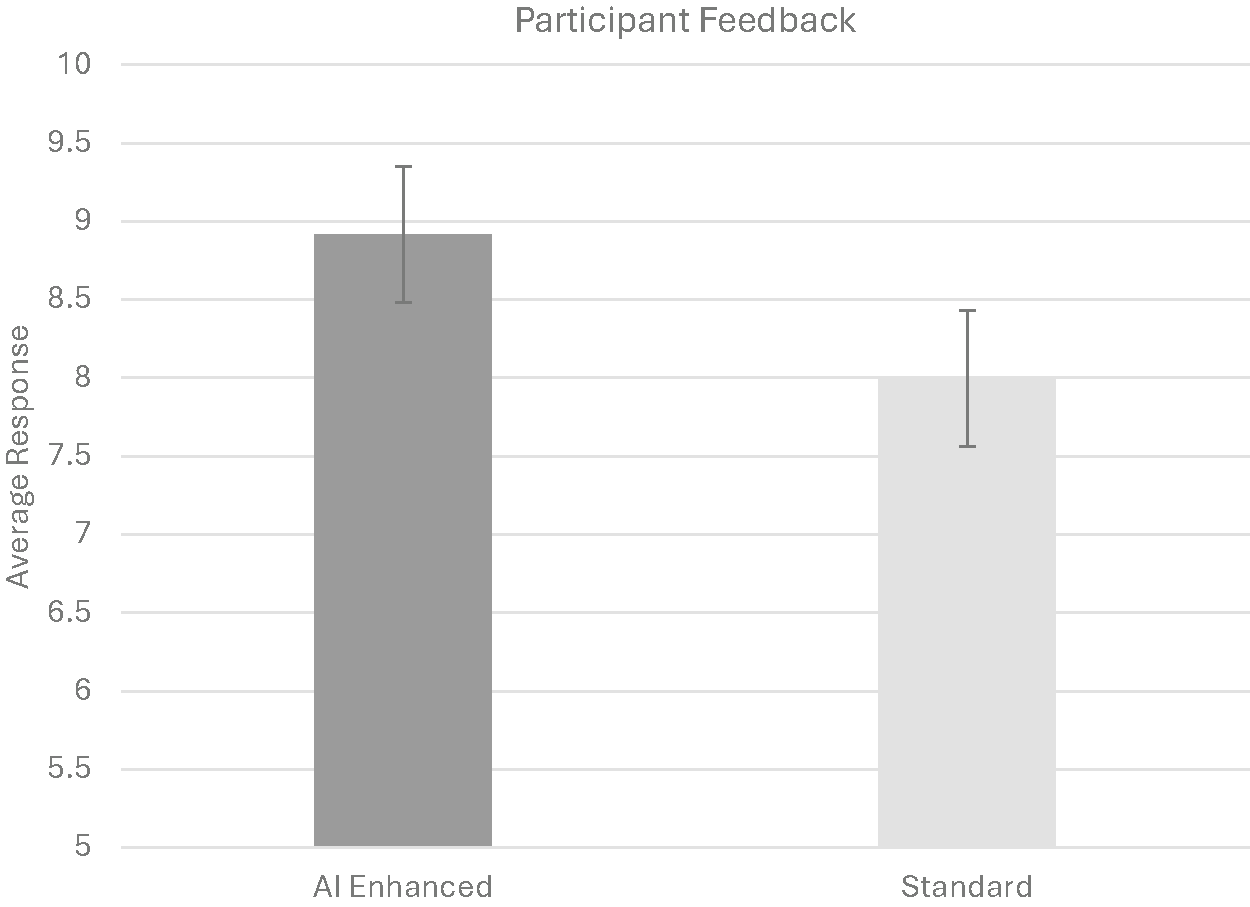
Overall, participants found the workshops informative and rated the AI-enhanced methods highly. The average score for the evaluation of specific AI-augmented methods was 8.54/10, while overall workshop feedback indicated that the majority of participants strongly agreed that the topics were relevant, well delivered, and applicable to their own professional practice (Figure 10). Collectively, they demonstrate a consistent positive response toward AI integration in design workflows and indicate that participants reported strong engagement and perceived value in the AI-augmented sessions; these are self-reported perceptions rather than measured learning outcomes.
Aggregated participant feedback on overall workshop experience (a) and applied methods (b), comparing pre- and post-incorporation of AI-ideation methods. Results represent total averages across all survey questions and end-of-day evaluations (Days 1, 2 and 3) for both workshop formats. Data are averaged across multiple human-only and AI-augmented workshops conducted between 2022 and 2024. Plus or minus one standard deviation shown: 0.43 and 0.46, respectively.

Figure 10. Long description
The chart is titled Participant Feedback. The horizontal axis compares AI Enhanced and Standard workshops. The vertical axis, Average Response, runs from 5 to 10 in increments of 0.5. The dark grey AI Enhanced bar reaches approximately 8.91 and the light grey Standard bar approximately 7.99, a difference of about 0.92 points. Both bars have vertical error bars, identified in the caption as plus or minus one standard deviation. Responses are aggregated across survey questions and end-of-day evaluations for Days 1, 2 and 3 of workshops held from 2022 to 2024. The bars represent self-reported workshop feedback.
5. Discussion
Examination of the method-level results indicates that AI-augmented steps performed comparably to human teams in Affinity Analysis (synthesis) and Mind Mapping (ideation), within a semi-controlled, practice-based setting. However, these findings must be interpreted with caution, as multiple factors influence the comparative performance of human- and AI-generated outputs.
For Affinity Analysis, AI-generated clusters scored modestly higher in accuracy. This is consistent with AI supporting structural organisation of user needs; note that in this task AI only organised human-generated content and produced none of its own. However, in terms of insightfulness, AI-generated clusters scored equivalently to human-generated clusters. It should be noted that this reflects that AI performed well in terms of generating clusters that meaningfully capture similarity between ideas. Note that in the Affinity mapping task, AI did not generate any content, but rather simply organised needs generated by the team.
For Mind Mapping, AI-augmented ideas scored higher on the quality and desirability metrics (by 83% and 42% on these rubrics); however, these differences may be substantially attributable to verbosity and rubric design and should not be read as a clear performance advantage. It may be noted that AI-generated ideas demonstrated a greater level of detail, which may have potentially influenced apparent quality, while humans often reported more shorthand and brief descriptions. While detail is important to accurately portray an idea, there may also be some value to ambiguity, and this topic should be explored further in future work. However, this result is consistent with AI being useful in generative tasks, while remaining subject to the confounds noted above.
Given that such results are generated in a matter of seconds, while the same process may take several hours for a human team, there is a clear opportunity to apply AI during design to expand and refine the initial insights generated by human teams.
These results are broadly consistent with contemporary studies reporting that AI can contribute usable design outputs. Furthermore, they extend the evaluation of AI in design to an integrated, end-to-end design innovation context, where participants responded positively and found the workshops more engaging and effective when the process incorporated integrated AI support.
We observe that AI impacts design through several paradigm shifts: it offers the ability to synthesize user data, generate images for persona or scenario visualization, expand the design concept search space, rapidly produce code or UI prototypes, and facilitate generating and evaluating bills of materials. In short, AI enables designers to rapidly explore the design space, automating and augmenting research in much the same way that search engines revolutionized data retrieval, but across more stages and more processes within the design workflow.
However, a number of studies have identified cognitive offloading as a concern. Anecdotally, we observe that in cases of rush, or with individuals new to design, they may over-rely on AI-generated results, and while AI-supported idea generation is productive, it may lack the nuance or contextual relevance of human-generated content when applied to real-world problems. This underscores the critical role of the human as navigator, closely integrated within the process, as well as the importance of leading with human-generated ideas to mitigate fixation. As established in prior work, once exposed to existing ideas, designers are cognitively predisposed to anchor on them, conserving the activation energy otherwise required to generate novel alternatives. Care should therefore be taken to critically evaluate AI outputs and push beyond initial generative results. Future work should explore the pacing of this human–AI dialogue, conduct integrative reviews of the long-term cognitive impacts of AI on design, and develop step-by-step best practices for AI integration – recognizing that these will continue to evolve alongside the tools themselves.
To this end, the approach presented offers an illustrative, practice-based reference for how AI can be integrated across a full design workflow, providing an example structure for human–AI teaming throughout the design process. By mapping out an explicit template for the human–AI dialogue, specifying an example flow for where human input leads and where AI augments, a clear expectation is established. This is particularly geared to support educational and early-stage (novice) practice settings, establishing that the end-to-end design process is not intended to be fully automated. The template serves as a scaffold to facilitate preserving human agency, critical for meaningful outcomes, at each phase while making the potential to leverage AI contributions deliberate.
6. Limitations and future work
While this study provides empirical comparisons between human and AI-augmented design methodologies, the experimental approach is semi-controlled, introducing several limitations. Conducting design workshops with practicing professionals offers valuable ground-truth data on how AI may be perceived and integrated into real-world design processes. However, this approach also introduces variability that limits strict control over experimental conditions.
First, participant variability may influence the results, as differences in professional backgrounds, expertise levels, and problem-solving approaches could contribute to variations in human-generated outputs. Second, problem statement variability across different workshops introduces another layer of complexity, as certain design challenges may be inherently more suited to AI augmentation than others. To mitigate this, comparisons were conducted using the same problem statements from the human-only workshops, with AI-generated sample content produced on a matched team-by-team basis. Third, the time span of the workshops presents additional external factors, including differences in facilitation styles and potential iterative learning effects across participants.
As the present study focused primarily on text-based content to enable quantitative comparison across methods, future work should extend this approach to include visual and multimodal design activities – particularly those that alternate dynamically between sketches, diagrams, and models. Future investigations could include: (1) evaluation of sketch-based and visual design content; (2) incorporation of multimodal inputs such as text, image, and 3D geometry; and (3) exploration of combinatorial or adaptive AI workflows that dynamically reconfigure based on user interaction.
Finally, this study was intentionally scoped as an initial examination of process-level integration between human and AI design activities rather than a controlled evaluation of prompt engineering, verbosity effects, or model optimization. Such variables will continue to evolve as AI systems advance; therefore, efforts to control them rigidly would risk obscuring the practical realities of contemporary design workflows. The present approach instead reflects how AI can be naturally integrated within authentic design practice, offering a foundation for future controlled studies to build upon. Relatedly, while the survey captures participant preference and self-reported experience, a fine-grained qualitative analysis of how participants engaged with AI across individual workflow steps is beyond the scope of this practice-based study; we identify this as a direction for future work.
7. Conclusions
As AI tools continue to evolve rapidly, with a growing body of research demonstrating performance comparable to human designers across a range of tasks, there is a need to examine how established design process approaches, such as the Triple Diamond, should adapt to accommodate human–AI collaboration. This study explored a dialogue-based strategy in which participants alternate between human-driven and AI-driven activities across the end-to-end design process. Importantly, the proposed approach is agnostic to both specific design methods and AI tools, allowing it to remain applicable as methods and models continue to advance. The approach and workshop templates are provided in detail, and the analysis indicates positive participant reception.
Participants showed a clear preference for the AI-augmented workshop format over the human-only version. Industry professionals described the AI-augmented sessions as more engaging and efficient, particularly in maintaining progress during ideation. This preference is supported by the quantitative comparisons, which indicate that AI-augmented outputs in both methods were of comparable quality, structurally coherent, and produced rapidly; we do not claim a performance advantage given the noted confounds.
The workshops involved participants with three to 15 years of experience in engineering, systems, product development, or operations fields. While they were familiar with applied engineering and design practice, most were relatively new to structured design innovation methods. The AI-augmented approach appeared to make these methods more approachable and practical, leading to strong participant engagement and continued interest in future AI-augmented workshops. This trend suggests that AI is increasingly viewed not as a disruptive tool or “at odds” with the human designer, but as a natural extension of the design process.
Overall, the findings indicate that AI-augmented co-design can support a positive experience of design activities. Further, the method-level results indicate that such augmentation did not degrade quality in the sampled methods. Together, these observations point toward the growing role of AI as an enabling and integrative element in future design innovation practice.
Acknowledgements
This work is supported by the Singapore University of Technology and Design, where workshops were implemented through the SUTD Academy. Research direction and analysis were supported by the Engineering Product Development pillar and SUTD Academy. The authors extend their gratitude to Professor Kristin Wood for his support of the project, including critical contributions to the methodology, as well as the design of the baseline Miro templates, and his role as lead instructor in numerous experimental workshops together with the SUTD Academy team. Special thanks are also due to Poon King Wang for strategic guidance, as well as Immanuel Koh, and Professor Tai Lee Siang, Deputy President of SUTD, for support of this work and conceptual direction regarding the Design AI Triple Diamond. Likewise, attribution is due to the hard work of the SUTD Academy Team for their valuable feedback, contributions to data analysis, and facilitation of the method’s implementation as workshop leaders and facilitators. During the preparation of this manuscript (2025–2026), the authors used Anthropic’s Claude models (various versions across the Opus and Sonnet families, accessible at https://claude.ai) to review drafts and provide editorial comments. The authors reviewed and edited all content directly and take full responsibility for the final manuscript.
Appendix: Metrics applied in quantitative analysis
Accuracy Score =
$ \frac{a}{n} $
 , where
-
a = no. of user needs that fit the cluster name.
-
n = total no. of user needs in the cluster.
Insightfulness Score =
$ \frac{b}{n} $
 , where
-
b = no. of user needs that have one or more insights.
-
n = total no. of user needs in the cluster.
Accuracy coding scheme with the procedures clearly explained

Table A1. Long description
The two columns give the step number and action. Step 1: understand the opportunity statement, personas and scenarios. Step 2: go to the first cluster. Step 3: understand the cluster and its user needs. Step 4: count needs that are both valid user needs and fit the cluster name. Step 5: calculate the cluster’s accuracy score. Step 6: convert that score to a rating from 1 to 5. Step 7: go to the next cluster. Step 8: repeat steps 3 through 7 until all clusters have been rated. The accompanying formula divides the number of needs fitting the cluster name by the total number of needs in that cluster.
Definitions applied to the Accuracy rating with a scale of 1–5 based on the Accuracy Score generated

Table A2. Long description
Columns represent accuracy ratings 1 to 5, with rows for definitions and score intervals. Rating 1, not accurate, covers scores 0–0.20: the cluster minimally addresses user needs. Rating 2, less accurate, covers 0.21–0.40: partial alignment lacks depth or comprehensiveness. Rating 3, moderately accurate, covers 0.41–0.60: needs are somewhat reflected, with room for improvement. Rating 4, very accurate, covers 0.61–0.80: most essential aspects of identified needs are covered. Rating 5, extremely accurate, covers 0.81–1.00: all identified needs are comprehensively and precisely addressed. Accuracy score is the number of user needs fitting the cluster name divided by the total number of needs in the cluster.
A worksheet for rating the Accuracy extracted from a small subset of the dataset

Table A3. Long description
The columns give cluster name, total user needs, needs fitting the cluster, accuracy score and rating. Winning a war: 1 total need, 0 fitting, score 0, rating 1. Work Efficiency: 13 total, 7 fitting, score 0.54, rating 3. Cybersecurity: 7 total, 6 fitting, score 0.86, rating 5. Communication: 3 total, 2 fitting, score 0.67, rating 4. Collaboration: 7 total, 3 fitting, score 0.43, rating 3. Personal Space: 2 total, 0 fitting, score 0, rating 1. Happiness: 5 total, 0 fitting, score 0, rating 1. Cybersecurity has the highest accuracy score, followed by Communication.
The coding scheme to rate the Insightfulness of the user need clusters in Affinity Analysis is as follows (Table A4):
Insightfulness coding scheme with the procedures clearly explained

Table A4. Long description
The two columns give step number and action. Step 1: select clusters with accuracy ratings of 3 or above, termed accurate clusters. Step 2: understand the opportunity statement, personas and scenarios. Step 3: go to the first accurate cluster. Step 4: understand it and its user needs. Step 5: judge whether each need is insightful. Step 6: count insightful needs. Step 7: calculate the insightfulness score. Step 8: convert the score to a rating from 1 to 5. Step 9: go to the next accurate cluster. Step 10: repeat steps 4 through 9 until all eligible clusters have been rated. The score is the number of needs containing one or more insights divided by the total needs in the cluster.
Definitions applied to the Insightfulness rating with a scale of 1–5 based on the Insightfulness Score generated

Table A5. Long description
The table gives definitions and score intervals for five ratings. Rating 1, not insightful, covers 0–0.20: needs are simplistic, obvious or unrelated, offering little useful direction. Rating 2, less insightful, covers 0.21–0.40: some preferences or pain points emerge, but specificity, clarity and actionable context are lacking. Rating 3, moderately insightful, covers 0.41–0.60: useful understanding supports development but needs further exploration. Rating 4, very insightful, covers 0.61–0.80: rich detail about preferences, goals and challenges identifies opportunities and guides decisions. Rating 5, extremely insightful, covers 0.81–1.00: comprehensive, deep understanding enables precise targeting of user needs and impactful solutions. The score divides needs containing at least one insight by all needs in the cluster.
A worksheet for rating the Insightfulness extracted from a small subset of the dataset

Table A6. Long description
Columns give cluster name, total user needs, needs with one or more insights, score and rating. Work Efficiency: 13 total needs, 6 insightful, score 0.46, rating 3. Cybersecurity: 7 total, 2 insightful, score 0.29, rating 2. Communication: 3 total, 1 insightful, score 0.33, rating 2. Collaboration: 7 total, 1 insightful, score 0.14, rating 1. Winning a war has 1 total need, Personal Space has 2 and Happiness has 5; their insightful-need counts, scores and ratings are blank. These three clusters fall below the accuracy threshold for insightfulness assessment. Blank entries are unscored, not zero scores.
Definitions applied to quality rating with a scale of 1–5

Table A7. Long description
The table defines ratings from 1 to 5. Rating 1: the idea is abstract or unclear and does not explain what it is, how it works or its advantages to users. Rating 2: the idea is understandable and briefly explains what it is for, but not how it works or its advantages. Rating 3: the idea is understandable, briefly explains its purpose and implicitly describes operation and/or user advantages. Rating 4: the idea is comprehensive, thoroughly explains its purpose and mentions user advantages, but incompletely describes how it works. Rating 5: the idea is comprehensive and fully explains its purpose, operation and advantages to users.
Definitions applied to desirability rating with a scale of 1–5

Table A8. Long description
The table defines ratings from 1 to 5. Rating 1: the idea is irrelevant to the opportunity statement or user needs, solves no problem and cannot motivate users. Rating 2: the idea is slightly relevant, solves only part of the problem and slightly motivates users. Rating 3: it is more relevant, solves only part of the problem and fairly motivates users. Rating 4: it is more relevant, almost fully solves the problem and moderately motivates users. Rating 5: it is most relevant, fully solves the problem and highly motivates users.
Average scores between human and AI

Table A9. Long description
The table consists of five columns. The first column lists twenty opportunity statements. The subsequent four columns are titled Accuracy, Insightfulness, Quality, and Desirability. Each of these four columns is subdivided into Human and A I sub-columns to show comparative mean ratings.
* Row 1: Statement 1. Accuracy: Human 3.4, A I 3.8. Insightfulness: Human 3.1, A I 3.5. Quality: Human 3.2, A I 3.7. Desirability: Human 3.0, A I 3.4.
* Row 2: Statement 2. Accuracy: Human 3.5, A I 3.9. Insightfulness: Human 3.2, A I 3.6. Quality: Human 3.3, A I 3.8. Desirability: Human 3.1, A I 3.5.
* Row 3: Statement 3. Accuracy: Human 3.3, A I 3.7. Insightfulness: Human 3.0, A I 3.4. Quality: Human 3.1, A I 3.6. Desirability: Human 2.9, A I 3.3.
* Row 4: Statement 4. Accuracy: Human 3.6, A I 4.0. Insightfulness: Human 3.3, A I 3.7. Quality: Human 3.4, A I 3.9. Desirability: Human 3.2, A I 3.6.
* Row 5: Statement 5. Accuracy: Human 3.2, A I 3.6. Insightfulness: Human 2.9, A I 3.3. Quality: Human 3.0, A I 3.5. Desirability: Human 2.8, A I 3.2.
* Row 6: Statement 6. Accuracy: Human 3.4, A I 3.8. Insightfulness: Human 3.1, A I 3.5. Quality: Human 3.2, A I 3.7. Desirability: Human 3.0, A I 3.4.
* Row 7: Statement 7. Accuracy: Human 3.5, A I 3.9. Insightfulness: Human 3.2, A I 3.6. Quality: Human 3.3, A I 3.8. Desirability: Human 3.1, A I 3.5.
* Row 8: Statement 8. Accuracy: Human 3.3, A I 3.7. Insightfulness: Human 3.0, A I 3.4. Quality: Human 3.1, A I 3.6. Desirability: Human 2.9, A I 3.3.
* Row 9: Statement 9. Accuracy: Human 3.6, A I 4.0. Insightfulness: Human 3.3, A I 3.7. Quality: Human 3.4, A I 3.9. Desirability: Human 3.2, A I 3.6.
* Row 10: Statement 10. Accuracy: Human 3.2, A I 3.6. Insightfulness: Human 2.9, A I 3.3. Quality: Human 3.0, A I 3.5. Desirability: Human 2.8, A I 3.2.
* Row 11: Statement 11. Accuracy: Human 3.4, A I 3.8. Insightfulness: Human 3.1, A I 3.5. Quality: Human 3.2, A I 3.7. Desirability: Human 3.0, A I 3.4.
* Row 12: Statement 12. Accuracy: Human 3.5, A I 3.9. Insightfulness: Human 3.2, A I 3.6. Quality: Human 3.3, A I 3.8. Desirability: Human 3.1, A I 3.5.
* Row 13: Statement 13. Accuracy: Human 3.3, A I 3.7. Insightfulness: Human 3.0, A I 3.4. Quality: Human 3.1, A I 3.6. Desirability: Human 2.9, A I 3.3.
* Row 14: Statement 14. Accuracy: Human 3.6, A I 4.0. Insightfulness: Human 3.3, A I 3.7. Quality: Human 3.4, A I 3.9. Desirability: Human 3.2, A I 3.6.
* Row 15: Statement 15. Accuracy: Human 3.2, A I 3.6. Insightfulness: Human 2.9, A I 3.3. Quality: Human 3.0, A I 3.5. Desirability: Human 2.8, A I 3.2.
* Row 16: Statement 16. Accuracy: Human 3.4, A I 3.8. Insightfulness: Human 3.1, A I 3.5. Quality: Human 3.2, A I 3.7. Desirability: Human 3.0, A I 3.4.
* Row 17: Statement 17. Accuracy: Human 3.5, A I 3.9. Insightfulness: Human 3.2, A I 3.6. Quality: Human 3.3, A I 3.8. Desirability: Human 3.1, A I 3.5.
* Row 18: Statement 18. Accuracy: Human 3.3, A I 3.7. Insightfulness: Human 3.0, A I 3.4. Quality: Human 3.1, A I 3.6. Desirability: Human 2.9, A I 3.3.
* Row 19: Statement 19. Accuracy: Human 3.6, A I 4.0. Insightfulness: Human 3.3, A I 3.7. Quality: Human 3.4, A I 3.9. Desirability: Human 3.2, A I 3.6.
* Row 20: Statement 20. Accuracy: Human 3.2, A I 3.6. Insightfulness: Human 2.9, A I 3.3. Quality: Human 3.0, A I 3.5. Desirability: Human 2.8, A I 3.2.
Overall, the A I scores are consistently higher than the Human scores across all four metrics for every statement.






 Open access

