INTRODUCTION
In order to comply with current environmental legislation (EU Water Framework (2000/60/EC), EU Nitrates Directives (91/676/EEC), and UK Climate Change Act reduction targets) it is necessary to reduce nitrogen (N) losses to the environment by improving N use efficiency. These increased legislative pressures to improve nutrient use efficiency, along with increasing costs of synthetic fertilizers, have resulted in organic manures, such as cattle slurry, no longer being viewed as a waste product but as a valuable source of nutrients to replace or supplement synthetic fertilizers (Müller et al. Reference Müller, Laughlin, Christie and Watson2011; Dale et al. Reference Dale, Ferris, Frost, Mayne and Kilpatrick2013).
In agricultural systems N is prone to losses through ammonia (NH3) volatilization, nitrate (NO3 −) leaching (i.e. removal in drainage water) and denitrification (i.e. transformations into gaseous forms) (Cameron et al. Reference Cameron, Di and Moir2013), with nitrification being the dominant pathway for N flow (Subbarao et al. Reference Subbarao, Sahrawat, Nakahara, Ishikawa, Kishii, Rao, Hash, George, Srinivasa Rao, Nardi, Bonnett, Berry, Suenaga and Lata2012). When slurry is applied to soil, non-mobile ammonium (NH4 +) can be converted to mobile NO3 − by nitrification, and if NO3 − is produced in excess of plant needs it is either leached out of the root zone or denitrified to gaseous N products (nitric oxide (NO), nitrous oxide (N2O) and dinitrogen (N2)). Not only do these loss processes decrease the efficiency of slurry-N, but they also have a detrimental impact on the environment. Wet and dry deposition of NH3 results in acidification and eutrophication, NO3 − leaching causes surface and groundwater contamination and is linked to human health and environmental problems (e.g. eutrophication of fresh water), and denitrification increases N2O emissions contributing to ozone depletion and global warming (Cameron et al. Reference Cameron, Di and Moir2013). Manures from agricultural livestock systems are estimated to contribute between 0·30 and 0·50 to global N2O emissions (Oenema et al. Reference Oenema, Wrage, Velthof, van Groenigen, Dolfing and Kuikman2005). In 2000, emissions of NH3 and N2O from land application of cattle manures accounted for 0·204 and 0·181 of all NH3 and N2O emissions, respectively, from animal manure management systems in the EU (Oenema et al. Reference Oenema, Oudendag and Velthof2007).
Nitrification inhibitors, such as dicyandiamide (DCD), inhibit the conversion of NH4 + to NO3 −, and therefore can be used as a mitigation strategy to reduce NO3 − leaching (Dennis et al. Reference Dennis, Cameron, Di, Moir, Staples, Sills and Richards2012) and N2O emissions (Di & Cameron Reference Di and Cameron2003). As well as decreasing N losses nitrification inhibitors can increase the availability of NH4 +, which may offer a plant nutritional benefit as plant uptake and assimilation of NH4 + requires less energy than that of NO3 − and also NH4 + can be used directly for protein supply (Salsac et al. Reference Salsac, Chaillou, Morot-Gaudry, Lesaint and Jolivet1987; Pasda et al. Reference Pasda, Hähndel and Zerulla2001). In addition, preferential NH4 + uptake may decrease the soil pH in the rhizosphere (Thomson et al. Reference Thomson, Marschner and Römheld1993), which may increase the solubility and therefore availability of micronutrients for plant uptake (Pasda et al. Reference Pasda, Hähndel and Zerulla2001).
The persistence of DCD and hence its efficacy is influenced by soil temperature (Zerulla et al. Reference Zerulla, Barth, Dressel, Erhardt, von Locquenghien, Pasda, Rädle and Wissemeier2001; Kelliher et al. Reference Kelliher, Clough, Clark, Rys and Sedcole2008), pH (Keeney Reference Keeney and Prosser1986), moisture content (Hendrickson & Keeney Reference Hendrickson and Keeney1979; Puttanna et al. Reference Puttanna, Nanje Gowda and Prakasa Rao1999) and soil organic matter content (Briggs Reference Briggs1975; Singh et al. Reference Singh, Saggar, Giltrap and Bolan2008). Since DCD is highly soluble (Zerulla et al. Reference Zerulla, Barth, Dressel, Erhardt, von Locquenghien, Pasda, Rädle and Wissemeier2001), mobility in soil may also be a factor affecting its efficacy in the field (Shepherd et al. Reference Shepherd, Wyatt and Welten2012).
Although many studies have shown the efficacy of DCD in reducing N2O emissions and NO3 − leaching (Williamson et al. Reference Williamson, Taylor, Torrens and Vojvodic-Vukovic1998; Di & Cameron Reference Di and Cameron2002, Reference Di and Cameron2003, Reference Di and Cameron2005, Reference Di and Cameron2006; Smith et al. Reference Smith, de Klein and Catto2008; Monaghan et al. Reference Monaghan, Smith and Ledgard2009), there have been no published studies on the effect of DCD on soil gross N transformations in the field. If DCD is to be used as a mitigation strategy to reduce N losses, further information is required on its effect on a range of soil N transformations.
In order to study the N production and consumption processes that occur simultaneously in soil, 15N isotope techniques must be utilized. The objective of the current study was to determine the effect of DCD on soil gross N transformations following cattle slurry (CS) application to a grassland site using a 15N tracing approach.
MATERIALS AND METHODS
Study site
The experimental grassland site was located at Hillsborough, County Down, Northern Ireland (54°46′N, 6°08′W, 116 m a.s.l.), where experiments were conducted on three different occasions (June 2010, October 2010, and March 2011). The soil (0–7·5 cm depth) is a sandy clay loam (65·8% sand, 11·5% silt, 22·7% clay, by volume) with moderate drainage. Soil pH was 6·17, loss on ignition was 10·75%, cation exchange capacity was 21·74 milliequivalents/100 g, soil total nitrogen was 3·46 mg/g and soil total carbon 43·7 mg/g. The long-term (1995–2010) average annual rainfall and daily air temperature for the site were 916 mm and 9·3 °C, respectively. The long-term (1995–2010) average monthly soil temperature at 5 cm depth was 9·1 °C, with a range of 2·0–17·7 °C. The sward was dominated by perennial ryegrass (Lolium perenne L.); white clover (Trifolium repens) and broad-leaved docks (Rumex obtusifolius) were present in low amounts (clover <0·02), and were removed using an appropriate herbicide prior to the start of the experiment. A new area of grassland was used for each of the three experimental applications and a basal dressing of phosphorus (P), potassium (K) and sulphur (S) was applied according to soil analysis and fertilizer recommendations (DEFRA 2010), prior to each experiment so that these major nutrients were not limiting grass growth.
Experimental treatments
Cattle slurry (33 m3/ha) amended with potassium nitrate (KNO3) (65 kg N/ha), with or without DCD (at 15% NH4 +-N content of the CS), was surface-applied to grassland with either the NH4 + or the NO3 − pool labelled with 15N (15CS14NO3, 14CS15NO3) at 50 at.% 15N excess, according to the procedure of Stevens et al. (Reference Stevens, Laughlin, Burns, Arah and Hood1997). Ammonium chloride (NH4Cl) amended with KNO3 (65 kg N/ha), with or without DCD, with either the NH4 + or the NO3 − pool labelled with 15N, served as controls for 15CS14NO3 and 14CS15NO3, respectively, having the same amount of NH4 +-N as the CS but no degradable carbon. In summary, there were eight treatments: (i)15CS14NO3 without DCD, (ii) 15CS14NO3 with DCD, (iii) 14CS15NO3 without DCD, (iv) 14CS15NO3 with DCD, (v)15NH4Cl14NO3 without DCD, (vi) 15NH4Cl14NO3 with DCD, (vii) 14NH4Cl15NO3 without DCD and (viii) 14NH4Cl15NO3 with DCD. The eight treatments were replicated four times in a randomized block design. Immediately prior to application, aliquots of CS or NH4Cl, KNO3 and DCD or water were mixed together and applied uniformly to the microplot area of 0·32 m2 (0·4×0·8 m).
Slurry collection and analysis
Dairy CS was collected prior to each of the three treatment application dates. Some properties of the raw and amended CS and application rates for each of the dates are shown in Table 1. As described by Stevens & Laughlin (Reference Stevens and Laughlin2001), CS was amended by adding either unlabelled urea or urea enriched at 99 at.% 15N and incubating the CS for 3 days at 35 °C to hydrolyse the urea to NH4 +-N. Slurry dry-matter (DM) content was determined by drying a representative slurry sample at 105 °C for 24 h. Total ammoniacal-N in the slurry was determined by steam distillation into boric acid solution, in the presence of magnesium oxide, followed by titration with 0·1 m sulphuric acid. Slurry pH was determined with an Orion pH meter Model 420A, volatile fatty acids (VFAs) by capillary gas–liquid chromatography and detected by a flame ionization detector, and total C by the Dumas method (Bremner & Mulvaney Reference Bremner, Mulvaney, Page, Miller and Keeney1982) with quantitative analysis by an Elementar Vario Max CN elemental analyser (Elementar, Hanau, Germany).
Properties and application rates of the cattle slurries

DM, dry matter.
Soil sampling and determination of mineral nitrogen concentration and 15N enrichment
Soil samples (five cores, 0–7·5 cm) were taken from the treated area (0·32 m2) on 12 sampling occasions over a period of 4 weeks after treatment application. On immediate return to the laboratory these cores were coarsely sieved using a 10 mm sieve and extracted using 2 m potassium chloride (KCl) (2 : 1 v : w proportion of KCl to sieved soil) by shaking in an orbital shaker at 200 rpm for 1 h. Each suspension was immediately centrifuged at 3600 rpm for 4 min and the supernatant was filtered through a No. 40 Whatman filter (Whatman International Ltd., Kent, UK). Filtrates were stored at 4 °C prior to the analysis of mineral N (NH4 + and NO3 −) concentrations and 15N enrichment of NH4 + and NO3 −. Concentrations of mineral N in the KCl extracts were determined using a Skalar San Plus automated wet chemistry analyser (Skalar Analytical B.V., Breda, Netherlands). The 15N contents of the NH4 + and NO3 − pools were determined by the generation of N2O (Stevens & Laughlin Reference Stevens and Laughlin1994; Laughlin et al. Reference Laughlin, Stevens and Zhuo1997) and subsequent determination by isotope-ratio mass spectrometry using a Europa Scientific 20–20 Stable Isotope Analyser interfaced to a Europa Scientific Trace Gas Preparation System ANCA-TG (Crewe, UK) with Gilson autosampler (Anachem, Luton, UK).
Quantification of gross nitrogen transformation rates
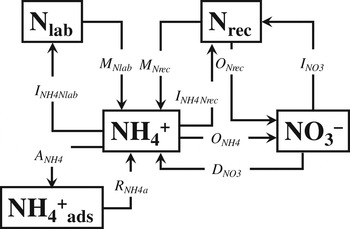
Gross soil N transformations were quantified with a 15N tracing model described by Müller et al. (Reference Müller, Rütting, Kattge, Laughlin and Stevens2007) which considers five N pools and ten simultaneously occurring N transformations (Fig. 1). The five soil nitrogen pools were: ammonium (NH4 +), adsorbed NH4 + (NH4 + ads), labile soil organic N (Nlab), nitrate (NO3 −) and recalcitrant soil organic N (Nrec). The model considered ten gross N transformations from these five N pools: mineralization of recalcitrant organic-N to NH4 + (MNrec), mineralization of labile N to NH4 + (MNlab), immobilization of NH4 + into recalcitrant organic-N (INH4_Nrec), immobilization of NH4 + into labile organic-N (INH4_Nlab), oxidation of NH4 + to NO3 − (ONH4), oxidation of recalcitrant organic-N to NO3 − (ONrec), immobilization of NO3 − to recalcitrant organic-N (INO3), dissimilatory NO3 − reduction to NH4 + (DNO3), adsorption of NH4 + on cation exchange sites (ANH4) and release of adsorbed ammonia (RNH4a). The transformation rates were calculated either by zero-order, first-order or Michaelis–Menten kinetics, indicated by 0, 1 or M, respectively, in Table 2.
15N tracing model used for the analysis of gross N soil transformation rates based on Müller et al. (Reference Müller, Rütting, Kattge, Laughlin and Stevens2007). N transformation and pool abbreviations are explained in the text.

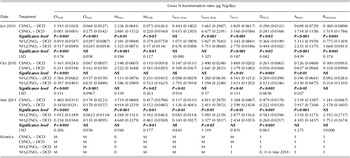
Gross N transformation rates (mean±s.e. in brackets) after application of CSNO3 or NH4ClNO3 with and without DCD in June 2010, October 2010 and March 2011. (Kinetics: 0=zero-order, 1=first-order, M=Michaelis–Menten). N transformation abbreviations are explained in the text

Statistical methods
Analyses were carried out using SigmaPlot 12 software (Systat Software Inc., San Jose, CA). The experiment was analysed using analysis of variance as a randomized block experiment with a full factorial design incorporating two factors. Each of the three application times were analysed separately. The factors used were NH4 +-N form (two levels: CS or NH4Cl) and DCD (2 levels: with and without DCD). The ANOVA model was used to ascertain the significance of treatments on gross N transformation rates. A significance level of P<0·05 was used, unless otherwise stated. Estimates of means, standard error of means, standard error of differences in means and Fisher's least significant difference (LSD) were calculated.
RESULTS
Rainfall and soil temperature
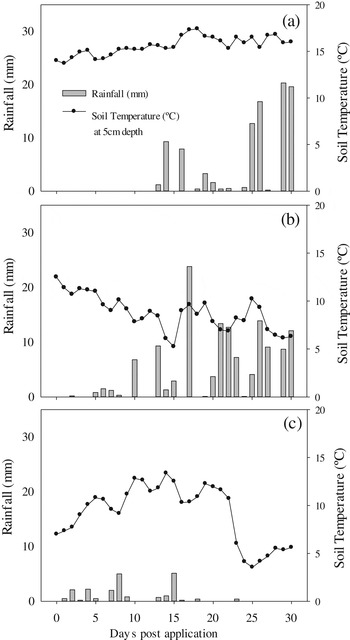
Daily rainfall and soil temperature at 5 cm depth were collected at a weather station located within 1 km of the site. Figure 2 shows the daily data for 30 days post-treatment application for each of the three application times. Over the experimental period in the current study, the average soil temperature at 5 cm depth was 15·6, 8·7 and 9·2 °C in June 2010, October 2010 and March 2011, respectively. Total cumulative rainfall over 30 days was 94·9, 133·2 and 21·1 mm and average soil gravimetric moisture contents (±s.d.) over the sampling periods were 36·1±6·7, 65·8±7·4 and 44·9±5·7% in June 2010, October 2010 and March 2011, respectively. The monthly rainfall measured in June 2010 and October 2010 was higher than the long-term (1995–2010) average conditions, by 30·4 and 34·8%, respectively, and the monthly rainfall measured in March 2011 was 66% lower than the long-term average. The average monthly soil temperature at 5 cm depth measured in June 2010 and October 2010 was similar to the long-term (1995–2010) average conditions; however, in March 2011 the average monthly soil temperature at 5 cm depth was a factor of 1·8 higher than the long-term average.
Rainfall and soil temperature at 5 cm depth for 30 days post-treatment application for: (a) June 2010, (b) October 2010, (c) March 2011.

Composition of applied cattle slurries and rates of dicyandiamide
The NH4 +–N contents of the amended slurries varied considerably over the three application times (Table 1). The rate of NH4 +–N applied varied from 73·9 kg N/ha in March 2011 to 114·7 kg N/ha in June 2010. The same rate of NO3 −-N was applied on each occasion to give a rate of 65 kg N/ha. The DM content ranged from 31·6 to 53·9 g/kg and the pH ranged from 7·14 to 7·52 (Table 1). As DCD was applied at a rate of 15% of the NH4 + content of the amended slurries, the areal rate varied at each application time: 17·2, 10·6 and 11·1 kg DCD/ha was applied in June 2010, October 2010 and March 2011, respectively.
Overview of pool sizes, 15N enrichment and simulation output
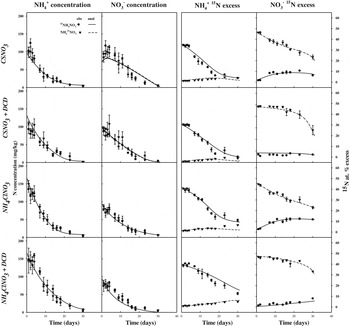
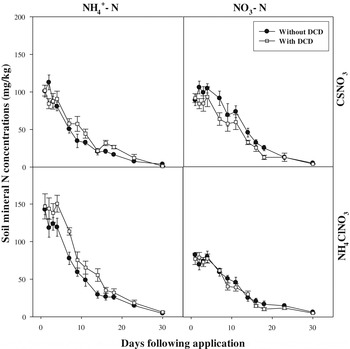
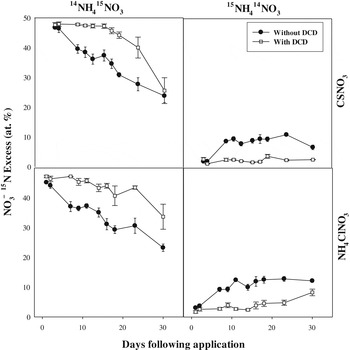
The observed (average±s.e.) and modelled concentrations and 15N enrichments of NH4 + and NO3 − after application of differentially labelled CSNO3 and NH4ClNO3 with and without DCD in June 2010 were plotted (Fig. 3). There was similar agreement between the observed and modelled values at the other application times. The change in net NH4 + and NO3 − concentrations over time in June 2010, October 2010 and March 2011 indicate that N remains as NH4 + for longer when DCD is applied and that slightly less NO3 − is formed. Figure 4 illustrates a typical pattern of mineral N concentrations over time in June 2010. Figure 5 shows that in June 2010 both the rate of dilution of the 15NO3 − excess from the NO3 − labelled pool, and the rate of appearance of 15NO3 − excess from the labelled NH4 + pool were considerably slower in the ‘with DCD’ treatments indicating that DCD caused a marked reduction in the rate of nitrification. The same pattern occurred in October 2010 and March 2011.
Observed (average±s.e.) and modelled concentrations and 15N enrichments of ammonium and nitrate after application of differentially labelled CSNO3 and NH4ClNO3 with and without DCD in June 2010.

Change in soil mineral nitrogen concentrations over time in June 2010 for CSNO3 and NH4ClNO3 with and without DCD.

Change in 15N enrichment of NO3 − pool over time in June 2010 for differentially labelled CSNO3 and NH4ClNO3 with and without DCD.

Effect of cattle slurry on NO3 − and NH4 + dynamics
The effect of addition of CS was examined by comparing the gross N transformation rates for CSNO3 and NH4ClNO3 treatments ‘without DCD’. The addition of a readily available carbon source in the CS did not have a consistent effect between application events on any of the ten quantified gross N transformation rates. For example, CS increased ONH4 in June 2010 and March 2011 (both P<0·001), however, it decreased ONH4 (P<0·001) in October 2010.
Effect of dicyandiamide on NO3 − and NH4 + dynamics
Dicyandiamide significantly decreased the rate of ammonium oxidation (ONH4) (P<0·001) at all application times in both CSNO3 and NH4ClNO3 treatments. For example in June 2010 the application of DCD decreased ONH4 from 1·193 to 0·001 μg N/g/day in CSNO3 and from 0·819 to 0·117 μg N/g/day in NH4ClNO3. In CSNO3 the percentage decreases in ONH4 were 99·9, 81·9 and 90·1% in June 2010, October 2010 and March 2011, respectively, and in NH4ClNO3 the percentage decreases were 85·7, 74·6 and 76·5%, respectively. Ammonium oxidation accounted for most of the total nitrate production (ONH4+ONrec): ONH4 accounted for 89·4–94·9% of total nitrate production in CSNO3 and 90·9–96·5% in NH4ClNO3. Dicyandiamide significantly increased ONrec in June 2010 from 0·064 to 0·275 μg N/g/day in CSNO3 and in October 2010 from 0·157 to 0·635 μg N g/day in NH4ClNO3 but did not have a significant effect at any other time. Overall, DCD significantly decreased total nitrate production (ONH4+ONrec) on all occasions in both CSNO3 and NH4ClNO3 (P<0·001). The percentage decreases in total nitrate production were 78·1, 69·6 and 80·7% in CSNO3 and 83·4, 40·1 and 67·7% in NH4ClNO3 in June 2010, October 2010 and March 2011, respectively.
The total rate of consumption of NO3 − was calculated as the sum of the rate of NO3 − immobilization (INO3) and the rate of dissimilatory NO3 − reduction to NH4 + (DNRA) (DNO3). As this experiment was conducted under field conditions INO3 in this instance also included plant NO3 − uptake, denitrification processes and leaching into deeper soil horizons. These processes are likely to have dominated INO3. DCD lowered INO3 on all occasions and significantly lowered the rate of dissimilatory NO3 reduction to NH4 +, except on the NH4ClNO3 treatment in June 2010. The overall percentage decreases in the total rate of NO3 − consumption by DCD ranged from 16·8 to 27·0% in CSNO3 and from 13·4 to 21·2% in NH4ClNO3. The DNO3 accounted for 0·063–0·124 of the rate of total NO3 − consumption in CSNO3 and 0·061–0·159 in NH4ClNO3 treatments. The rate of DNO3 was lower than many other gross N transformations.
The model estimated both the rates of mineralization from recalcitrant organic-N (MNrec) and from labile organic-N (MNlab). Rates of MNrec were considerably higher than MNlab on all occasions. DCD had an inconsistent effect on both of these transformation rates. It significantly increased ammonium production by mineralization of organic-N (Mtot=MNrec+MNlab) in CSNO3 in June 2010 and March 2011 (P<0·01 and P<0·05, respectively) but significantly decreased Mtot in the NH4ClNO3 treatment in June 2010 (P<0·001). Dicyandiamide had no significant effect at any other time.
The rate of immobilization of NH4 + into labile organic-N (INH4_Nlab) was considerably higher than the rate of immobilization of NH4 + into recalcitrant organic-N (INH4_Nrec) on all occasions; it accounted for 0·878–0·976 of total NH4 + immobilization in CSNO3 and 0·845–0·993 in NH4ClNO3. Dicyandiamide had an inconsistent effect on immobilization of NH4 + to both recalcitrant organic-N (INH4_Nrec) and to labile organic-N (INH4_Nlab): it significantly increased INH4_Nrec in CSNO3 in March 2011 (P<0·01) and in NH4ClNO3 in October 2010 (P<0·01), but had no effect on other occasions. Dicyandiamide significantly increased INH4_Nlab in CSNO3 in June 2010 (P<0·001) but decreased it in March 2011 (P<0·01). It also significantly decreased INH4_Nlab in NH4ClNO3 in March 2011 (P<0·05). Total NH4 + immobilization into the Nlab and Nrec pools was calculated as the sum of INH4_Nlab and INH4_Nrec. Dicyandiamide significantly increased total NH4 + immobilization on two occasions: June 2010 in CSNO3 (P<0·01) and in October 2010 in NH4ClNO3 (P<0·05), however, it did not alter total NH4 + immobilization at any other time.
The rate of adsorption of free NH4 + which is not KCl extractable but irreversibly fixed onto exchange sites (ANH4) was significantly higher when DCD was applied to CSNO3 on all occasions (P<0·001 in June 2010 and March 2011, P<0·01 in October 2010). Dicyandiamide significantly increased ANH4 in NH4ClNO3 in June 2010 (P<0·001) and March 2011 (P<0·001), but a decrease was measured in October 2010 (P<0·05). Dicyandiamide caused a significant increase (P<0·001) in the release of adsorbed NH4 + (RNH4a) in both CSNO3 and NH4ClNO3 in June 2010, however it had no significant effect at other times of the year.
DISCUSSION
The inclusion of the NH4ClNO3 treatment in the current study allowed the effect of CS per se on soil N transformations to be investigated, as it contained the same amount of NH4 +–N as in the CS treatment, but no degradable carbon. However, there was no consistent effect on the addition of a readily available C source on any of the ten quantified gross N transformation processes. A number of researchers have observed a large increase in the rate of nitrification after slurry application (Cooper Reference Cooper1975; Flowers & O'Callaghan Reference Flowers and O'Callaghan1983; Stevens & Laughlin Reference Stevens, Laughlin, Jarvis and Pain1997; Müller et al. Reference Müller, Stevens and Laughlin2003). In the current study, although CS increased ammonium oxidation (ONH4) in June 2010 and March 2011, it decreased ONH4 compared to the NH4ClNO3 treatment in October 2010. There was no evidence that the decomposition of VFAs in the slurry caused a consistent increase in mineralization, in contrast to other studies (Sørensen Reference Sørensen1998).
In the current study, ONH4 was the dominant process in total NO3 − (ONH4+ONrec) production accounting for 0·894–0·949 in the CS treatment. Dicyandiamide was a highly effective nitrification inhibitor on all occasions, reducing total NO3 − production in CS by 69·6–80·7%. There was evidence that the % inhibition in total NO3 − production was less in October 2010, when the soil was very wet due to high rainfall. This supports the findings of Puttanna et al. (Reference Puttanna, Nanje Gowda and Prakasa Rao1999), who showed that the efficacy of DCD was decreased at high soil moisture levels. As DCD strongly inhibited NH4 + oxidation in CS, it also decreased the total rate of NO3 − consumption (INO3+DNO3), as less NO3 − was formed. Dicyandiamide also increased the rate of ammonia adsorption (ANH4) in CS as applied N remained in the NH4 + form for longer.
Dicyandiamide had an inconsistent effect on immobilization into the Nlab and Nrec pools and on mineralization from these pools. Juma & Paul (Reference Juma and Paul1983) found that immobilization of fertilizer N by soil microorganisms was significantly enhanced in the present of a nitrification inhibitor. This was attributed to the nitrification inhibitor keeping the applied N in the NH4 + form for longer and preferential utilization of NH4 + by heterotrophic microorganisms (Norman & Wells Reference Norman and Wells1989). Although in the current study INH4_Nlab in the CS treatment was enhanced by DCD in June 2010, the opposite occurred in March 2011. The INH4_Nrec was stimulated by DCD applied to CS in March 2011, but was not significant at other times. Likewise, the effect of DCD on gross N mineralization rates was inconsistent. The reason for these inconsistent effects is unknown.
It is known that the effectiveness of DCD is strongly related to temperature (Di & Cameron Reference Di and Cameron2004). Kelliher et al. (Reference Kelliher, Clough, Clark, Rys and Sedcole2008) synthesized published data (16 measurements from four controlled environment studies) and applied a first-order kinetic model to a plot of half-life (t½) v. soil temperature over a temperature range of 0–30 °C: a relationship of t ½=168e−0·084T, where T is soil temperature (°C), was quantified. Over the experimental period in the current study (30 days) the average soil temperature at 5 cm depth was 15·6, 8·7 and 9·2 °C in June 2010, October 2010 and March 2011, respectively. Applying the t ½ function of Kelliher et al. (Reference Kelliher, Clough, Clark, Rys and Sedcole2008), a DCD half-life of 45·3, 80·9 and 77·6 days was calculated and the percentage (%) of applied DCD remaining in the soil after 30 days was estimated to be 63·2, 77·3 and 76·5% for the average soil temperatures measured in June 2010, October 2010 and March 2011, respectively. These calculated half-lives do not take into account other processes that could decrease DCD concentrations in soil, for example leaching of DCD through the soil profile and/or sorption of DCD to soil organic matter.
Monaghan et al. (Reference Monaghan, Smith and Ledgard2009) showed that 0·02–0·16 of the DCD applied annually could be lost in drainage water. Shepherd et al. (Reference Shepherd, Wyatt and Welten2012) found in a 12 month lysimeter study using three soil types (clay, silt loam and sandy loam) that the total losses of DCD were linearly related to annual cumulative drainage, with DCD leaching losses ranging from 0·12 to 0·46 of DCD applied, for an annual rainfall range of 422–1292 mm. In the current study, total cumulative rainfall over 30 days ranged from 21·1 mm in March 2011 to 133·2 mm in October 2010. Dicyandiamide was still highly effective at inhibiting ONH4 in October 2010, despite the relatively heavy rainfall during the month.
Singh et al. (Reference Singh, Saggar, Giltrap and Bolan2008) found that with increasing soil organic matter content decomposition rates of DCD also increased, which was thought to be due to DCD sorption on organic matter surfaces. Similarly, Zhang et al. (Reference Zhang, Wu and Zhou2004) found that DCD sorption increased with increasing organic carbon content with the greatest sorption being measured on a peat humus soil. Zhang et al. (Reference Zhang, Wu and Zhou2004) suggested that DCD was sorbed to soil organic matter by hydrogen bonding involving the –NH 2 and ≡NH groups of the nitrification inhibitor. Soil organic matter content at the site used for the current study was 56 g/kg and given the large decreases in the rate of NH4 + oxidation (ONH4), DCD was clearly effective in this relatively high organic matter soil.
The current study provides evidence that DCD is a highly effective nitrification inhibitor under the range of field conditions encountered at this site and offers the potential to reduce NO3 − losses via leaching and gaseous N emissions. Field conditions were slightly wetter in summer and autumn 2010 with near average soil temperatures; in spring (March 2011), field conditions were drier with warmer soil conditions than normal. Given the persistence of DCD during the three applications, the rate of DCD application (15% of NH4 +-N content equivalent to a range of 10·6–17·2 kg DCD/ha) could potentially be reduced without limiting performance: for example, in June 2010, with a soil temperature of 15·6 °C, following Kelliher et al. (Reference Kelliher, Clough, Clark, Rys and Sedcole2008) 0·632 of DCD could potentially have remained in the soil at the end of the 30 day measurement period in the current work, which equates to 10·9 kg DCD/ha remaining.
Fully understanding the key factors that influence the efficacy of DCD in inhibiting nitrification in soil is necessary to provide a sound scientific basis for its optimum use, before widespread adoption of it as a mitigation strategy for decreasing N losses. Recent advances in 15N tracer modelling will allow the rates of plant N uptake to be quantified (Inselsbacher et al. Reference Inselsbacher, Wanek, Strauss, Zechmeister-Boltenstern and Müller2013) in future studies.
This research was funded by the Irish National Development Plan, through the Research Stimulus Fund (RSF 07 519), administered by the Irish Department of Agriculture, Food and the Marine. The authors thank Gareth Ridgway, Briege McCarney, Raymond Stewart, and Michael Nicholson (Agri-Food and Biosciences Institute) for their help with field and laboratory work.