
1. Introduction
The flow of suspensions of deformable objects (bubbles or droplets) is omnipresent in a variety of natural and industrial processes (Mudde Reference Mudde2005; Balachandar & Eaton Reference Balachandar and Eaton2010; Risso Reference Risso2018; Said Reference Said2019; Mathai, Lohse & Sun Reference Mathai, Lohse and Sun2020). The presence of particles dramatically alters the rheological and thereby mixing properties of flows (Alméras et al. Reference Alméras, Risso, Roig, Cazin, Plais and Augier2015; Rosti & Brandt Reference Rosti and Brandt2018; Rosti, Brandt & Mitra Reference Rosti, Brandt and Mitra2018; Almeras et al. Reference Almeras, Mathai, Sun and Lohse2019). A swarm of rising bubbles in an otherwise quiescent fluid, at moderate volume fraction, generates pseudo-turbulence that has been studied by several experiments and numerical simulations over the last three decades (Lance & Bataille Reference Lance and Bataille1991; Mudde Reference Mudde2005; Risso Reference Risso2018; Mathai et al. Reference Mathai, Lohse and Sun2020; Pandey, Ramadugu & Perlekar Reference Pandey, Ramadugu and Perlekar2020).
A more complex but ubiquitous scenario is where large-scale external stirring that generates turbulence is also present along with the bubbles (Deckwer Reference Deckwer1992; Tabib, Roy & Joshi Reference Tabib, Roy and Joshi2008; Mathai et al. Reference Mathai, Lohse and Sun2020). In the absence of bubbles, a nonlinear transfer of energy (maintaining constant energy flux) from forcing to dissipation range characterizes turbulence (Kolmogorov Reference Kolmogorov1941; Frisch Reference Frisch1997; Pope Reference Pope2012). How does the presence of bubbles modify this flow? The answer, in principle, depends on the ratio of the bubble diameter to the dissipation scale, the bubble volume fraction and its density and viscosity contrast with the ambient fluid.
Experiments with large-scale forcing that generates nearly homogeneous and isotropic flows, at large Reynolds number, show that the presence of bubbles dramatically alters the energy spectrum for scales smaller than the bubble diameter (Prakash et al. Reference Prakash, Mercado, van Wijngaarden, Mancilla, Tagawa, Lohse and Sun2016; Almeras et al. Reference Almeras, Mathai, Lohse and Sun2017). Although liquid velocity fluctuations have been well characterized, an understanding of the energy transfer mechanisms remains mostly unexplored.
Direct numerical simulation (DNS) studies of bubbly flows have explored: (a) buoyancy-driven flows that generate pseudo-turbulence or bubble-induced agitation in the absence of external stirring (Bunner & Tryggvason Reference Bunner and Tryggvason2002b,Reference Bunner and Tryggvasona; Roghair et al. Reference Roghair, Mercado, Annaland, Kuipers, Sun and Lohse2011; Pandey et al. Reference Pandey, Ramadugu and Perlekar2020; Ramadugu, Pandey & Perlekar Reference Ramadugu, Pandey and Perlekar2020; Innocenti et al. Reference Innocenti, Jaccod, Popinet and Chibbaro2021), (b) modulation of turbulence by suspension of neutrally buoyant particles (Rosti et al. Reference Rosti, Ge, Jain, Dodd and Brandt2019; Yousefi, Ardekani & Brandt Reference Yousefi, Ardekani and Brandt2020) and (c) Lagrangian investigations of an isolated bubble in the presence of external stirring (Loisy & Naso Reference Loisy and Naso2017). However, to the best of our knowledge, a numerical study designed to unravel the statistical properties of buoyancy-driven bubbly flows in the presence of external stirring is still missing.
Most numerical studies are restricted to low or moderate Galilei numbers because extremely fine grids are required to fully resolve bubbles with high density and viscosity contrasts (e.g. air bubbles in water) (Cano-Lozano et al. Reference Cano-Lozano, Martínez-Bazán, Magnaudet and Tchoufag2016; Innocenti et al. Reference Innocenti, Jaccod, Popinet and Chibbaro2021). Furthermore, the use of second-order finite-difference methods limits the range of Reynolds numbers accessible to these simulations (Canuto et al. Reference Canuto, Hussaini, Quarteroni and Zang2012).
Fortunately, the DNS studies of buoyancy-driven bubbly flow have shown that the statistical properties of pseudo-turbulence such as the probability distribution function (p.d.f.) of velocity fluctuations, the scaling of the energy spectrum and the energy transfer mechanisms are universal and do not depend upon density and viscosity ratios (Pandey et al. Reference Pandey, Ramadugu and Perlekar2020; Ramadugu et al. Reference Ramadugu, Pandey and Perlekar2020; Innocenti et al. Reference Innocenti, Jaccod, Popinet and Chibbaro2021). A key finding of these studies is the presence of energy flux from length scales corresponding to the bubble diameter to small scales. This has also been confirmed in a recent study of bubble-laden turbulent channel flow (Ma et al. Reference Ma, Ott, Fronhlich and Bragg2021). Motivated by these findings, in this article, we investigate turbulence modulation in suspensions of weakly buoyant bubbles. Similar to the experiments, we characterize the flow in terms of the ‘bubblance’ parameter 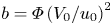 $b=\varPhi \left (V_0/u_0\right )^2$, where
 $\varPhi$ is the bubble volume fraction,
 $V_0$ is the rise velocity of an isolated bubble in a quiescent fluid and
 $u_0$ is the root-mean-square velocity of the turbulent flow in the absence of bubbles. The two extreme limits
 $b=0$ and
 $b=\infty$ correspond to pure fluid turbulence and buoyancy-driven bubbly flow, respectively.
2. Model
We simulate the Navier–Stokes equations with a surface tension force to investigate the suspension of bubbles. Since we are interested in studying the weakly buoyant regime, we invoke the Boussinesq approximation (Chandrasekhar Reference Chandrasekhar1981; Pandey et al. Reference Pandey, Ramadugu and Perlekar2020) to get
 \begin{equation} D_t\boldsymbol{u} = \nu \nabla^2\boldsymbol{u} -\boldsymbol{\nabla} P + \boldsymbol{F}^{\sigma} +\boldsymbol{F}^{g} + \boldsymbol{F}^{s},\quad \textrm{and}\quad \boldsymbol{\nabla} \boldsymbol{\cdot} \boldsymbol{u} = 0. \end{equation}
Here  $\boldsymbol {u}$ is the velocity field,
 $D_t \equiv \partial _t + \boldsymbol {u}\boldsymbol {\cdot }\boldsymbol {\nabla }$ is the material derivative,
 $P$ is the pressure field and
 $\nu$ is the viscosity (assumed to be identical in the two phases). The two phases are distinguished using an indicator function
 $c$ which is equal to
 $1$ in the liquid and
 $0$ inside a bubble (Popinet Reference Popinet2018; Tryggvason et al. Reference Tryggvason, Bunner, Esmaeeli, Juric, Al-Rawahi, Tauber, Han, Nas and Jan2001). The buoyancy force
 $\boldsymbol {F}^{g} \equiv 2 \textit {At} [c - c_{a}] {\boldsymbol {g}}$, where
 $c_{a}$ is the mean value of the indicator function,
 $\textit {At}\equiv (\rho _{f}-\rho _{b})/(\rho _{f}+\rho _{b})$ is the Atwood number,
 ${\boldsymbol {g}}\equiv -g {\hat {\boldsymbol {z}}}$ is the acceleration due to gravity,
 ${\hat {\boldsymbol {z}}}$ is a unit vector along the vertical (positive
 $z$) direction and
 $\rho _{f}$ (
 $\rho _{b}$) is the fluid (bubble) density. The surface tension force is
 $\boldsymbol {F}^\sigma \equiv \sigma \kappa {\hat {\boldsymbol {n}}}$, where
 $\kappa$ is the local curvature of the bubble front whose unit normal is
 ${\hat {\boldsymbol {n}}}$ and
 $\sigma$ is the coefficient of the surface tension. Turbulence is generated using a large-scale stirring force
 $\boldsymbol {F}^{s}$. For a detailed discussion of the Boussinesq approximation, we refer the reader to Appendix A. Experimentally small-
 $\textit {At}$ flows (weakly buoyant regime) can be realized in a mixture of oils (Shukla et al. Reference Shukla, Kofman, Balestra, Zhu and Gallaire2019; Yi, Toschi & Sun Reference Yi, Toschi and Sun2021).
We use a pseudo-spectral method (Canuto et al. Reference Canuto, Hussaini, Quarteroni and Zang2012) for the DNS of (2.1a,b) in a periodic cube with each side of length  $L\equiv 2 {\rm \pi}$. The bubbles are resolved using a front-tracking method. The same method had been earlier employed by us to investigate buoyancy-driven bubbly flows in the absence of turbulent stirring (Pandey et al. Reference Pandey, Ramadugu and Perlekar2020; Ramadugu et al. Reference Ramadugu, Pandey and Perlekar2020). For a detailed discussion of the numerical implementation of the front-tracking method to study a variety of multiphase flows, we refer the reader to Tryggvason et al. (Reference Tryggvason, Bunner, Esmaeeli, Juric, Al-Rawahi, Tauber, Han, Nas and Jan2001) and Popinet (Reference Popinet2018).
For time evolution, we use a second-order exponential time differencing scheme (Cox & Matthews Reference Cox and Matthews2002) for (2.1a,b) and a second-order Runge–Kutta scheme to update the front. A substantial part of the computational effort is spent in resolving the front; DNS with the bubbles is four times slower than that without them. The large-scale stirring force is implemented in Fourier space, i.e.  $\hat {\boldsymbol {F}}^{s} = \varepsilon ^{s} \hat {\boldsymbol {u}}/\sum _{\boldsymbol {k}} |\hat {\boldsymbol {u}}|^2$ with
 $|\boldsymbol {k}|\leqslant k_{inj}$ (Machiels Reference Machiels1997; Petersen & Livescu Reference Petersen and Livescu2010; Perlekar Reference Perlekar2019), where
 $\hat {\boldsymbol {u}}$ is the Fourier transform of
 $\boldsymbol {u}$ and
 $k_{inj}=2$. This implementation ensures a constant rate of energy injection,
 $\varepsilon ^{s}$.
We discretize the simulation domain with  $N^3$ collocation points, set the initial velocity field such that the corresponding energy spectrum
 $E(k,t=0)=\varepsilon ^{s} k^{4}\exp (-4k^2)$ and place
 $N_{b}=80$ non-overlapping spherical bubbles of diameter
 $d=0.46$ at random locations such that no two bubbles overlap.
The dimensionless numbers that characterize the flow are the Taylor-scale Reynolds number  $\textit {Re}_{\lambda } \equiv u_0 \lambda /\nu$, the Galilei number
 $\textit {Ga}\equiv \sqrt {2 \textit {At} g d^{3}/\nu ^2}$, the Bond number
 $\textit {Bo} \equiv {2\textit {At} \rho _a g d^2/\sigma }$, and the bubblance parameter
 $b\equiv \varPhi \left (V_0/u_0\right )^2$, where
 $\varPhi \equiv N_{b} ({\rm \pi} /6) (d/L)^3$ is the volume fraction occupied by the bubbles,
 $V_0 \approx 0.8$ is the rise speed of a single bubble of diameter
 $d$ in quiescent fluid,
 $\lambda \equiv \sqrt {15 \nu u_0^2/\varepsilon ^{s}}$ is the Taylor microscale,
 $u_0 \equiv \sqrt {2E/3}$ is the root-mean-square velocity in the absence of bubbles and
 $E \equiv \left \langle \mid \boldsymbol {u}\mid ^2\right \rangle /2$ is the average kinetic energy. We set the average density
 $\rho _a=1$. The parameters used in our DNS are summarized in table 1. We conduct a grid-resolution study in Appendix B to show that our simulations are well resolved.
Parameters for our DNS runs  ${\texttt {R0}}$–
 ${\texttt {R3}}$. Here,
 $\varepsilon ^{\nu }=\nu \left \langle |\boldsymbol {\nabla } \boldsymbol {u}|^2\right \rangle$ is the viscous dissipation rate,
 $\eta \equiv {(\nu ^3/\varepsilon ^{s})}^{1/4}$ is the Kolmogorov dissipation scale,
 $\lambda$ is the Taylor microscale and the energy injection rates due to large-scale stirring and buoyancy are
 $\varepsilon ^{s} \equiv \left \langle \boldsymbol {u}\boldsymbol {\cdot } \boldsymbol {F}^{s}\right \rangle$ and
 $\varepsilon ^{g} \equiv \left \langle \boldsymbol {u}\boldsymbol {\cdot } \boldsymbol {F}^{g}\right \rangle$, respectively. The angular brackets denote spatio-temporal averaging in the statistically steady state. For all the runs,
 $L=2{\rm \pi}$ and
 $d=0.46$, and the dimensionless numbers
 $Ga= 302$,
 $Bo =1.8$,
 $At = 0.04$ and
 $\varPhi = 1.64\,\%$ are kept fixed. We run simulations
 ${\texttt {R1}}$–
 ${\texttt {R3}}$ at least for a period of
 $\approx 5\tau _{L}$ in the steady state, where
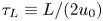 $\tau _{L} \equiv L/(2 u_0)$ is the large eddy turnover time. The simulation
 ${\texttt {R0}}$ runs for a period of
 $10 L/V_0$ in the steady state. The values of
 $\varPhi$,
 $Ga$,
 $Bo$ and
 $Re$ used in our study are comparable to those used in experiments (Prakash et al. Reference Prakash, Mercado, van Wijngaarden, Mancilla, Tagawa, Lohse and Sun2016; Almeras et al. Reference Almeras, Mathai, Lohse and Sun2017).

3. Results
In what follows, we first investigate the statistical properties of bubbles rising in the turbulent flow; we then investigate the statistical properties of the fluid velocity fluctuations. Although we study turbulence modulation in the presence of weakly buoyant bubbles, we show in the subsequent sections that the statistical properties of the flow are in qualitative agreement with experiments that typically have large density and viscosity contrast. Finally, we present the results for the spectral properties of the flow by using a scale-by-scale energy budget analysis.
3.1. Bubble trajectories and rise velocity
For every bubble, we monitor the time evolution of its centre of mass  ${\boldsymbol{X}}_{i}(t)$ after every
 $\delta t=0.08\tau _\eta$ time interval, where
 ${i}$ denotes the bubble index and
 $\tau _\eta = \sqrt {\nu /\varepsilon ^{s}}$ is the Kolmogorov dissipation time scale. From the bubble tracks, we obtain the centre-of-mass velocity
 $\boldsymbol {V}_{i}(t)$ and the acceleration
 ${\boldsymbol {A}}_{i}(t)$ using centred, second-order finite differences.
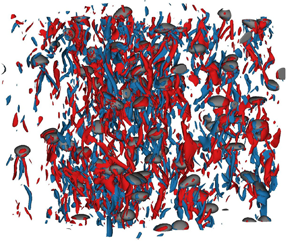
The plots in figures 1(a) and 1(b) show a representative snapshot of bubbles and iso-vorticity surfaces for  $\textit {Re}_{\lambda }=79,b=0.35$ and
 $\textit {Re}_{\lambda }=110,b=0.13$, respectively. In figure 1(c,d) we show a few typical trajectories for the same parameters. It is clear that higher Reynolds number and small ‘bubblance’ parameter correspond to more complex trajectories. To quantify this behaviour, we plot the p.d.f. of the curvature
 ${\mathcal {K}}\equiv {\mid {\boldsymbol {A}} \times {\boldsymbol {V}}\mid /\mid {\boldsymbol {V}}\mid ^3}$ in figure 1(e). Consistent with the observation that the trajectories are more curved for larger
 $\textit {Re}_{\lambda }$, we find that the p.d.f.
 $P({\mathcal {K}})$ is broader – has an exponential tail.
Representative steady-state snapshot of the bubbles and superimposed iso-surfaces of the  $z$ component of the vorticity field
 $\omega _z=\hat {\boldsymbol {z}} \boldsymbol {\cdot } \boldsymbol {\nabla } \times \boldsymbol {u}$ for
 $\omega _z=\pm 3\left \langle \omega _z^2\right \rangle ^{1/2}$ for (a)
 $b=0.35$ and (b)
 $b=0.13$. Typical trajectories of the centre of mass of bubbles in a turbulent flow for (c)
 $\textit {Re}_{\lambda }=79$,
 $b=0.35\ ({\texttt {R1}})$ and (d)
 $\textit {Re}_{\lambda }=110$,
 $b=0.13\ ({\texttt {R3}})$. (e) The p.d.f. of the curvature
 ${\mathcal {K}}$ for different values of
 $b$. (f) Plot showing that the bubble rise velocity increases with increasing
 $b$ or decreasing
 $\textit {Re}_{\lambda }$. We also show that
 $U$ obtained directly from the trajectories and the estimate
 $\varepsilon ^{g}/(2 \textit {At} g \varPhi )$ are in excellent agreement.

Note that Bhatnagar et al. (Reference Bhatnagar, Gupta, Mitra, Perlekar, Wilkinson and Pandit2016) showed that the p.d.f. of curvature of trajectories of heavy inertial particles in homogeneous and isotropic turbulence has a power-law tail with an exponent of  $-5/2$. To the best of our knowledge, no such results exist for bubbles.
Another consequence of large-scale turbulent stirring is that the average bubble rise velocity  $U \equiv (1/N_b) \sum _{{i}=1}^{N_b} \overline {\boldsymbol {V}_{i}(t)\boldsymbol {\cdot } {\hat {\boldsymbol {z}}}}$ (see figure 1f) increases with increasing
 $b$ (decreasing
 $\textit {Re}_{\lambda }$), where
 $\overline {(\boldsymbol {\cdot })}$ represents temporal averaging.
In a recent study, Salibindla et al. (Reference Salibindla, Masuk, Tan and Ni2020) showed that the rise velocity of the bubbles can be enhanced by turbulence provided the velocity ratio  $\gamma \equiv (V_0^2/(\varepsilon ^{s} d)^{2/3})<1$. Our DNS (see table 2) and the experiments that investigate turbulence modulation by bubbles (Lance & Bataille Reference Lance and Bataille1991; Prakash et al. Reference Prakash, Mercado, van Wijngaarden, Mancilla, Tagawa, Lohse and Sun2016) have
 $\gamma \gg 1$.
Velocity ratio  $\gamma$ for our DNS runs
 ${\texttt {R1}}$–
 ${\texttt {R3}}$.

Note that even for  $b=\infty$, the rise velocity of a bubble in a swarm is slightly smaller than the rise velocity of an isolated bubble due to bubble–wake interactions (Riboux, Risso & Legendre Reference Riboux, Risso and Legendre2010). Using the definition of
 $\boldsymbol {F}^{g}$ and noting that
 $\left \langle u_z\right \rangle =0$ in the Boussinesq regime, we obtain
 $\varepsilon ^{g}= 2\textit {At} g \varPhi U$ and verify it in figure 1(f).
3.2. Pair distribution function
To understand the distribution of bubbles in the domain, following Bunner & Tryggvason (Reference Bunner and Tryggvason2002a), we define the pair distribution function:
 \begin{equation} G[r,\cos(\theta)] = \frac{L^3}{N_{b}(N_{b}-1)}\overline{{\sum_{{i}=1}^{N_{b}}\sum_{{j}=1, {j} \ne {i}}^{N_{b}} \delta({\boldsymbol{r}} - {\boldsymbol{X}}_{{ij}},t)}}, \end{equation}
where  $\delta (\boldsymbol {\cdot })$ is the Dirac delta function and
 ${\boldsymbol{X}}_{{ij}}={\boldsymbol{X}}_{i}-{\boldsymbol{X}}_{j}$. In figure 2(a), we sketch a bubble pair configuration to show the coordinate system used for evaluating (3.1). Plots of
 $G[r,\cos (\theta )]$ for
 $r=2d$ and
 $4d$ are shown in figure 2(b). At
 $b=\infty$, we observe a peak in
 $G[r,\cos (\theta )]$ for
 $r \approx 2d$ and
 $\cos (\theta )\approx 0$ indicating a horizontal alignment of bubbles that are separated by a distance
 $2d$. Bubbles separated by distances
 $r\geqslant d$ are uniformly distributed. Our results are consistent with earlier numerical studies of pseudo-turbulence (Bunner & Tryggvason Reference Bunner and Tryggvason2002a; Roghair, Annaland & Kuipers Reference Roghair, Annaland and Kuipers2013). In contrast, as turbulence makes flow more isotropic, for
 $b=0.13$ we find that
 $G[r,\cos (\theta )]$ is uniform which indicates that the bubbles are uniformly distributed for all separations
 $r$.
(a) The separation vector  ${\boldsymbol {r}}= {\boldsymbol {X}}_{i}-{\boldsymbol {X}}_{j}$ and the angle
 $\theta$ between
 ${\boldsymbol {X}}_{ij}$ and
 $\hat {\boldsymbol {z}}$. The bubbles are represented as shaded ellipses. (b) The angular distribution function
 $G[r,\cos (\theta )]$ versus
 $\cos (\theta )$ for
 $r=2d$ and
 $r=4d$ in the absence (
 $b=\infty$) and presence (
 $b=0.13$) of turbulence. The area under the curve is normalized to unity for each
 $G[r,\cos (\theta )]$ curve.

3.3. Average flow around a bubble
In this section, we study the average wake structure of the bubbles for different values of bubblance  $b$. At a given time
 $t$, the velocity field in the centre-of-mass frame of the bubble
 ${i}$ is given by
 \begin{equation} {\boldsymbol{u}}^{CM}_{i}({\boldsymbol{\xi}},t)= \boldsymbol{u}({\boldsymbol{\xi}},t)- {\boldsymbol{V}}_{i}, \end{equation}
where  ${\boldsymbol {\xi }}\equiv {\boldsymbol {x}}-{\boldsymbol{X}}_{i}$ and
 $-L/2 < (\xi _x,\xi _y,\xi _z) \leqslant L/2$. The average flow around a bubble is then obtained by performing temporal averaging over every bubble as follows:
 \begin{equation} {\boldsymbol{u}}^{CM}({\boldsymbol{\xi}}) = \frac{1}{N_{b}}\sum^{N_{b}}_{{i}=1} \overline{{\boldsymbol{u}}^{CM}_{i}({\boldsymbol{\xi}},t)}. \end{equation}
In figure 3(a,b) we plot the velocity streamlines of the average velocity field  ${\boldsymbol {u}}^{CM}({\boldsymbol {\xi }})$ for
 $b=\infty$ (
 ${\texttt {R0}}$) and
 $b=0.13$ (
 ${\texttt {R3}}$). Although the flow structures look qualitatively similar, we find that the bubble in the absence of large-scale stirring is more ellipsoidal. This can be understood by noting that the presence of stirring imposes stronger isotropy on the flow.
Streamline plots of the average velocity field in the frame of the bubble for (a)  $b=\infty$ (run
 ${\texttt {R0}}$) and (b)
 $b=0.13$ (run
 ${\texttt {R3}}$). The streamlines are coloured according to
 $\boldsymbol {u}^{CM}\boldsymbol {\cdot }\hat {\boldsymbol {z}}$.

To quantify the behaviour of the average bubble wake, similar to experiments (Risso et al. Reference Risso, Roig, Amoura, Riboux and Billet2008; Almeras et al. Reference Almeras, Mathai, Lohse and Sun2017) we plot  $v(\xi _z)\equiv \boldsymbol {u}^{CM}(0,0,\xi _z)\boldsymbol {\cdot }\hat {\boldsymbol {z}}$ in figure 4 and find that it decays exponentially as
 $v(\xi _z)\sim C \exp (-A \xi _z/d)$ in the wake region for all values of
 $b$. However, consistent with earlier observations, the presence of stirring leads to a faster decay of the wake. Therefore, for small
 $b$ (or large
 $\textit {Re}_{\lambda }$) we expect (see next section) the velocity fluctuations to be similar to those of homogeneous, isotropic turbulence.
(a) The average bubble wake velocity  $v(\xi _z)$ for runs
 ${\texttt {R0}}$ (
 $b=\infty$),
 ${\texttt {R1}}$ (
 $b=0.35$) and
 ${\texttt {R3}}$ (
 $b=0.13$). (b) Same as (a), but in semi-log scale to highlight the exponential decay of the velocity field in the wake region. The dash-dotted lines show the exponential fits
 $\sim \exp (-A z/d)$ to the data. We find
 $A=0.67$,
 $1.15$ and
 $1.6$ for
 ${\texttt {R0}}$,
 ${\texttt {R1}}$ and
 ${\texttt {R3}}$, respectively.

3.4. Liquid velocity fluctuations
The p.d.f.s of the normalized horizontal and vertical liquid velocity fluctuation with varying  $b$ are shown in figure 5. For
 $b=\infty$, our results agree with those of the earlier studies on pseudo-turbulence (Riboux et al. Reference Riboux, Risso and Legendre2010; Risso Reference Risso2016; Pandey et al. Reference Pandey, Ramadugu and Perlekar2020): the p.d.f. of the horizontal component shows exponential behaviour and the p.d.f. of the vertical component has a Gaussian core and is positively skewed. The presence of external stirring dramatically alters the p.d.f.s as they tend to a Gaussian distribution with decreasing
 $b$ (increasing
 $\textit {Re}_{\lambda }$). Indeed, in the inset of figure 5(a), we verify that
 $\langle u_h^2 \rangle \sim \langle u_z^2 \rangle$ on decreasing
 $b$ confirming that the stirring makes the flow isotropic. This is consistent with earlier experimental observations of turbulent bubbly flows (Prakash et al. Reference Prakash, Mercado, van Wijngaarden, Mancilla, Tagawa, Lohse and Sun2016; Almeras et al. Reference Almeras, Mathai, Lohse and Sun2017).
The p.d.f. of the horizontal (a) and the vertical (b) component of the liquid velocity fluctuations for different values of  $b$ (blue,
 $b=\infty$ (
 ${\texttt {R0}}$); orange,
 $b=0.35$ (
 ${\texttt {R1}}$); green,
 $b=0.21$ (
 ${\texttt {R2}}$); maroon,
 $b=0.13$ (
 ${\texttt {R3}}$); purple,
 $b=0$ (
 $\textit {Re}_{\lambda }=110$)). The black dashed line indicates a Gaussian distribution, and the brown dash-dotted line in (a) shows the exponential distribution. Inset: variance of the horizontal and vertical velocity fluctuations increases with an increase in the stirring intensity
 $1/b$.

3.5. Energy spectrum
Earlier DNS studies (Roghair et al. Reference Roghair, Mercado, Annaland, Kuipers, Sun and Lohse2011; Pandey et al. Reference Pandey, Ramadugu and Perlekar2020; Innocenti et al. Reference Innocenti, Jaccod, Popinet and Chibbaro2021) only investigated the nature of the energy spectrum in the absence of large-scale turbulent forcing. These studies, consistent with experiments, confirm the presence of a  $k^{-3}$ scaling in the spectrum that appears because of the balance of net energy production in the wakes with viscous dissipation.
Experiments have investigated temporal spectra of the Eulerian liquid velocity fluctuations in the presence of a large-scale stirring. They observe a Kolmogorov spectrum for frequencies smaller than the bubble frequency and a pseudo-turbulence scaling for higher frequencies (Lance & Bataille Reference Lance and Bataille1991; Prakash et al. Reference Prakash, Mercado, van Wijngaarden, Mancilla, Tagawa, Lohse and Sun2016; Almeras et al. Reference Almeras, Mathai, Lohse and Sun2017).
Hence we expect that in our simulations we would find a Kolmogorov scaling for wavenumbers  $k< k_{d}$, with a crossover to pseudo-turbulence scaling for
 $k>k_{d}$, where
 $k_{d}\equiv 2{\rm \pi} /d$ is the wavenumber corresponding to the bubble diameter.
In figure 6, we plot the scaled energy spectrum for different values of  $b$ (
 $\textit {Re}_{\lambda }$). As expected, we observe Kolmogorov scaling
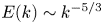 $E(k)\sim k^{-5/3}$ for
 $k< k_{d}$ and a pseudo-turbulence scaling
 $E(k) \sim k^{-3}$ for
 $k>k_{d}$. In figure 7 we plot the compensated spectrum to highlight the region showing
 $-5/3$ and
 $-3$ scaling. Note that none of the scaling ranges are large enough to make possible an accurate determination of the scaling exponent.
Log–log plot of the kinetic energy spectrum  $E(k)$ versus
 $k/k_{d}$ for (a)
 $b=0.35,\textit {Re}_{\lambda }=79$ (
 ${\texttt {R1}}$) and (b)
 $b=0.13,\textit {Re}_{\lambda }=110$ (
 ${\texttt {R3}}$).

Compensated plot of the kinetic energy spectrum highlighting the (a)  $-5/3$ and (b)
 $-3$ scaling ranges. Horizontal dashed line and the shaded region indicate the scaling range.

3.6. Scale-by-scale energy budget and flux
To lay bare the mechanism by which bubbly turbulence emerges we study the scale-by-scale energy budget. Following Pope (Reference Pope2012) we define a low-pass-filtered velocity field coarse-grained at scale  $\ell =2{\rm \pi} /K$ as
 \begin{equation} \boldsymbol{u}^{<}_{K}(\boldsymbol{x}) \equiv \int\exp(\textrm{i}\boldsymbol{q}\boldsymbol{\cdot}\boldsymbol{x}) G_{K}(\boldsymbol{q})\hat{\boldsymbol{u}}(\boldsymbol{q})\,\textrm{d}\boldsymbol{q} ,\quad \textrm{with} \ G_{K}(\boldsymbol{q}) \equiv \exp\left(-\frac{{\rm \pi}^2q^2}{24 K^2}\right) . \end{equation}
Note that Frisch (Reference Frisch1997) and Pandey et al. (Reference Pandey, Ramadugu and Perlekar2020) use a sharp stepdown function as a filter:  $G_{K}(\boldsymbol {q}) = 1$ for
 $\mid \boldsymbol {q}\mid \leqslant K$ and zero otherwise. In contrast, we use a smooth Gaussian filter (Pope Reference Pope2012). In what follows, we use the symbol
 $\left (\boldsymbol {\cdot }\right )^{<}_{ K}$ to denote the filtering operation (Frisch Reference Frisch1997). In real space, this corresponds to
 \begin{align} \boldsymbol{u}^{<}_{K}(\boldsymbol{x}) \!=\! \int G_\ell({\boldsymbol{r}})\boldsymbol{u}(\boldsymbol{x} - {\boldsymbol{r}})\,\textrm{d}{\boldsymbol{r}},\quad \textrm{with}\ G_\ell({\boldsymbol{r}})\!=\! \left(\frac{6}{{\rm \pi}\ell^2}\right)^{1/2}\exp\left(-\frac{6r^2}{\ell^2}\right)\quad \textrm{{and}}\quad \ell \equiv\! 2{\rm \pi}/K. \end{align}
Using the filtered velocity field, we obtain the following scale-by-scale energy budget equation from (2.1a,b):
 \begin{equation} \varPi_K + {\mathscr{F}}^{\sigma}_{K} ={-} {\mathscr{D}}_{K} + {\mathscr{F}}^{g}_{K} + {\mathscr{F}}^{s}_{K}.\end{equation}
Here  ${\mathscr {F}}^{\sigma }_{K} \equiv \left \langle \boldsymbol {u}^{<}_{K} \boldsymbol {\cdot } \left (\mathscr {F}^{\sigma }\right )_{K}^{<}\right \rangle$ is the contribution from surface tension forces,
 ${\mathscr {F}}^{g}_{K} \equiv \left \langle {\boldsymbol {u}^{<}_{K} \boldsymbol {\cdot } \left (\mathscr {F}^{g}\right )_{K}^{<}}\right \rangle$ is the contribution from buoyancy and
 ${\mathscr {F}}^{s}_{K} \equiv \left \langle {\boldsymbol {u}_K^{<}\boldsymbol {\cdot } \left (\mathscr {F}^{s}\right )_K^{<}}\right \rangle$ is the contribution due to large-scale forcing. To obtain the contribution from the nonlinear term and viscous dissipation, following Eyink (Reference Eyink1995), Borue & Orszag (Reference Borue and Orszag1998) and Pope (Reference Pope2012), we define a filtered version of the Reynolds stress tensor
 \begin{equation} \boldsymbol{\mathsf{T}}^{\alpha\beta}_{ K}({\boldsymbol{x}}) \equiv \left(u^{\alpha}u^{\beta}\right)^{<}_{K} - \left(u^{\alpha}\right)^{<}_{K}\left(u^{\beta}\right)^{<}_{K}, \end{equation}
the rate-of-strain tensor
 \begin{equation} \boldsymbol{\mathsf{S}}_{K}^{\alpha\beta}({\boldsymbol{x}}) \equiv \tfrac{1}{2}\left[\left(\partial_{\alpha}u^{\beta}\right)^{<}_{K}+\left(\partial_{\beta}u^{\alpha}\right)^{<}_{K} \right] \end{equation}
and the local nonlinear energy flux
 \begin{equation} {\rm \pi}_{K}({\boldsymbol{x}}) \equiv{-}\boldsymbol{\mathsf{T}}^{\alpha\beta}_{ K}\boldsymbol{\mathsf{S}}_{K}^{\alpha\beta} . \end{equation}
Using (3.4), (3.7), (3.8) and (3.9), we get the net nonlinear flux  $\varPi _{K} \equiv \left \langle {\rm \pi}_{K}\right \rangle$, and the viscous contribution to the budget
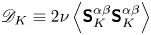 ${\mathscr {D}}_{K} \equiv 2\nu \left \langle {\boldsymbol{\mathsf{S}}_{K}^{\alpha \beta }\boldsymbol{\mathsf{S}}_{K}^{\alpha \beta }}\right \rangle$ which is always positive.
3.6.1. Scale-by-scale energy budget in the absence of bubbles ( $b=0$)

In this case buoyancy makes no contribution to the fluxes and (3.6) simplifies to
 \begin{equation} \varPi_K ={-} {\mathscr{D}}_{K} + {\mathscr{F}}^{s}_{K} . \end{equation}
The plot in figure 8(a) shows the energy budget for  $b=0$ (
 $\textit {Re}_{\lambda }=110$). Since the stirring force is limited to small Fourier modes
 $k\leqslant k_{inj}$,
 ${\mathscr {F}}^{s}_{K}=\varepsilon ^{s}$ is a constant for
 $K>k_{inj}$. The viscous contribution
 ${\mathscr {D}}_{K}$ is significant only for very large
 $K \geqslant k_{\eta }$. Hence, for intermediate values of
 $K$ in the inertial range (
 $k_{inj} < K < k_{\eta }$), the flux
 $\varPi _{K} = {\mathscr {F}}^{s}_{K}$ remains a constant. The four-fifths law of Kolmogorov and the Kolmogorov scaling,
 $E(k) \sim k^{-5/3}$, are a consequence of this constancy of flux (e.g. Frisch Reference Frisch1997, § 6.2). Because of the moderate
 $\textit {Re}_{\lambda }=110$ used by us, the range of wavenumbers over which the flux is constant is very small. A significant range of constant flux is observed in very-high-
 $\textit {Re}_{\lambda }$ and large-resolution DNS (Ishihara, Gotoh & Kaneda Reference Ishihara, Gotoh and Kaneda2009).
Scale-by-scale energy budget: plot of the energy flux  $\varPi _K$, cumulative viscous dissipation
 ${\mathscr {D}}_{K}$, the surface tension contribution
 ${\mathscr {F}}^{\sigma }_{K}$, the cumulative energy injected due to buoyancy
 ${\mathscr {F}}^{g}_{K}$ and the energy injected due to turbulent forcing
 ${\mathscr {F}}^{s}_{K}$ for
 $b=0\ (\textit {Re}_{\lambda } = 110)$ (a),
 $b=\infty$ (b),
 $b=0.35$ (c) and
 $b=0.13$ (d). The black dashed line indicates
 $\log ({K})$ scaling. In (a–d) we normalize the ordinate by the viscous dissipation
 $\varepsilon ^{\nu }$. In (a,c,d) we mark the injection wavenumbers by a shaded region.

3.6.2. Scale-by-scale budget in the absence of stirring ($b=\infty$)

Next, in figure 8(b) we study the other extreme,  $b=\infty$. Stirring makes no contribution here. Energy injection by buoyancy forces happens around the scale of the bubble diameters and the flux due to buoyancy
 ${\mathscr {F}}^{g}_{K}$ becomes almost a constant for
 $K \gg k_{d}$. Hence for
 $K \gg k_{d}$ we obtain
 \begin{equation} \varPi_{K} + {\mathscr{F}}^{\sigma}_{K} ={-} {\mathscr{D}}_{K} + {\mathscr{F}}^{g}_{K} , \end{equation}
with  ${\mathscr {F}}^{g}_{K}$ approximately a constant. By taking a derivative of both sides of (3.11) with respect to
 $K$ at
 $K = k$ we obtain
 \begin{equation} \left.\frac{\textrm{d}(\varPi_{K}+{\mathscr{F}}^{\sigma}_{K})}{\textrm{d}K}\right\rvert_{K=k} = \nu k^2E(k). \end{equation}
Our DNS shows that the net production  $\varPi _{K}+{\mathscr {F}}^{\sigma }_{K} \sim \log (K)$ (Lance & Bataille Reference Lance and Bataille1991; Pandey et al. Reference Pandey, Ramadugu and Perlekar2020). Although taking a derivative can enhance approximation errors, we directly confirm the scaling relation in figure 9. Generalizing the argument of Lance & Bataille (Reference Lance and Bataille1991), if we now assume locality of net transfer then by dimensional analysis
 $\textrm {d}(\varPi _K + {\mathscr {F}}^{\sigma }_{K})/\textrm {d} K\mid _{K=k} \sim k^{-1}$ follows. Substituting in (3.12) we obtain
 $E(k) \sim k^{-3}$ – the spectrum of pseudo-turbulence (Lance & Bataille Reference Lance and Bataille1991; Mercado et al. Reference Mercado, Gomez, Gils, Sun and Lohse2010; Prakash et al. Reference Prakash, Mercado, van Wijngaarden, Mancilla, Tagawa, Lohse and Sun2016; Almeras et al. Reference Almeras, Mathai, Lohse and Sun2017; Bunner & Tryggvason Reference Bunner and Tryggvason2002b; Roghair et al. Reference Roghair, Mercado, Annaland, Kuipers, Sun and Lohse2011; Pandey et al. Reference Pandey, Ramadugu and Perlekar2020; Ramadugu et al. Reference Ramadugu, Pandey and Perlekar2020). Risso (Reference Risso2011) has shown that the same
 $k^{-3}$ spectrum can be obtained, under certain conditions, as a sum of localized random, statistically independent, bursts, which comes from localized velocity disturbances caused by the bubbles.
Log–log plot of  $(K/k_d) |\,\textrm {d}({\mathscr {F}}^{\sigma }_{K} + \varPi _K)/\textrm {d}K|$ versus
 $K/k_d$ for different values of the bubblance parameter
 $b$. Horizontal dashed lines represent
 $K^{-1}$ scaling.

3.6.3. Scale-by-scale budget in the presence of both bubbles and stirring
In figure 8(c,d) we plot the energy budget for the two intermediate cases with  $b=0.35$ and
 $b=0.13$. For
 $K \ll k_{d}$ both the buoyancy force and the surface tension contribute very little to the flux. The viscous contribution is also very small as
 $k_{d} < k_{\eta }$, the dissipation wavenumber. Let us also assume that there is a scale separation between the stirring scale,
 $k_{inj}$ and
 $k_{d}$, with
 $k_{inj} \ll k_{d}$. Then for range of scales
 $k_{inj} < K < k_{d}$ the flux balance gives
 $\varPi _{K} = {\mathscr {F}}^{s}_{K}$, equal to a constant. Consequently we obtain
 $E(k) \sim k^{-5/3}$ for
 $k_{inj} < k < k_{d}$. Next we consider
 $K \gg k_{d}$: the net contribution from both stirring and buoyancy forces
 ${\mathscr {F}}^{s}_{K} + {\mathscr {F}}^{g}_{K}$ is almost a constant, hence we again obtain (3.12). Our DNS shows that for bubblance values of both
 $b=0.35$ and
 $0.13$,
 $\varPi _{K}+{\mathscr {F}}^{\sigma }_{K} \sim \log (K)$ (see figure 9). Although the individual contribution to the energy budget does depend on
 $b$, in particular, for
 $b=0.13$,
 $\varPi _{K}$ is larger than
 ${\mathscr {F}}^{\sigma }_{K}$, but for
 $b=0.35$,
 $\varPi _{K}$ is smaller than
 ${\mathscr {F}}^{\sigma }_{K}$. Hence for both of these cases we obtain
 $E(k) \sim k^{-3}$ for
 $k > k_{d}$ and
 $E(k)\sim k^{-5/3}$ for
 $k< k_{d}$.
In Appendix C, we show that qualitatively similar results are obtained even when using a sharp filter instead of a Gaussian filter.
3.6.4. Spatial distribution of the nonlinear energy flux ${\rm \pi} _{K}(x)$

For homogeneous and isotropic turbulence, for any  $K$ in the inertial range, the net nonlinear flux
 $\varPi _{K}$ is positive, i.e. on average energy flows from small to large
 $K$ or from large to small spatial scales. Kraichnan (Reference Kraichnan1974) and Eyink (Reference Eyink1995) argued that the local nonlinear energy flux
 ${\rm \pi} _{K}$ (3.9) satisfies the refined similarity hypothesis. Using DNS, Chen et al. (Reference Chen, Chen, Eyink and Holm2003) verified this and showed that the scaling exponents of the flux show multiscaling. The multiscale analysis of the flux is also crucial to model subgrid-scale dissipation in large-eddy simulations (Meneveau & Katz Reference Meneveau and Katz2000).
To the best of our knowledge, the spatial distribution of local energy flux in bubbly flows remains unexplored. How does the sign of this flux correlate with the bubbles? For example, is the flux predominantly positive in the wake of a bubble? In the following discussion, we address this question by performing a multiscale analysis of the local nonlinear energy flux  ${\rm \pi} _{K}(\boldsymbol {x})$ with varying filtering scale
 $\ell \sim 1/K$.
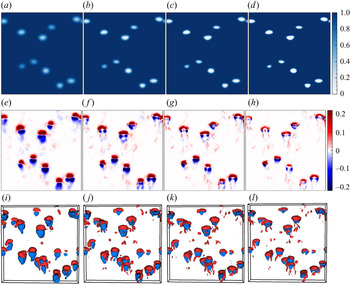
In figure 10, we show a typical snapshot from the run with no external stirring,  $b=\infty$. The position of the bubbles is shown by plotting the indicator function in figure 10(a–d). In figure 10(e–l), we plot the local nonlinear flux
 ${\rm \pi} _{K}$. In each panel, we use four different values for the filtering wavenumber
 $K/k_{d} = 0.6$, 1.0,
 $1.4$ and
 $2.2$, from left to right. Note that we use a Gaussian filter; therefore, a proper distinction between liquid and bubble phase can be made only for
 $K>k_{d}$. We make the following observations:
(i) In the front of the bubble, the energy is primarily transferred downscale, i.e. to scales smaller than
$\ell \sim 1/K$.(ii) Depending on the filtering scale, we observe both upscale and downscale transfer of energy in the wake of the bubble. For large
$K$ (small $\ell$), downscale transfer of energy dominates the wake region, but there are also regions of upscale transfer.(iii) On reducing the filter wavenumber
$K$ (large $\ell$), we observe that the region of upscale transfer is enhanced in the rear region of the bubble. For the smallest filtering wavenumber $K/k_{d}=0.6$, the front–rear region of the bubble has a similar structure but appears with opposite signs.


Buoyancy-driven flow in the absence of stirring ( $b=\infty$,
 ${\texttt {R0}}$). The pseudo-colour plot of the filtered indicator function
 $c$ (a–d) and the local nonlinear flux
 ${\rm \pi} _{K}/\max ({\rm \pi} _{k_{d}})$ (e–h) in the
 $y=L/2$ plane. Constant-
 ${\rm \pi} _{K}$ iso-surfaces for
 $|{\rm \pi} _{K}|=0.03 \max ({\rm \pi} _{k_{d}})$ in a slab
 $L \times 2d \times L$ around the
 $y=L/2$ plane (i–l). The filter wavenumber (scale) is increased (decreased) from left to right:
 $K/k_{d}=0.6$, 1.0,
 $1.4$ and
 $2.2$.

We can understand the fore–aft structure of the energy flux in the vicinity of a bubble in a straightforward manner. Consider a Stokesian spherical bubble with the same viscosity as ambient fluid rising in a quiescent flow; the stream function is given by the Hadamard–Rybczynski solution (Hadamard Reference Hadamard1911; Rybczynski Reference Rybczynski1911; Clift, Grace & Weber Reference Clift, Grace and Weber1978):
 \begin{equation} \varPsi(r,\theta) = \frac{V_0 r^2 \sin^2(\theta)}{2} \begin{cases} -\left(1 - \dfrac{5 d}{8r} + \dfrac{d^3}{32 r^3} \right) & \text{for}\ r\geqslant d/2,\\ \dfrac{1}{4}\left(1 - \dfrac{4 r^2}{d^2} \right) & \text{for}\ r< d/2. \end{cases} \end{equation}
The radial and angular components of the velocity field are  $u_r=\partial _\theta \varPsi /r^2 \sin (\theta )$ and
 $u_\theta =-\partial _r \varPsi /r \sin (\theta )$. Using (3.13), we calculate the nonlinear flux
 ${\rm \pi} _{K}$ and plot it in figure 11 for four different values of the filtering wavenumber
 $K/k_{d} = 0.6$, 1.0, 1.4 and
 $2.2$. There is a downscale energy transfer in the front and an upscale energy transfer at the back side of the bubble. Note that the net energy flux
 $\varPi _{K}$ is zero for the Hadamard–Rybczynski solution. Comparing figure 10 with figure 11, it seems that the spatial distribution of the energy flux comprises a Hadamard–Rybczynski-like solution superimposed with turbulent fluctuations generated in the wake region of a rising bubble. Thus our multiscale analysis of the spatial energy flux provides direct evidence that the net forward energy flux in figure 8(b) is due to the bubble wakes.
The space-dependent nonlinear flux  ${\rm \pi} _{K}/\max ({\rm \pi} _{k_{d}})$ in the
 $y=L/2$ plane for the Hadamard–Rybczynski flow (3.13). The filter wavenumber (scale) is increased (decreased) from left to right:
 $K/k_{d}=$ (a)
 $0.6$, (b) 1.0, (c) 1.4 and (d)
 $2.2$. The green line represents the bubble interface.

The situation is more complex in the presence of stirring, as now both the large-scale forcing as well as the wake of the bubble creates complex spatio-temporal patterns for  ${\rm \pi} _{K}(\boldsymbol {x})$ with regions of downscale and upscale transfer (see figure 12). In figure 13 we plot the p.d.f. of
 ${\rm \pi} _{K}(\boldsymbol {x})$ with
 $K=k_{d}$ for
 $b=0$,
 $b=0.13$ and
 $b=\infty$. For all the cases we observe that the p.d.f. is positively skewed confirming a net positive flux of energy. The skewness of the p.d.f. for
 $b=0$ is nearly
 $1.3$ times larger than that for
 $b=\infty$, indicating the presence of stronger inverse energy transfers in buoyancy-driven bubbly flows in comparison with homogeneous, isotropic turbulence. This is further verified by noting that the skewness for
 $b=0.13$, where both stirring and buoyancy-driven bubbles generate turbulence, is smaller than the case with
 $b=0$.
Buoyancy-driven flow in presence of stirring ( $b=0.13$,
 ${\texttt {R3}}$). The pseudo-colour plot of the filtered indicator function
 $c$ (a–d) and the local nonlinear flux
 ${\rm \pi} _{K}/\max ({\rm \pi} _{k_{d}})$ (e–h) in the
 $y=L/2$ plane. Constant-
 ${\rm \pi} _{K}$ iso-surfaces for
 $|{\rm \pi} _{K}|=0.03 \max ({\rm \pi} _{k_{d}})$ in a slab
 $L\times 2d\times L$ around the
 $y=L/2$ plane (i–l). The filter wavenumber (scale) is increased (decreased) from left to right:
 $K/k_{d}=0.6$, 1.0, 1.4 and
 $2.2$.

The p.d.f. of the scaled nonlinear flux  ${\rm \pi} _{K}/\langle {\rm \pi}_{K}^2\rangle ^{1/2}$ for different values of
 $b$, and with
 $K=k_{d}$.

3.7. Total energy budget
Using (2.1a,b) we obtain the steady-state total energy budget equation as
 \begin{equation} \varepsilon^{g}+\varepsilon^{s}=\varepsilon^{\nu}, \end{equation}
i.e. energy injected by buoyancy and stirring is dissipated by viscosity. Using table 1, (3.14) is easily verified.
In this section, we study the contribution to the total budget from each of the phases. The two phases are characterized by the indicator function  $c$ which takes value
 $1$ in the liquid phase,
 $0$ inside the bubble and an intermediate value at the interface. In a DNS of two-phase flows, usually the interface is diffused over 3–4 grid points. Thus, using
 $c$ to distinguish the phases implies that the interface region contributes to both the phases. In order to avoid this conundrum, we construct a new indicator function
 $c^{\prime }$ such that the interface points are included inside the bubble. To construct
 $c^\prime$ we first initialize it to be the same as
 $c$. The points that lie closest to
 $c^\prime =1/2$ contour are identified as bubble interface points. For points where
 $c^\prime <1/2$,
 $c^\prime$ is set to zero and it is unity outside. Next we set
 $c^\prime =0$ at all points that are within a distance of
 $0.16d$ from the interface points. This completes the procedure of generating an inflated region around each bubble.
Henceforth we use the term bubble to indicate the regions where  $c^{\prime }=0$. Using
 $c^{\prime }$ we define the net injection and dissipation rates in the liquid as
 \begin{gather} \varepsilon^{\nu}_{l} = 2 \nu\left\langle c^{\prime} \boldsymbol{\mathsf{S}} : \boldsymbol{\mathsf{S}} \right\rangle, \end{gather}
 \begin{gather}\varepsilon^{g}_{l} = \left\langle c^{\prime}\boldsymbol{u} \boldsymbol{\cdot} \boldsymbol{F}^{g} \right\rangle, \end{gather}
 \begin{gather}\varepsilon^{s}_{l} =\left\langle c^{\prime}\boldsymbol{u} \boldsymbol{\cdot} \boldsymbol{F}^{s} \right\rangle. \end{gather}
The contribution from the bubble phase can be obtained by subtracting the contribution from the liquid phase from the total. For instance, dissipation rate in the bubble phase is  $\varepsilon ^{\nu }_{b} = \varepsilon ^{\nu } - \varepsilon ^{\nu }_{l}$.
In figure 14(a,b) we show the pseudo-colour plot of the local viscous dissipation  $\varepsilon ^{\nu }_{loc}(\boldsymbol {x})=2 \nu \boldsymbol{\mathsf{S}}:\boldsymbol{\mathsf{S}}$. For the case with no stirring,
 $b=\infty$, the dissipation is strongly concentrated inside and in the wake of the bubbles, whereas when stirring is present,
 $b=0.13$, strong dissipation is also observed in the liquid phase away from the bubbles.
Pseudo-colour plot of the local dissipation  $\varepsilon ^{\nu }_{loc}$ in
 $y=L/2$ plane for (a)
 $b=\infty$ (run
 ${\texttt {R0}}$) and (b)
 $b=0.13$ (run
 ${\texttt {R3}}$). The black line represents the bubble interface (
 $c=0$ contour) and the blue line indicates the contour
 $c'=0$.

In figure 15(a) we look at the balance between energy injection and dissipation in each phase for the case of no stirring,  $b=\infty$. In the liquid phase, viscous dissipation
 $\varepsilon ^{\nu }_{l}$ far exceeds energy injected due to buoyancy
 $\varepsilon ^{g}_{l}$, whereas in the bubble phase the situation is reversed. Note that the overall viscous dissipation inside the bubble phase is larger than the overall dissipation in the liquid phase.
The dissipation and injection rates in the steady state evaluated in the liquid and bubble phases for (a)  $b=\infty$ (run
 ${\texttt {R0}}$) and (b)
 $b=0.13$ (run
 ${\texttt {R3}}$). The ordinate in both panels is normalized by
 $\varepsilon ^{\nu }$.

We can now summarize the flow of energy completely for the case of no stirring,  $b=\infty$. Buoyancy force injects energy at the scale of the bubbles, largely in the gas phase. A large fraction of this energy is dissipated within the bubble itself. The rest of it is transferred to the liquid phase by bubble–liquid interaction. Both the nonlinear flux and the flux due to the surface tension cascade this energy to smaller and smaller scales in the fluid. Energy dissipation happens in both the gas and liquid phases starting from the scale of the bubble down to the smallest scales.
We next plot the injection and dissipation rates obtained for different phases for the case  $b=0.13$ in figure 15(b). Here, we find that dominant energy injection is due to the stirring. This appears largely in the liquid phase. The net energy dissipated in the liquid phase exceeds the energy injected by stirring due to the additional energy transfer from the bubble phase to the liquid phase. In the bubble phase, energy is injected by the buoyancy forces. Most of this energy is dissipated in the bubble phase, but as pointed out above, a part of it is also transferred to the liquid phase.
4. Conclusion
We conduct a DNS study of buoyancy-driven bubbly flow in the presence of large-scale stirring. We investigate the statistical properties of the flow and compare our findings with experiments. Our key results are summarized as follows.
(i) The rise velocity of a bubble in the suspension reduces and the liquid velocity fluctuations are rendered isotropic on increasing the stirring intensity.
(ii) Consistent with experiments (Lance & Bataille Reference Lance and Bataille1991; Prakash et al. Reference Prakash, Mercado, van Wijngaarden, Mancilla, Tagawa, Lohse and Sun2016), we find the energy spectrum shows a Kolmogorov scaling for
$k \ll k_{d}$ and a pseudo-turbulence scaling – $E(k) \sim k^{-3}$ – for $k \gg k_{d}$.(iii) We rationalize the scaling observed in the energy spectrum by using a scale-by-scale energy budget analysis. For
$k\ll k_{d}$, energy flux is the dominant energy transfer mechanism although viscous dissipation is effective for all scales $k < k_{d}$. The balance of net production with viscous dissipation leads to the pseudo-turbulence scaling for $k\gg k_{d}$.


We want to emphasize that although we study turbulence modulation by weakly buoyant bubbles, the statistical properties of the flow are in qualitative agreement with experiments (Lance & Bataille Reference Lance and Bataille1991; Prakash et al. Reference Prakash, Mercado, van Wijngaarden, Mancilla, Tagawa, Lohse and Sun2016; Salibindla et al. Reference Salibindla, Masuk, Tan and Ni2020). Therefore, we believe that the energy transfer mechanisms discussed in our study should also apply to the experimental scenario of high density and viscosity contrast; our previous study (Pandey et al. Reference Pandey, Ramadugu and Perlekar2020) already verified this in the absence of stirring.
However, we expect that the details of the wake structure in the vicinity of the bubble would depend on the density and viscosity contrast. How relevant this is for the energy transfer mechanism that we have proposed remains to be investigated. We hope that our results will motivate further investigations in this direction.
Funding
D.M. acknowledges the support of the Swedish Research Council (grant nos. 638-2013-9243 and 2016-05225). P.P. and V.P. acknowledge support from the Department of Atomic Energy (DAE), India under project identification no. RTI 4007, and DST (India) project nos. ECR/2018/001135 and DST/NSM/R&D_HPC_Applications/2021/29.
Declaration of interests
The authors report no conflict of interest.
Author contributions
V.P. performed the simulations. All authors contributed equally to analysing data and reaching conclusions, and in writing the paper.
Appendix A. Boussinesq-approximated Navier–Stokes equations
In this appendix we derive the Boussinesq approximate equations (2.1a,b) starting from the following multiphase Navier–Stokes equations (Pandey et al. Reference Pandey, Ramadugu and Perlekar2020):
 \begin{equation} \rho(c) D_t \boldsymbol{u} = \boldsymbol{\nabla} \boldsymbol{\cdot} (\mu(c) \boldsymbol{\mathsf{S}}) + {\boldsymbol{f}}^{\sigma} + {\boldsymbol{f}}, \end{equation}
where the density field
 \begin{equation} \rho(c)=\rho_{f} c + \rho_{b} (1-c), \end{equation}
the dynamic viscosity field  $\mu (c)=\mu _{f} c + \mu _{b} (1-c)$,
 $\rho _{f}$ (
 $\mu _{f}$) is the density (viscosity) of fluid phase,
 $\rho _{b}$ (
 $\mu _{b}$) is the density (viscosity) of the bubble phase,
 ${\boldsymbol {f}}^{\sigma }$ is the surface tension force, the external force
 ${\boldsymbol {f}} \equiv [\rho (c) {\boldsymbol {a}}- \overline {\rho (c) {\boldsymbol {a}}}]$,
 ${\boldsymbol {a}}$ is the acceleration and in this appendix
 $\overline {(\cdot )}$ denotes spatial averaging. Note that as we work with periodic boundaries, our choice of external force ensures that no net momentum is added to the flow.
We assume small density contrast ( $\textit {At}\ll 1$) and identical dynamical viscosity of the two phases (
 $\mu _{f}/\mu _{b}=1$). Thus we invoke the Boussinesq approximation, whereby
 $\rho (c)$ on the left-hand side of (A1) is replaced by the average density:
 \begin{equation} \rho_{a}\equiv \overline{\rho(c)} = (\rho_{f}-\rho_{b}) c_a + \rho_{b} \approx (\rho_{f} + \rho_{b})/2. \end{equation}
The above assumptions drastically simplify (A1) to give
 \begin{equation} D_t \boldsymbol{u} = \nu \nabla^2\boldsymbol{u} + \boldsymbol{F}^{\sigma} + {\boldsymbol{F}}, \end{equation}
where  $\boldsymbol {F}^{\sigma }={\boldsymbol {f}}^{\sigma }/\rho _{a}$ and
 ${\boldsymbol {F}}={\boldsymbol {f}}/\rho _{a}$. The above equation is identical to the Boussinesq equation (2.1a,b) that we use. Next we derive the buoyancy and the turbulent stirring force in the Boussinesq regime.
Using the definitions (A2) and (A3) in  ${\boldsymbol {F}}$, we get
 \begin{equation} {\boldsymbol{F}} = \left[ 1 - \frac{(\rho_{f}-\rho_{b})c_{a}}{\rho_{a}} \right] ({\boldsymbol{a}} - \bar{\boldsymbol{a}}) + \frac{(\rho_{f}-\rho_{b})}{\rho_{a}} (c {\boldsymbol{a}} - \overline{c{\boldsymbol{a}}}). \end{equation}
When  ${\boldsymbol {a}}={\boldsymbol {g}}$, the first term on the right-hand side of (A5) is zero and we obtain the buoyancy force
 \begin{equation} {\boldsymbol{F}}^g = \frac{(\rho_{f}-\rho_{b})}{\rho_{a}} (c - c_{a}) {\boldsymbol{g}} \approx 2 \textit{At} (c-c_{a}) {\boldsymbol{g}}. \end{equation}
On the other hand for turbulence stirring, we use an acceleration field with  $\bar {{\boldsymbol {a}}} =0$. Therefore, (A5) simplifies to
 \begin{equation} \boldsymbol{F}^{s} = \left[ 1 - \frac{(\rho_{f}-\rho_{b})c_{a}}{\rho_{a}} \right] {\boldsymbol{a}} + \frac{(\rho_{f}-\rho_{b})}{\rho_{a}} (c {\boldsymbol{a}} - \overline{c {\boldsymbol{a}} }). \end{equation}
In the Boussinesq regime,  $(\rho _{f}-\rho _{b})/\rho _{a} \ll 1$ and we get
 $\boldsymbol {F}^{s}={\boldsymbol {a}}$ to leading order, i.e. the stirring force is applied irrespective of the phase or the indicator function. In the main text we choose
 $\rho _{a}=1$ everywhere.
Appendix B. Resolution test
To study grid convergence, we conduct DNS of turbulent bubbly flows for our runs  ${\texttt {R1}}$ and
 ${\texttt {R3}}$ with increasing grid resolution
 $N=360$,
 $512$ and
 $720$. The plot of the energy spectrum (figure 16) clearly shows that even with
 $N=360$, the inertial range as well as the
 $k^{-3}$ scaling of pseudo-turbulence are well captured. However, as expected, on increasing the grid resolution, the range of
 $k^{-3}$ scaling obtained due the balance of net production with viscous dissipation extends. The departure from the
 $k^{-3}$ scaling around
 $k\approx k_{max}$ is an artifact of finite resolution.
The kinetic energy spectra for  $\texttt {R1}$ (a) and
 ${\texttt {R3}}$ (b) at resolutions
 $N=360$,
 $512$ and
 $720$.

Appendix C. Energy budget using sharp filter
We now present the result of the scale-by-scale energy budget analysis obtained using a sharp low-pass filter instead of the Gaussian filter. The low-pass-filtered velocity field for a sharp filter is defined as (Frisch Reference Frisch1997; Verma Reference Verma2019; Pandey et al. Reference Pandey, Ramadugu and Perlekar2020)
 \begin{equation} \boldsymbol{u}^{<}_{K}(\boldsymbol{x}) = \sum_{q \leqslant K} {\boldsymbol{u}}_{\boldsymbol{q}}\exp(\textrm{i}{\boldsymbol{q}}\boldsymbol{\cdot}{\boldsymbol{x}}). \end{equation}
In figure 17(a) we show the scale-by-scale budget obtained for the case  $b=\infty$ and in figure 17(b) we plot the budget for
 $b=0.13$. By comparing with figure 8, it is clear that the choice of filtering does not qualitatively change the scale-by-scale energy budget. Our observations are consistent with the recent finding of Alexakis & Chibbaro (Reference Alexakis and Chibbaro2020) who did a similar comparison for homogeneous, isotropic turbulence.
Scale-by-scale energy budget: plot of the energy flux  $\varPi _{K}$, cumulative viscous dissipation
 ${\mathscr {D}}_{K}$, the surface tension contribution
 ${\mathscr {F}}^{\sigma }_{K}$, the cumulative energy injected due to buoyancy
 ${\mathscr {F}}^{g}_{K}$ and the energy injected due to turbulent forcing
 ${\mathscr {F}}^{s}_{K}$ for (a)
 $b=\infty$ and (b)
 $b=0.13$. In both the panels we normalize the ordinate by the viscous dissipation
 $\varepsilon ^{\nu }$.