INTRODUCTION
Trichomonas vaginalis is the causative agent of trichomoniasis, one of the most prevalent sexually transmitted diseases in humans. Trichomoniasis, caused by T. vaginalis, is the primary nonviral sexually transmitted infection associated with adverse consequences for women's health (World Health Organization, 2001). Infected women experience fetid discharge, abdominal pain, irritation and severe discomfort. Complications from trichomoniasis are associated with an enhanced risk of HIV transmission (Sorvillo et al. Reference Sorvillo, Smith, Kerndt and Ash2001). The infection varies from a mild vaginitis or cervicitis to endometritis, transient or permanent infertility and abortion, causing significant economic losses and decline in health. Although T. vaginalis is the most intensely studied trichomonad and is the world's most common cause of nonviral STDs, the exact mechanisms of its pathogenesis have not been clearly elucidated. Several in vitro studies have reported that adhesion of T. vaginalis to the target cell is essential for the maintenance of infection and cytopathogenicity (Alderete and Pearlman, Reference Alderete and Pearlman1984; Alderete et al. Reference Alderete, Lehker and Arroyo1995; González-Robles et al. Reference González-Robles, Lazaro-Haller, Anaya-Velazquez and Martinez-Palomo1995). Contact-independent cytolytic mechanisms have also been demonstrated and attributed to substances secreted by the parasite in the culture medium (Arroyo and Alderete, Reference Arroyo and Alderete1989; Fiori et al. Reference Fiori, Rappelli, Addis, Sechi and Cappuccinelli1996; Kummer et al. Reference Kummer, Hayes, Gilbert, Beach, Lucas and Singh2008). Some authors have also indicated that cytophagocytosis may constitute another pathogenic mechanism displayed by T. vaginalis (Honigberg, Reference Honigberg and Honigberg1990; Alderete et al. Reference Alderete, Lehker and Arroyo1995; Mirhagani and Warton, Reference Mirhagani and Warton1996). Other authors have suggested that T. vaginalis adheres to host cells and damages them through a contact-dependent process, displaying a host-parasite specific cytotoxic mechanism (Gilbert et al. Reference Gilbert, Elia, Beach, Klaessig and Singh2000). Also, T. vaginalis has been reported to contribute to pathogenesis when soluble cytotoxins, which play a role in virulence and adherence, are released onto the host mucosal surface (Mendoza-Lopez et al. Reference Mendoza-Lopes, Becerril-Garcia, Fattel-Facenda, Ávila-Gonzales, Rutz-Tachiquin, Ortega-Lopes and Arroyo2000; Crouch and Alderete, Reference Crouch and Alderete1999). However, almost all previous studies have concentrated on the adhesion phase, whereas the precise consequences of the parasite on host cells remain largely unexamined (González-Robles, Reference González-Robles, Lazaro-Haller, Anaya-Velazquez and Martinez-Palomo1995; Heath, Reference Heath1981; Kummer et al. Reference Kummer, Hayes, Gilbert, Beach, Lucas and Singh2008).
In the present work, a fresh primary culture of bovine oviduct epithelial cells (BOECs) was co-incubated with trichomonads displaying different virulence levels. The behaviour of both cell types during the entire interaction process was analysed. As previous studies on host-trichomonad interactions did not produce a conclusive description of the parasite's cytolytic activity, we decided to use an experimental system presenting the following advantages: (1) monolayers as well as floating cells of a primary mammalian cell culture of epithelial origin were used instead of an established cell line; (2) direct and detailed observations were made using videomicroscopy, SEM and TEM; and (3) quantitative analyses of cytotoxic effects on target cells by trichomonads allowed us to correlate morphological modifications during the interaction between T. vaginalis with target cells.
MATERIALS AND METHODS
Microorganisms
The JT strain of Trichomonas vaginalis was isolated at the Hospital Universitário, Universidade Federal do Rio de Janeiro, Brazil and has been maintained in culture since the 1980s. The FMV1 strain is a fresh isolate kindly provided by Dr J. Baptista (Instituto Oswaldo Cruz, Rio de Janeiro, Brazil), and the fresh isolate T068 was kindly provided by John F. Alderete (University of Texas Health Science Center, San Antonio, Texas, USA). Concerning the strains T068 and JT, they were obtained from female patients presenting symptomatic trichomoniasis, whereas the FMV1 strain was isolated from an asymptomatic patient. Based on the ability to destroy cells in culture, JT was previously classified as a low cytotoxic strain whereas FMV1 and T068 were defined as cytotoxic strains (Jesus et al. Reference Jesus, Vannier-Santos, Britto, Godefroy, Silva-Filho, Pinheiro, Rocha-Azevedo, Lope and Meyer-Fernandes2004; Vancini and Benchimol, Reference Vancini and Benchimol2008). Parasites were cultivated in trypticase – yeast extract – maltose (TYM) medium (Diamond, Reference Diamond1957) supplemented with 10% foetal calf serum. The cells were grown for 36–48 h at 37°C, which corresponds to the logarithmic growth phase.
Culture of bovine oviduct epithelial cells (BOECs)
Bovine oviducts were collected at a slaughterhouse, immersed in sterile phosphate balanced salt solution (PBS) containing 0·05 g/L gentamicin sulfate and transported to the laboratory within 2 h. The isthmus and ampulla of the oviducts were used as sources of epithelial cells. The luminal region of the organ was flushed with cold PBS and the epithelium was gently pressed with forceps and washed again in order to isolate cells, which were obtained after several washes, transferred to 199 culture medium (M-5017, Sigma) in 25 cm2 bottles and incubated at 37°C, under 5% CO2 in air. Epithelium was allowed to grow for 1–2 weeks. Fibroblasts and epithelial cells were separated by differential trypsinization as previously described (Gilbert et al. Reference Gilbert, Elia, Beach, Klaessig and Singh2000). The purity of epithelial cells was determined with an anti-multicytokeratin mAb (FK-Biotec, RS, Brazil). Contamination of fibroblasts was controlled by staining with a mAb against human fibroblasts (Dako).
Co-incubation and attachment assay
For interaction analyses, either the confluent cultures or non-adherent, floating BOECs were exposed to T. vaginalis at a cell ratio of 5:1 parasites:BOECs, for periods ranging from 1 min to 48 h at 37°C. The cells were equilibrated in incubation medium containing 2 parts complete DMEM (pH 7·2) and 1 part Diamond's medium (W/D 2:1) for 15 min at 37°C (5% CO2) prior to the addition of parasites. Adhesion was confirmed by thorough washing of the cultured monolayers after exposure to parasites. In control experiments, parasites were omitted. The interaction process was followed from the first minute of interaction by videomicroscopy and phase-contrast microscopy using a Zeiss Axiophot II (Germany). Images were acquired using a chilled C5985-10 CCD camera (Hamamatsu, Japan).
Scanning electron microscopy (SEM)
After parasite-cell interaction occurred, the cultures were fixed in 2·5% glutaraldehyde in 0·1 m sodium cacodylate buffer, pH 7·2, post-fixed for 15 min in 1% OsO4, dehydrated in ethanol, critical point-dried with CO2 and sputter-coated with gold-palladium. The samples were examined with a JEOL 5800 scanning electron microscope.
Transmission electron microscopy (TEM)
Cells were fixed in 2·5% (v/v) glutaraldehyde, post-fixed for 15 min in 1% OsO4, dehydrated in acetone and embedded in Epon. Ultra-thin sections were observed with a JEOL 1210 transmission electron microscope.
Cell floating assays
Both floating cells obtained from BOEC primary culture after trypsinization and cells obtained just after removal from oviducts, when clumps of cells are not adhesive, were used in the experiments. The epithelial cells were suspended in DMEM, washed once and adjusted to 2×10⁵ cells/ml. The cells were maintained in suspension by light shaking and co-incubated with the parasites at a cell ratio of 5:1 parasites:host cells.
Cytotoxicity assays
For cytotoxicity analysis, the BOECs were grown until confluency, about 2×10⁵ cells, on 24-well plates and exposed to different T. vaginalis isolates at a cell ratio of 5:1 parasites:BOEC. The cells were analysed from the first minute of exposure to 1, 3, 17, 24, or 48 h after at 37°C. The target cells were equilibrated in incubation medium containing 2 parts of complete DMEM (pH 7·2) and 1 part of Diamond's medium (W/D 2:1) for 15 min at 37°C (5% CO2) prior to the addition of parasites. In control experiments, parasites were omitted. At the end of the incubation period, the wells were gently washed 3 times with warm PBS and the remaining cells still adhering to the well bottoms were fixed with 2% (w/v) freshly prepared formaldehyde in phosphate buffer for 15 min at room temperature. The wells were washed with PBS and stained with 0·13% crystal violet dissolved in a 5:2 (v/v) ethanol-formaldehyde solution. The stained cells were subsequently washed twice with distilled water, air dried and solubilized in 1% (w/v) SDS in 50% (v/v) ethanol. The staining intensity was determined in a spectrophotometer at a wavelength of 570 nm. Each experiment was performed in triplicate and the mean of the data is presented. Cytotoxicity was calculated as 1 – (E/C); i.e. all measurements of experimental (E) samples (A 570) were indexed to those of control (C) samples (E/C), which showed no loss of cells from the well, and subtracted from 1·0 (Alderete and Pearlman, Reference Alderete and Pearlman1984).
Cytochalasin D treatment
Before the interaction assays, T. vaginalis was incubated in 60 μm cytochalasin D (CytD) (Sigma, USA) diluted in dimethyl sulfoxide (DMSO) for 2 h at 37°C. Controls were performed using cultures with no added drugs and/or with only 0·5% DMSO, the same maximum concentration found in the solutions containing the drug.
Cytochemistry: acid phosphatase
Acid phosphatase cytochemistry was carried out with a modified Robinson and Karnovsky method (Reference Robinson and Karnovsky1983), using sodium β-glycerophosphate as substrate as previously described (Affonso et al. Reference Affonso, Benchimol, Ribeiro, Lins and De Souza1994).
Ruthenium Red (RR)
Cells were fixed in 2·5% (v/v) glutaraldehyde in 0·1% cacodylate buffer plus 7% sucrose containing 5 mg/ml of RR (British Drug Houses, Ltd) for 2 h, washed in buffer and post-fixed with 1% OsO4 in cacodylate buffer containing 5 mg/ml of RR for 2 h in the dark (Luft, Reference Luft1971).
RESULTS
We developed a primary culture of BOECs in order to study the cytopathic effects of T. vaginalis in a model closer to in vivo cells rather than transformed cells. Parasites of low virulence (JT strain) and high virulence (T068 and FMV1) were used in interaction assays. Samples were analysed by videomicroscopy, SEM and TEM (Figs 1–10).
Isolated oviduct cells
A primary monolayer cell culture of BOECs was established and used in the experiments. Cell suspensions obtained after the first mechanical cell isolation were also used and are here referred to as floating cells. These floating cells were easily identified since they formed clumps of ciliated and non-ciliated cells presenting intense movement. These living cells were identified, isolated and used in interaction assays before seeding in order to check if the parasites have a special preference when adhering to the host cells. In addition, in the early literature it has been demonstrated that trichomonads were frequently seen as free cell suspensions, in in vivo experiments.
Establishment of bovine oviduct epithelial cell culture
After the monolayers formed (Fig. 1c) between day 5 and day 15 after isolation from the bovine oviduct, successive trypsinizations were carried out in order to transfer the cultures to be used for the interaction experiments.
General view of Trichomonas vaginalis by SEM (a) and TEM (b) before interaction with a confluent primary culture of bovine oviduct monolayer (c). Ax, axostyle, AF, anterior flagella, G, Golgi complex, N, nucleus, RF, recurrent flagellum. Scale bars, (a–b), 1 μm; (c), 5 μm.

Interaction assays
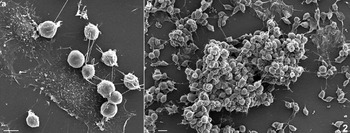
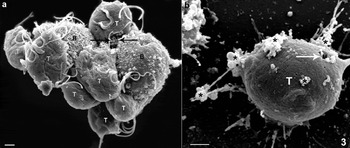
Co-incubation experiments of trichomonads in combination with oviduct cells, either in primary monolayer culture or cell suspension, were followed by videomicroscopy, SEM (Figs 2a–b, 3 and 4) and TEM (Figs 6–10). T. vaginalis were shown to be firmly adhered to BOECs but presented externalized flagella with the recurrent flagellum on the up-side (Figs 2a–b). The adherence was tight as successive washes did not detach the parasites. After a few hours of interaction, most trophozoites of the fresh isolates (FMV1 and JT) were clustered around the BOECs (Fig. 2b), in close contact with either the monolayer or with the floating host-cells (Fig. 3). However, parasites of the less virulent strain (JT) exhibited few clusters and less host cell damage (Figs 2a and 11). T. vaginalis was seen to act either as a single cell (Figs 2a and 4) or, more frequently, by making contact with other parasites to form a multicellular barrier against the target cell (Figs 2b and 3a).
SEM observation of a primary culture after interaction with Trichomonas vaginalis strains of different virulence levels: (a) a long-term cultured JT strain and (b) the fresh isolate FMV1. The incubation time was 8 h. Note the differences in pathogenicity between the two strains, since the primary culture is still apparent and few trichomonads are clustered in the JT strain interaction. Trichomonas maintain their tear drop shape and exhibit free flagella. In (b) the cells are clustered to form large aggregates and the host cell is no longer visible under the parasite attack. Scale bars, (a), 5 μm; (b) 10 μm.

SEM of interaction of Trichomonas vaginalis strain FMV1 (T) with bovine floating cells (B) for 2 h (a) and 18 h (b). The host cells became rounded and presented regression and even absence of microvilli. Note in (a) that several trichomonads attacked two BOECs at the same time. Arrows point to places where it is possible to note trichomonads in the process of phagocytosing cell fragments (asterisks). Scale bars, 1 μm.

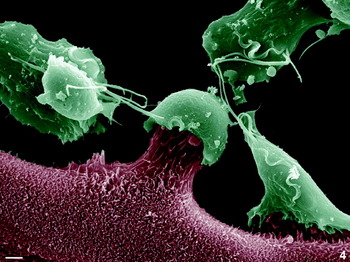
SEM of a 1-h interaction between the virulent FMV1 strain with confluent monolayer of bovine oviduct epithelial cells. Note that the epithelial cells are being pulled up by Trichomonas vaginalis. Scale bar, 2 μm.
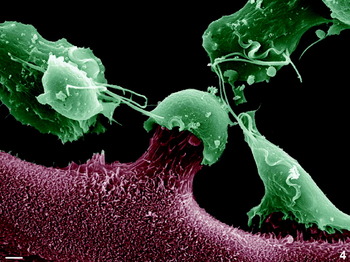
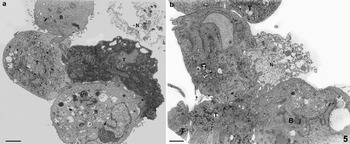
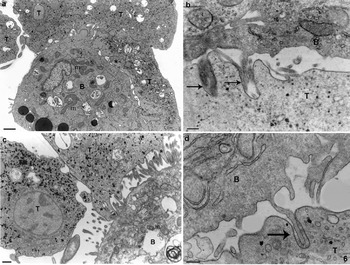
Just a few minutes after the addition of the trophozoites to the culture, a hit-and-run effect was observed. The parasite first attached to the target cell and then displaced the host cell by pulling it up (Fig. 4). Release of the BOECs from the cell monolayers was observed after co-incubation with T. vaginalis and was monitored microscopically using phase-contrast light microscopy and videomicroscopy (not shown). After adhesion, T. vaginalis formed a tight contact with BOECs through filopodia and digitopodia (Figs 5a–b and 6a). In addition, an electron-lucent cortical layer, already described as containing actin filaments, was seen in the contact area between host and parasite cells (Figs 5a–b and 6a).
TEM of Trichomonas vaginalis (T), strain FMV1, after a 6-h interaction with floating BOECs (B). Note the membrane specialization in the adhesion region of T. vaginalis, which resembles a cortical layer of actin (asterisks). Filopodia and digitopodia are numerous, providing a tight adhesion among the cells. The parasites are clustered around the host cell (B) and all flagella are free. It is important to note that one trichomonad in (a) presented a higher electron density when compared with the other parasites. Scale bars, 1 μm.

TEM of interaction between BOECs (B) and Trichomonas vaginalis (T). (a) T. vaginalis strain FMV1 after interaction with floating BOECs for 3 h. Note that a BOEC is surrounded by several T. vaginalis that are tightly adhered. Both types of cells presented a healthy aspect, with the BOEC showing several normal mitochondria (m) and other cell organelles. One important observation is marked with an asterisk, where a microvillus of the epithelial cell is being pulled up by one of the trichomonad cells. Scale bar, 1 μm. (b) High magnification of a 3-h interaction between T. vaginalis, strain T068, and BOECs. Arrows point to an early endocytic event in which microvilli from the BOEC were being incorporated into a T. vaginalis. Scale bar, 300 nm. (c) T. vaginalis interaction with a monolayer of BOECs. Note that a BOEC is surrounded by more than one T. vaginalis, which are tightly adhered. The BOEC does not present a healthy aspect, showing intense vacuolization and a damaged mitochondria (m). One important observation is marked by an asterisk, where it is possible to see that some microvilli of the epithelial cell are being pulled up by one of the trichomonad cells. Scale bar, 600 nm. (d) Detail of an area of contact between T. vaginalis and a BOEC. Note that one microvillus of the epithelial cell is in the process of being pulled up by one of the trichomonad cells (arrow). Scale bar, 300 nm.

Trichomonads were seen clustered together in large cell aggregates that could adhere to the host cells (Figs 2b, 3a and 5a–b). By TEM it was possible to note that some trichomonads presented a high electron density (Fig. 5a).
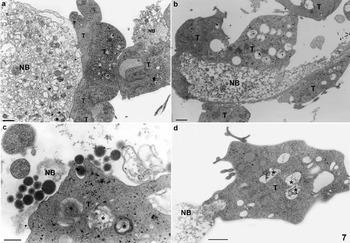
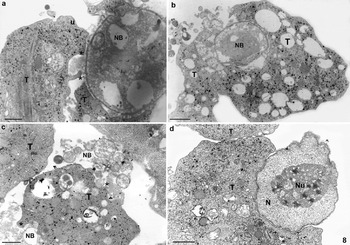
During the interaction of the trichomonads with the monolayers, the first morphological modifications observed in the target cells were microvilli distortion and gradual monolayer displacement and collapse. The cells became detached and were attacked by many trichomonads (Figs 2b, 6b–d and 7b–d). The same occurred with the floating cells (Figs 3a, 5a–b, 6a and 7a). Within 2 h of interaction the majority of host cells were still viable and presented a healthy appearance, but after this time, signs of cell death were detected, including intense vacuolization, plasma membrane rupture and cell viability loss (Fig. 7). The extrusion of particulate cytoplasmic components of the host cells was observed by TEM and SEM (Figs 3a and 7c) as clear signs of target cell necrosis (Figs 5a–b and 7–8).
TEM of a 20-h interaction between BOECs (B) and Trichomonas vaginalis T068 (T). Interaction of T. vaginalis with floating BOECs (a) or BOECs in a monolayer (b–d). Necrotic BOECs (NB) are observed in both situations and several trichomonads are seen in the process of adherence and ingestion of cell debris. Note that in the trichomonad vacuoles (asterisks), cell debris can also be seen. Scale bars, 1 μm.

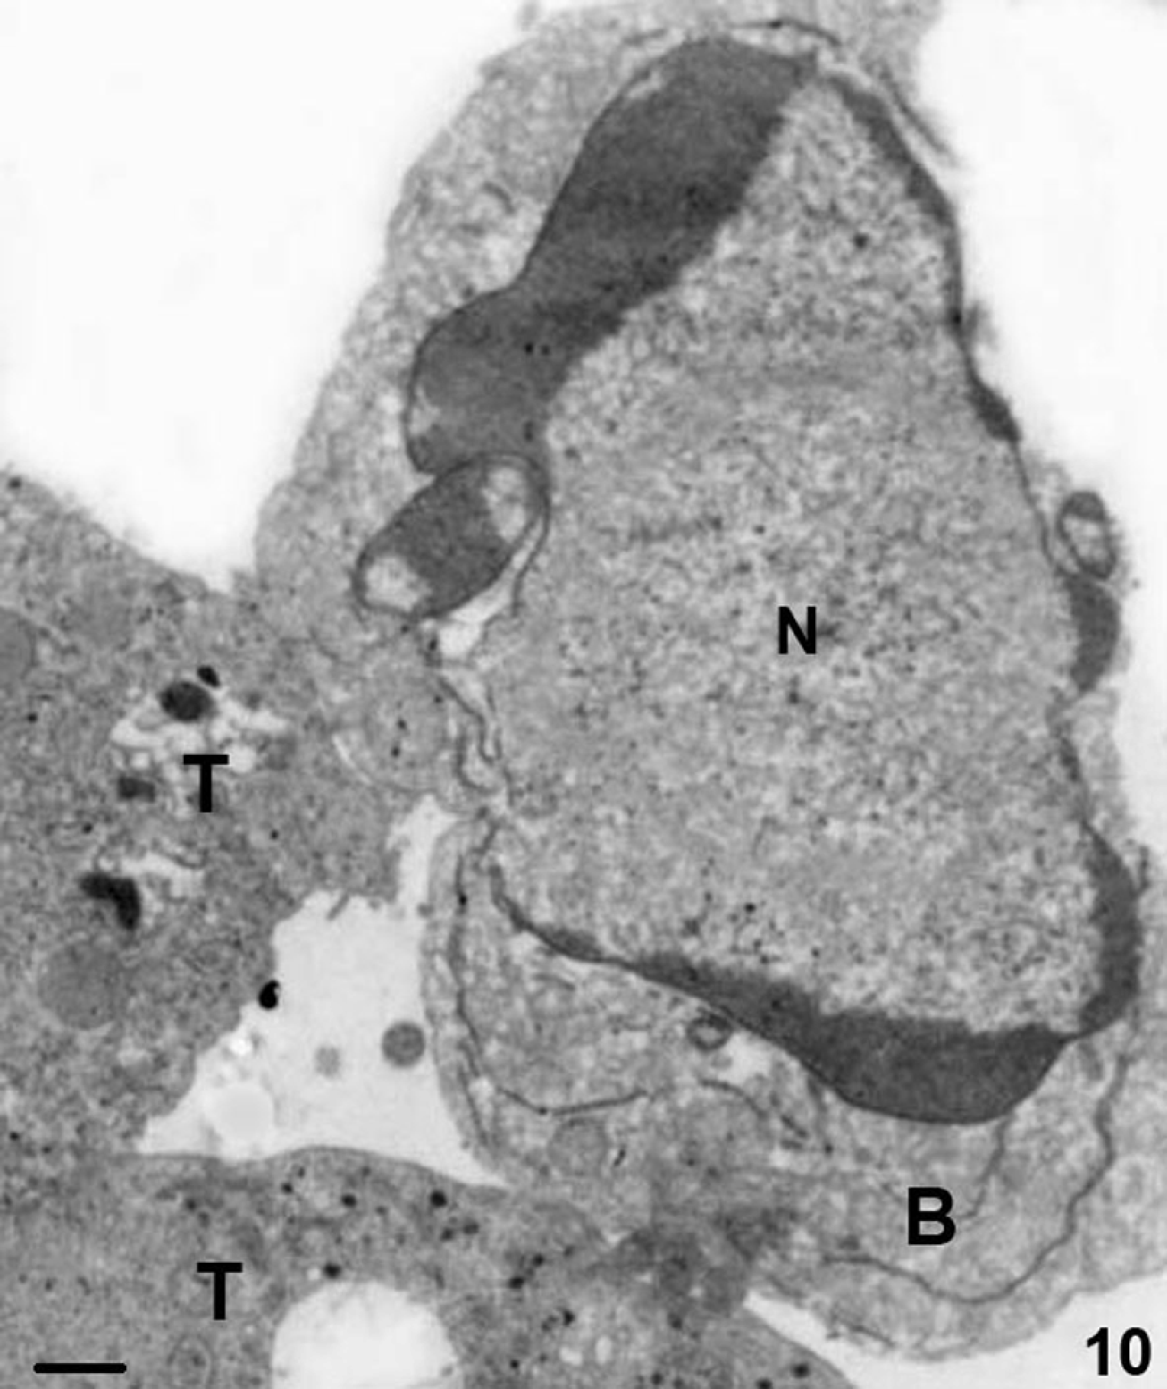
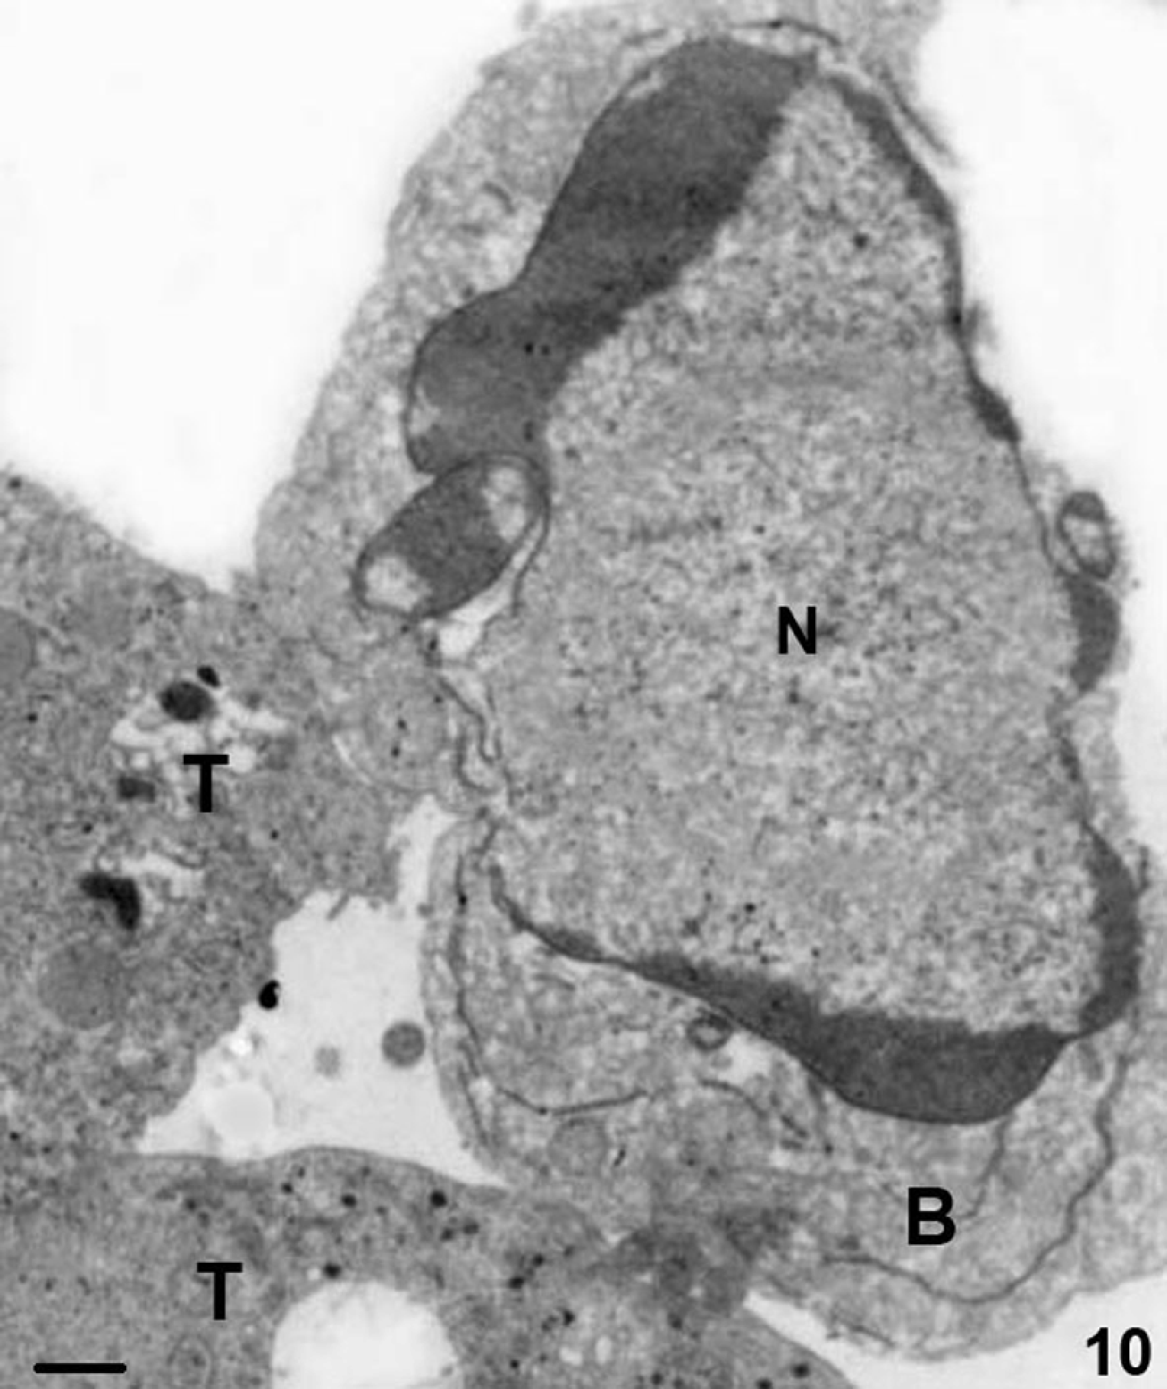
Observations made by TEM allowed us to detect small ‘forceps’ around both adhered and floating BOECs (Fig. 6a–d). Although we were working with static images, mechanical stress was inferred (Figs 4–6) and microvilli appeared to be pulled up by a ‘pinching-off’ process (Fig. 6a–d). As a result, the host cell clearly showed apoptotic (Fig. 10) and necrotic signals (Figs 7 and 8) of damage. Abundant necrotic BOECs (Figs 7 and 8) and some apoptotic cells (Fig. 10) were seen after T. vaginalis interaction.
TEM of a 20-h interaction between BOECs (B) and Trichomonas vaginalis FMV1 (T). Necrotic BOECs (NB) are observed in the process of being ingested by T. vaginalis. The parasite is able to remove small parts of the necrotic cell as seen in (a). Note that there is cell debris in the trichomonad vacuoles. Large fragments such as a nucleus can be phagocytosed (b, d). Image (c) demonstrates that phagocytosis may occur from any side of the trichomonad cell. Scale bars, 1 μm.

Cell phagocytosis
Cell debris was unmistakably incorporated by the parasites (Figs 7a–d, 8a–d and 9a–b). The sequence of events described above ended with almost total monolayer destruction after 8–12 h with fresh, virulent isolates and 18 h with long-term isolates. Phagocytosis of necrotic and/or damaged target cells was clearly observed (Figs 7c–d and 8 a–d). Different phases of the cytolytic effects were found concurrently in diverse cells of the same culture. The long-term JT strain provoked less damage to BOECs than fresh trichomonad isolates (Figs 2a–b and 11).
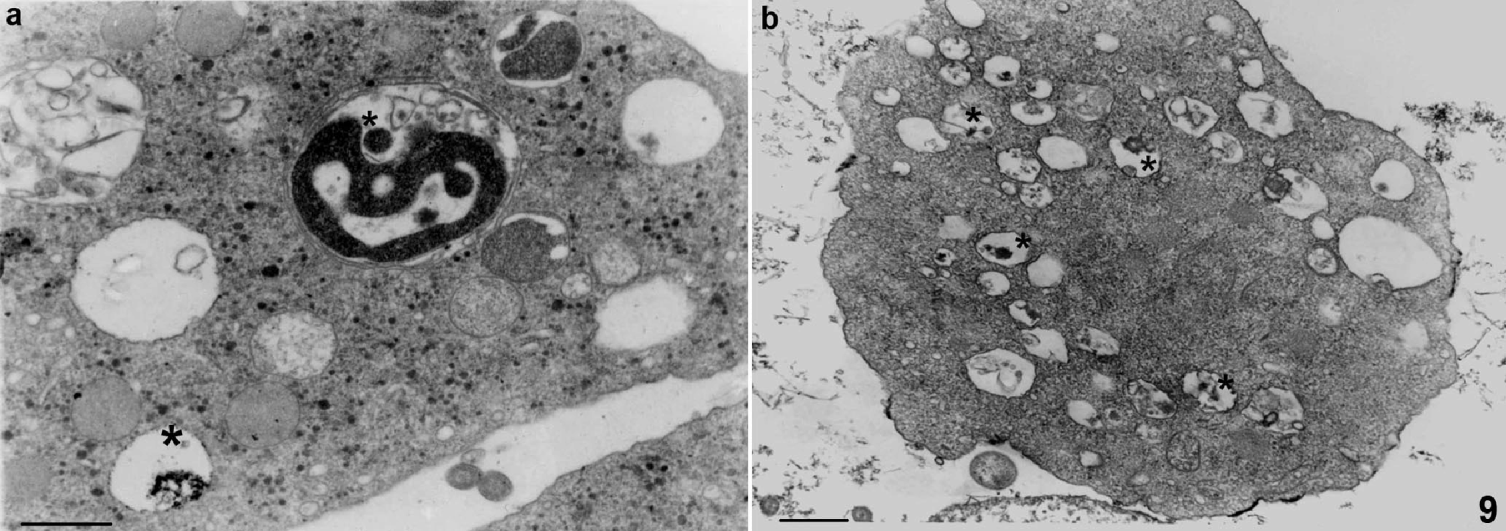
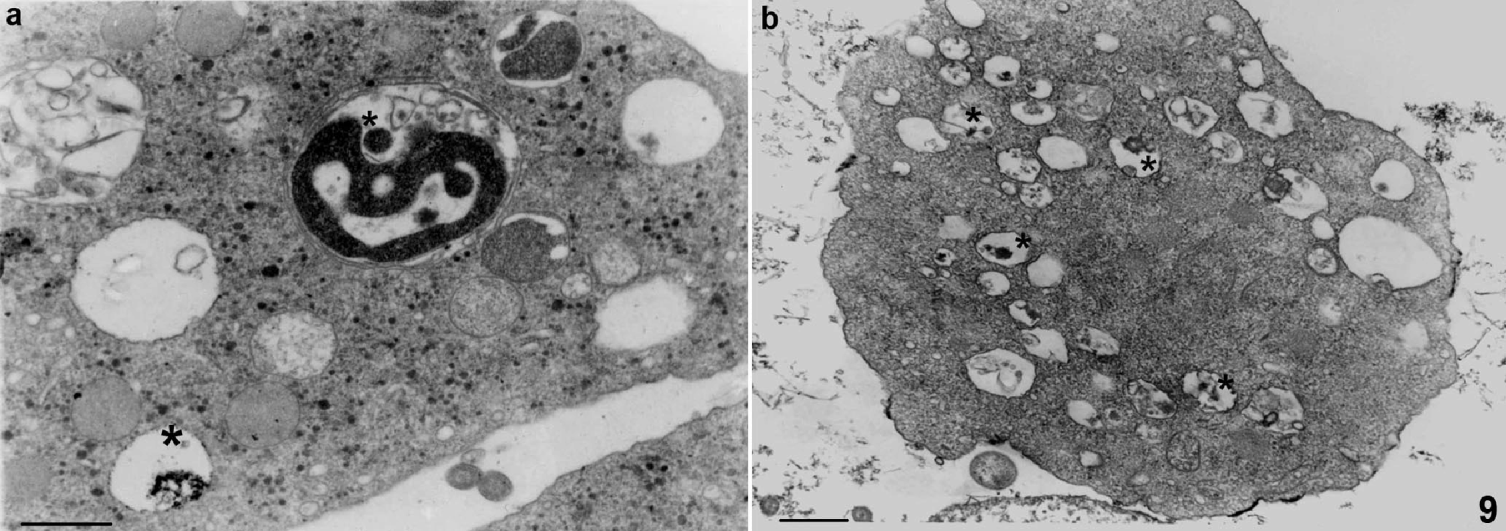
Cytochemistry for acid phosphatase (a) and ruthenium red (b). Trichomonas vaginalis T068 were cytochemically tested for acid phosphatase (asterisks) after interaction with BOECs for 21 h (a). In BOECs labelled with RR before the interaction, a positive reaction for RR was found in T. vaginalis vacuoles (asterisks) (b). Scale bars, 500 nm.
TEM of a 12-h interaction between BOECs (B) and Trichomonas vaginalis FMV1 (T), showing an apoptotic cell with condensed chromatin at the nuclear periphery (N). Scale bar, 300 nm.
(a) Kinetics of adherence of Trichomonas vaginalis JT and FMV1 strains on BOEC monolayers. The experiments were performed at a parasite:BOEC ratio of 5:1 with 60 μm cytochalasin D; controls did not receive the drug. The number of adhered parasites was estimated by counting 100 random fields under scanning electron microscopy. (b) Cytotoxicity levels of T. vaginalis strains JT and FMV1 on monolayers of bovine epithelial cells (BOECs) with and without CytoD treatment. Spectrophotometric analyses were performed after crystal violet staining. Plates were stained after parasite interaction with epithelial cells for different periods. The colour intensity reveals the remaining host cells in the wells after the trichomonad interaction. Note that the FMV1 strain provoked greater damage to BOECs than the JT strain. The values are the means of 2 independent experiments performed in triplicate.

T. vaginalis was able to simultaneously phagocytose different necrotic or damaged target cells with different parts of its body (Fig. 8c), showing no preferential region for endocytic activity, contrary to observations made by Brugerolle (Reference Brugerolle1971). In the present study, we did not find any viable or whole BOECs being phagocytosed by trichomonads. However, necrotic cells presenting recognizable cell organelles such as the nucleus were frequently seen (Fig. 8). BOEC cell debris was seen incorporated in several intracellular vacuoles in T. vaginalis (Figs 7–9). In order to determine whether the cell fragments were sorted to lysosomes, cytochemistry for acid phosphatase was performed after the interaction of T. vaginalis with BOECs (Fig. 9a). In addition, in order to confirm that the intra-vacuolar material observed in trichomonads originated from the host cells, BOECs were labelled with ruthenium red (RR) (Fig. 9b) before the interaction. Positive reactions were found for acid phosphatase (Fig. 9a) and RR in the vacuoles containing ingested material (Fig. 9b).
Detection of host cell cytotoxic activity
To measure the cytotoxic effects of T. vaginalis on primary oviduct cells, we used a previously described method (Alderete and Pearlman, Reference Alderete and Pearlman1984). Interactions of T. vaginalis and BOECs were performed on 24-well plates and spectrophotometric analyses were carried out after crystal violet staining. Plates were stained after parasites interacted with epithelial cells for different durations. Figure 11 presents the kinetics of damage to BOECs by trichomonad strains of different virulence. All cytotoxicity measurements of experimental (E) samples were indexed to those of control (C) samples, for which no loss of cells from the microtitre plates was evident under the assay conditions, subtracted from 1·0. The colour intensity reveals the remaining host cells in the wells after the trichomonad interaction. Strains of higher virulence such as FMV1 provoked greater damage to BOECs than the JT strain (Fig. 11). That is, isolates of T. vaginalis cultured for several years in the laboratory, such as the JT isolate, induced less monolayer disruption than the fresh, more virulent isolates (FMV1 and T068).
At the interaction site, the cytoplasm of the adherent trichomonads presented peripheral fibrogranular zones formed by actin-containing components (Figs 5a–b and 6a). However, not all cells exhibited this actin layer (Fig. 7). When trichomonads were treated with cytochalasin D, the adhesion capacity of all three trichomonad strains clearly decreased (Fig. 11a); however, almost no differences were observed concerning cytotoxicity (Fig. 11b).
DISCUSSION
T. vaginalis initially adheres to and infects the vagina, causing vaginitis, and some authors stated that the parasites are able to move to the uterus and oviduct (Singh et al. Reference Singh, Hayes, Lucas, Beach and Gilbert2005). However, there are no studies of trichomonads infection in the cow's oviduct, although this organ is the natural passage of the early stage of embryo development and this is likely to be important in mediating infertility.
Despite extensive studies, little is known about the pathogenesis of trichomoniasis and the mechanisms that provoke acute inflammation in the human host. T. vaginalis has been considered non-invasive since human biopsies revealed that the parasite did not penetrate the epithelium (Nielsen and Nielsen, Reference Nielsen and Nielsen1975). However, Krieger et al. (Reference Krieger, Ravdin and Rein1985) stated that more virulent strains of trichomonads could disrupt epithelial layers and reach deeper cells in tissues. In the present study, we demonstrated that depending on the virulence of the strain, this parasite is able to rapidly destroy and phagocytose fragments of dead host cells.
Adherence to the epithelium
We have compared a laboratory strain that has been maintained for more than 20 years in axenic culture with freshly isolated strains. Contrary to the findings of Rasmussen et al. (Reference Rasmussen, Nielsen, Lind and Rhodes1986), which showed that long-term laboratory strains did not adhere to epithelial cell monolayers, we found adhesion in all cultures tested. At the interaction site, the cytoplasm of adherent T. vaginalis exhibited modifications, such as a cortical zone devoid of organelles, ribosomes and glycogen particles where actin-containing components have been reported (Brugerolle et al. Reference Brugerolle, Bricheux and Coffe1996; Pereira-Neves et al. Reference Pereira-Neves and Benchimol2007). However, treatment with CytoD decreased the cell-cell adhesion and to a lesser extent the cytopathogenicity. It is possible that microfilaments are important for firm attachment, but less so for cytotoxicity.
Cytolysis by mechanical damage
The capability of T. vaginalis to kill and phagocytose target cells could be correlated with the clinical observation that this parasite provokes vaginitis with punctuated haemorrhages. Our findings also correlate with clinical findings that trichomonads are found associated with necrotic cells (Nielsen and Nielsen, Reference Nielsen and Nielsen1975; Rasmussen et al. Reference Rasmussen, Nielsen, Lind and Rhodes1986). Previous authors (Krieger et al. Reference Krieger, Poisson and Rein1983; Fiori et al. Reference Fiori, Rappelli, Rocchigiani and Cappuccinelli1993, Reference Fiori, Rappelli, Addis, Sechi and Cappuccinelli1996, Reference Fiori, Rappelli, Addis, Mannu and Cappuccinelli1997) investigated the mechanisms used by T. vaginalis to damage cellular membranes using erythrocytes as target cells and suggested the existence of functional pores in the target membrane, such as haemolysin. We agree that cytolysis may be required to provide nutrients to the parasites.
Here, we demonstrated that T. vaginalis is able to mechanically stress the host cell in vitro by pulling up microvilli until the plasma membrane ruptures, which leads to cytoplasm leaking and cell death by secondary necrosis. This type of mechanical stress, resembling a ‘pinching-off’ of the microvilli of the target cells, has been similarly described in amoebae (Martinez-Palomo et al. Reference Martinez-Palomo, González-Robles, Chávez, Orozco, Fenádez-Castelo and Cervantes1985) and in macrophages during ingestion of tumour cells (Chambers and Weiser, Reference Chambers and Weiser1969). Similar observations have been reported in Acanthamoeba castellanii and T. vaginalis when in interaction with MDCK cell monolayers (González-Robles et al. Reference González-Robles, Castanon, Cristóbal-Ramos, Lázaro-Haller, Omaña-Mlina, Bonilla and Martinez-Palomo2006, Reference González-Robles, Lazaro-Haller, Anaya-Velazquez and Martinez-Palomo1995). However, as far as we know, this work presents for the first time clear-cut images of the subsequent stage, when trichomonads ingest and digest cell organelles, nuclei and other less distinguishable cellular fragments.
It is important to note that contact-independent cytolytic mechanisms have been proposed and the major cytolytic effects have been attributed to substances secreted by the parasite in the culture medium (Singh et al. Reference Singh, Lucas, Hayes, Kumar, Beach, Frajblat, Gilbert, Sommer and Costello2004; Kummer et al. Reference Kummer, Hayes, Gilbert, Beach, Lucas and Singh2008).
Trichomonas phagocytoses the host cell
Here, we closely observed trichomonad behaviour after cell adhesion i.e., the consequences of parasite adhesion. We observed that the target cells were detached from the substrate while dozens of trichomonads were clustered around them, inducing cell death by apoptosis (condensed chromatin, membrane blebbing) and necrosis (plasma membrane rupture, organelle liberation). Organelles, nuclei and other cellular debris were promptly phagocytosed by the trichomonads. These events were observed in cells grown either as monolayers or floating cells, and with all parasite strains tested here, although the cytopathic effects were more pronounced with fresh isolates, such as the FMV1 and T068 strains. In all experiments, only fragments of necrotic cells were ingested; never living or apoptotic cells. This could be explained by the size of mammalian cells, which is many times larger than the parasite, since previous studies have shown that living or dead yeast (Pereira-Neves and Benchimol, Reference Pereira-Neves and Benchimol2007) and bacteria (Benchimol and De Souza, Reference Benchimol and De Souza1995; Francioli et al. Reference Francioli, Shio, Roberts and Muller1983) are promptly ingested by trichomonads. Other cell surface elements might also be involved in cell recognition since some bacterial strains are not ingested by T. vaginalis (Pereira-Neves and Benchimol, unpublished observations) whereas in other cell types, fibronectin, carbohydrates and other cell surface molecules are important factors (Benchimol et al. Reference Benchimol, Da Cunha e Silva, Elias and De Souza1986, Reference Benchimol, Batista and De Souza1990, Reference Benchimol, De Andrade Rosa, Da Silva Fontes and Burla Dias2008; Bonilha et al. Reference Bonilha, Ciavaglia, De Souza and Costa e Silva Filho1995). Thus, T. vaginalis seems to act differently from amoebae, which are able to ingest epithelial cells regardless of whether they have been previously lysed or not (Martinez-Palomo et al. Reference Martinez-Palomo, González-Robles, Chávez, Orozco, Fenádez-Castelo and Cervantes1985). The haemolytic and phagocytic activities of the parasites have been correlated with their virulence (Krieger et al. Reference Krieger, Poisson and Rein1983; Dailey et al. Reference Dailey, Chang and Alderete1990; Burgess et al. Reference Burgess, Knoblock, Daugherty and Robertson1990; Pereira-Neves and Benchimol, Reference Pereira-Neves and Benchimol2007) although, it is important to point out, soluble mediators at the vaginal mucosal surface may modify the parasite phagocytic activity. Cytolysis may be an important process that provides nutrients to trichomonads.
In a biochemical study of the interaction between T. vaginalis and CHO cells, the authors stated that the parasite kills vertebrate cells without phagocytosis (Krieger et al. Reference Krieger, Ravdin and Rein1985). Our results are in agreement with this work in the following respects: (1) contact-dependent interaction is needed and (2) trichomonads kill target cells in culture by an extracellular process. However, this group found that the parasite kills vertebrate cells without phagocytosis, in contradiction to our results. This discrepancy may be explained by the fact that the Krieger group did not follow up with electron microscopy the events after the target cells interacted with the trichomonads.
No preferential site for phagocytosis
Although Brugerolle (Reference Brugerolle1971) reported that phagocytosis of particles by T. vaginalis preferentially occurs at the posterior two-thirds of the parasite body, this polarization was not observed in any of the phagocytosis assays used herein. Our data, then, support the results obtained by Francioli et al. (Reference Francioli, Shio, Roberts and Muller1983), Rendón-Maldonado et al. (Reference Rendón-Maldonado, Espinosa-Cantellano, González-Robles and Martinez-Palomo1998) and Pereira Neves and Benchimol (Reference Pereira-Neves and Benchimol2007), who were unable to identify a preferential site for phagocytosis by this parasite. In addition, we observed that the same cell is able to phagocytose multiple fragments of the host cells at different regions of the cell surface at the same time.
Sorting to lysosomes
In order to investigate whether phagocytosed BOEC fragments were sorted to lysosomes, acid phosphatase activity was determined before and after interaction of trichomonads with target cells. BOEC fragments were found in different stages of degradation, thus confirming that the parasite digests the internalized cell fragments. In addition, when the host cells were labelled with ruthenium red before the interaction, this material was found in trichomonad vacuoles, again verifying the ingestion of host cell debris. Jesus et al. (Reference Jesus, Podlyska, Lopes, Vannier-Santos and Meyer-Fernandes2002) showed that T. vaginalis releases acid phosphatase into the culture medium. This observation could be attributed to the death of some trichomonads that became necrotic and thus leaked lysosomal enzymes or may be a strategy used by trichomonads to attack target cells in order to facilitate cell lysis.
The cytopathogenic action of T. vaginalis could be divided into 4 stages: adhesion, cytolysis following contact, phagocytosis and intracellular digestion. T. vaginalis is considered as a non-ulcerative STD. However, in acute symptomatic infections, punctuated haemorrhagic spots on the vaginal and cervical mucosa as well as pain during sexual intercourse may suggest that this infection could be, at least in some cases, an ulcerative infection. If trichomonads are able to destroy and phagocytose epithelial cells in vivo, they could provoke lesions in the mucosal surface of the urogenital tract, thus providing portals of entry for pathogens such as HIV-1. In summary, we conclude that T. vaginalis destroys cultured epithelial cells using cytolytic mechanisms that include attachment, mechanical damage, phagocytosis and later intracellular lysosomal degradation. These findings open possibilities for further research on the molecular mechanisms of the parasite-host cell interaction, leading to a better understanding of the pathogenicity of this parasite.
ACKNOWLEDGMENTS
The authors thank Dr J. Baptista and Dr J. F. Alderete for kindly supplying the FMV1 and T068 strains, respectively. This work was supported by CNPq (Conselho Nacional de Desenvolvimento Científico e Tecnológico), PRONEX (Programa de Núcleo de Excelência), FAPERJ (Fundação Carlos Chagas Filho de Amparo à Pesquisa do Estado do Rio de Janeiro) and AUSU (Associação Universitária Santa Úrsula).