

CONVENTION LOCATIONS
As Republicans and Democrats selected a convention site for the 2016 presidential election, each considered the location or placement factor. Unlike the “bump” that occurs in national polls after a presidential convention (Campbell Reference Campbell2000), this location factor is the belief that placing a convention in a state can flip it in presidential voting or make it more competitive. Host cities may be selected in part because they are located in critical swing states that parties want to flip or hold (Gillman Reference Gillman2014; Jackovics Reference Jackovics2012).
The selection of Philadelphia by the Democrats and Cleveland by the Republicans as 2016 host cities demonstrates this belief. During the general election in 2012, Pennsylvania was perceived as a battleground state, one of the few in which at least one presidential candidate visited after the general election (Koza et al. Reference Koza, Fadem, Grueskin, Mandell, Richie and Zimmerman2013, 35). With its 20 electoral votes, Pennsylvania is a state that Democrats want to hold in 2016, thereby endorsing the wisdom of holding the Democratic National Convention (DNC) there.
Ohio is the consummate swing state critical to the electoral success of presidential candidates (Hunter Hecht and Schultz Reference Hunter Hecht and Schultz2015). Obama won it in 2008 and 2012, Bush in 2000 and 2004, and Clinton in 1992 and 1996. If the convention-bump thesis is correct, then locating the Republican National Convention (RNC) in Cleveland makes sense.
Possible proof of a convention bonus is placement of the DNC in Colorado in 2008. Democrats went from losing the state in 2004 by 4.7% of the popular vote to Barack Obama winning it in 2008 by a margin of 8.95%—a lift or pickup of 13.65%. Obama’s 2008 victory in Colorado may be the exception. In general, there is no location benefit. Consider the placement of the 2008 RNC in St. Paul, Minnesota. Republicans, including then-governor Republican Tim Pawlenty, thought Minnesota was a purple state and that holding the convention there might swing it to red (Associated Press 2008). However, just the opposite occurred. In 2004, John Kerry won Minnesota by 3.5%; Obama then won it by 10.24%. The Republicans were down 6.75% in Minnesota by holding a convention there, again suggesting no lift in that election for Republicans.
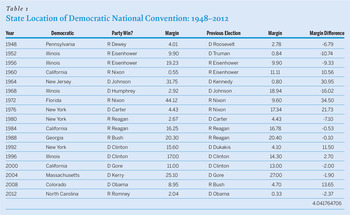
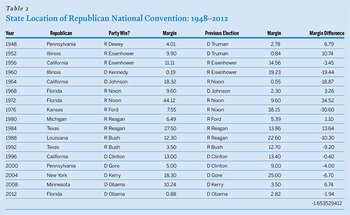
Systematic evidence reveals a mixed picture for the convention-location lift. Tables 1 and 2 list Democratic and Republican convention states from 1948 to 2012. The analysis begins with the first post–World War II, Depression, New Deal, and Franklin Roosevelt presidential election to avoid any distortion that those events may impose. In addition, beginning with 1948 provides a sufficient number of presidential elections to assess recent historical patterns.
State Location of Democratic National Convention: 1948–2012

State Location of Republican National Convention: 1948–2012

Since 1948, there have been 17 presidential elections, producing 34 national conventions for the Democrats and the Republicans. Of those 34 conventions, when a party had one in a specific state, there was no change in 23 situations (67.6%) regarding who won the state compared to the previous election. There were five instances of apparent lifts that produced a flip. In 1976 and 2008, the Democrats held conventions in New York and Colorado, respectively, and flipped states that in the previous election cycle had gone GOP. In 1948, 1952, and 1968, Republicans held conventions in Pennsylvania, Illinois, and Florida, respectively, and flipped states that in the previous election cycle had gone Democrat. A total of five states flipped (14.7%).
Conversely, in 1948, 1952, 1980, and 2012, Democrats held conventions in Pennsylvania, Illinois, New York, and North Carolina, respectively, but lost those states even though they had won them in the previous election cycle. In 1960 and 1964, Republicans held conventions in Illinois and California, respectively, and lost those states even though they had won them in the previous election cycle. Thus, a total of six states were lost (17.6%). Five states flipped and six states counter-flipped, or were lost that had been won in the previous presidential election. There is a slightly better chance of a party losing a state by hosting its presidential convention there.
Perhaps a better measure is not to look at whether states flipped but rather whether the convention-location advantage materialized differently. Did the party holding a convention in that state make the election more competitive? On first glance, there is evidence for this. For the 34 political conventions listed, there is a 1.2-point average gain in the presidential popular vote for a party holding a convention in a state compared to the popular vote in that state during the previous election. For the Democrats, the mean gain is 4.04%; for Republicans, it is -1.65%. In 19 instances (56%), the party holding a convention in a state received a smaller percentage of the popular vote compared to the previous election. In approximately half of the cases, a party fared better and in half of the cases, it did worse.
Even the apparent 1.2% gain means little, obscuring what actually occurred. For example, in 1968, Richard Nixon defeated Hubert Humphrey in Florida by 9.6%. The RNC held its 1972 convention in Florida and Nixon beat McGovern in that state by 44%! Nixon won California in 1960 by about 0.5%; when the Democrats held their convention in that state in 1964, they won it by more than 18%. Convention-location advantage? No. Instances of blowout elections—Johnson in 1964, Nixon in 1972, Reagan in 1980 and 1984, and perhaps Clinton in 1996 and Obama and 2008—distort the apparent advantage.
Perhaps the placement of a convention in a specific state is simply to make it more competitive. Even if a convention cannot flip a state, perhaps it narrows the margin of victory for opponents, forcing them to divert resources from other competitive states. Is there evidence that the location of a convention makes a state more competitive? Since 1948, the mean popular vote for the state hosting the DNC was 48.08%, whereas the national share of the popular vote was 46.88%—an average difference of 1.2%. Since 1948, the mean popular vote for the state hosting the RNC was 50.83%, whereas the national share of the popular vote was 48.83%—an average difference of 2%. Footnote 1 On first impression, it appears that parties holding a convention in a specific state statistically receive a greater percentage of the state popular vote compared to the national popular vote. Yet, the apparent differences do not hold up statistically. Using a two-tailed t-test and a confidence level of 0.05, for the Democrats, the t-value is 0.470465 and the p-value is 0.641214. The result is not significant at p<0.05. For the Republicans, the t-value is 0.742398 and the p-value is 0.463262. The result is not significant at p<0.05. Other reasons may explain any voting-percentage differences, but claims to a convention-location advantage can be rejected.
Even if a convention cannot flip a state, perhaps it narrows the margin of victory for opponents, forcing them to divert resources from other competitive states.
Another measure of a convention-location advantage may be to review the popular-vote percentage for the party holding a convention in that state in a specific election compared to the next presidential election. If there is an advantage, then we might assume that a party’s popular-vote percentage in that state would decrease in the election subsequent to the one where it previously held its national convention. However, this is not the case.
The mean popular vote in states where the Democrats held their convention was 48.35%. Four years later, in the next presidential election, their mean popular vote was 49.61%. The mean popular vote in states where Republicans held their convention was 49.76%. Four years later, it was 50.18%. Both parties apparently fared worse in the states in those years that they held conventions there compared to four years later. However, two-tailed t-tests at p<0.05 failed to find a statistically significant difference in vote totals in years where parties held a convention in a state compared to the next presidential election. Moreover, Democrats lost two states in the next election after holding a presidential election there four years earlier, but they picked up four states that they had previously lost when they held a convention there. For Republicans, they lost three states that they previously had won and picked up one. Overall, comparing elections where states had either the RNC or DNC to the next presidential election, five states were lost and five were picked up.
Finally, the issue may not be an absolute gain in votes as a result of a convention but rather relative to the overall national-election trends. Therefore, in years in which a Democrat wins the presidency, we might expect a state where the DNC holds its convention to fare better compared to years when a Republican wins the presidency. Thus, do we see change or gain in support for a candidate in a state whose party holds its national convention there? For Democrats, comparing the change in popular vote in a state from the election before the convention to the convention election, the average was a gain of 4.04% in the state compared to a national number of -0.13. On the face of it, Democrats apparently fare relatively better in states in years where the DNC is held. However, using a two-tailed t-test, the t-value is 1.05244 and the p-value is 0.300482. The result is not significant at p<0.05. Similarly, for Republicans, comparing the change in popular vote in a state from the election before the convention to the convention election, the average was a loss of 1.65% in the state compared to a national number of 0.99. Using a two-tailed t-test, the t-value is 0.63613 and the p-value is 0.529216. The result is not significant at p<0.05. There is no evidence of a relative gain in states hosting the DNC or RNC compared to national trends.
The evidence on presidential conventions contradicts conventional wisdom—there is no state-host-convention advantage, although some scholars noted convention impacts at the local level in the community of the host city (e.g., Atkinson et al. Reference Atkinson, Mann, Olivella, Simon and Uscinski2014). Instead, specific factors unique to each election affect how a state and its people will vote. National-convention host-state lifts or bonuses are more likely a media fiction or political-party myth.
FAVORITE SONS AND DAUGHTERS: THE VICE-PRESIDENTIAL BUMP
Over time, the criteria for vice-presidential selection has varied. In the early days of the republic, the vice president was the presidential runner-up. Federalist Party John Adams won the presidency and his Democratic–Republican rival Thomas Jefferson assumed the vice presidency. Yet, the election of 1800, in which Jefferson and his vice-presidential candidate Aaron Burr tied in the Electoral College, produced the Twelfth Amendment that made the presidential and vice-presidential candidates a ticket selected together.
Throughout most of the nineteenth century, geography was the preferred factor that dominated vice-presidential selection (Polsby and Wildavsky Reference Polsby and Wildavsky2000). A presidential candidate from the North was required to select a Southern or Western running mate. There is little statistical evidence that such geographical balance had any meaning, but it nevertheless persisted as a legend important to presidential prospects well into the twentieth century. Some scholars point to JFK placing LBJ on the 1960 ticket as crucial to Democrats winning Texas, the South, and the election (Polsby and Wildavsky Reference Polsby and Wildavsky2000, 143). Yet, in 1960, the South was still Democratic—at least nominally—and even as late as 1968, Humphrey won Texas.
A tremendous fuss often is made about vice-presidential selection. However, among other factors considered in choosing a vice president is the selection of someone from a critical state that the party wants to win. The selection of a favorite son (or daughter, as in the case of Geraldine Ferraro in 1976 and Sarah Palin in 2008) from a specific state occurs with the belief that it will produce a bump (national or state-specific) or perhaps flip the state from the other party to that of the presidential ticket. Do vice-presidential selections make an electoral difference, especially in terms of serving as a favorite-son or favorite-daughter bump that will help to deliver their home state? Previous research questioned the impact of vice-presidential home-state bumps and found little evidence, especially compared to presidential home-state bumps (Devine and Kopko Reference Devine and Kopko2013). Even then, Devine and Kopko contended that vice-presidential candidates did not change the results (about who won) in their home state (ibid.).
Nevertheless, potential evidence seems to suggest that a vice-presidential candidate might be useful in terms of helping a candidate with the veep’s home state. Clinton won Tennessee in 1992 and 1996 with Gore on the ticket after Bush won the state in 1988. However, Lloyd Bentsen did not bring Texas over to Dukakis in 1988; in 1980, Carter would have won Minnesota regardless of Mondale; George H. W. Bush would have won Indiana without Quayle; and George W. Bush would have won Wyoming without Cheney. Obama won Delaware in 2008 with Biden on the ticket but Kerry also won the state in 2004 with John Edwards (who failed to win his home state of North Carolina). Proof of vice presidents who deliver their home state seems mixed but there are sufficient examples or evidence of flips to give the favorite-son factor credence. Yet, more systematic analysis fails to find support for this phenomenon.
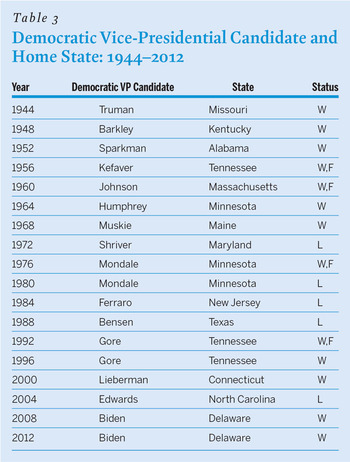
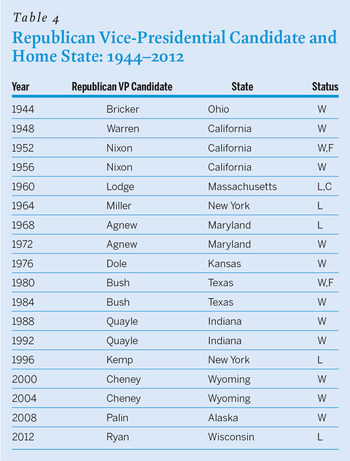
For the same reason to analyze convention bumps beginning in 1948, we consider vice-presidential selection for Democrats and Republicans from that year to 2012. Tables 3 and 4 identify vice-presidential candidates for the Democratic and Republican parties from 1944 to 2012. (The 1944 election was included to establish a baseline for the 1948 election.) The tables also show the home state of the vice-presidential candidate and indicate which party won the state. More specifically, they indicate whether the party of the vice-presidential candidate won or lost the state. Tables 3 and 4 also indicate whether the state flipped from the previous election, either in the direction of the party of the vice-presidential candidate or opposite to it. An “F” signifies flipping in the direction of the vice-presidential candidate, whereas “C” (counter-flip) indicates that the state flipped to the party opposite the vice-presidential candidate, in comparison to the previous election.
Democratic Vice-Presidential Candidate and Home State: 1944–2012

Republican Vice-Presidential Candidate and Home State: 1944–2012

From 1948 to 2012, there were 17 presidential elections, yielding 34 state contests to examine the favorite-son factor. In 1972, both vice-presidential candidates were from Maryland, producing a win and a loss. In those 34 races, the party of the vice president won 24 (70.5%) contests and lost 10, which seems to be powerful evidence for the favorite-son factor. Yet, consider the flip factor: Did the party of the vice president change the result from the previous election? There are only six examples of flips (17.6%)—1952, 1956, 1960, 1976, 1980, and 1992—in which the presence of favorite sons appeared to flip the state’s popular vote from the previous election. There also was one counter-flip, in 1960, in which Henry Cabot Lodge’s appearance as the Republican vice-presidential nominee for Richard Nixon did not produce a win. Perhaps part of the reason why the Nixon–Lodge ticket lost the state was that Massachusetts was the home state of John F. Kennedy, the Democratic presidential winner.
Six examples of flips and one counter-flip provide flimsy evidence of a favorite-son factor. Similar to the convention bump, perhaps winning a state does not tell the whole story. We need to consider the selection of the vice president as making the state more competitive; therefore, even if the vice president’s party does not win, it forces the opposing party to devote more resources to that state in the hope of holding it.
We need to consider the selection of the vice president as making the state more competitive; therefore, even if the vice president’s party does not win, it forces the opposing party to devote more resources to that state in the hope of holding it.
The Democrats, from 1948 to 2012, received a mean of 48.08% of the popular vote in the home state of their vice-presidential nominee compared to 46.74% nationally, a difference of 1.34%. For the Republicans, the numbers were 51.77% and 48.83%, respectively—a difference of 2.94%. Footnote 2 On the face of it, favorite sons apparently make a difference, but two-tailed t-tests again refute that assumption. For the Democrats, the t-value is 1.428061 and the p-value is 0.161893. The result is not significant at p<0.05. For the Republicans, the t-value is 0.89329 and the p-value is 0.189186. The result is not significant at p<0.05.
Finally, similar to the testing of convention-location bumps, perhaps evidence of a favorite-son or -daughter impact should be examined in terms of a change in popular vote in a state relative to changes in the national popular vote. We again expect Republican presidential candidates to do better in the states of their vice-presidential picks in years when they won the presidency. The same would be true for Democrats.
For Democrats, the average change in popular vote in a state from the election before one of their citizens was the vice-presidential pick to that election where the average gain was 5.3% compared to a national number of -0.13. Recall that this average was distorted by the fact that in 1948, Truman and Democrats did not appear on the ballot in Alabama, the home state ofh John Sparkman, the 1952 Democratic vice-presidential candidate. In 1948, Strom Thurmond’s States Right Democratic Party appeared on the ballot in Alabama instead of Truman and the Democratic Party. However, even with that distortion—which exaggerated a favorite-son advantage in Alabama in 1952—a two-tailed t-test shows that the t-value is 1.23865 and the p-value is 0.224484. The result is not significant at p<0.05. For the Republicans, the average change in popular vote in a state from the election before one of their citizens was the vice-presidential pick to that election where the average gain was 0.7% compared to a national number of 0.99. Again using a two-tailed t-test, the t-value is -0.26301 and the p-value is 0.794232. The result is not significant at p<0.05. Thus, there is no evidence for a relative gain as a result of a favorite-son or -daughter vice-presidential pick.
There is little evidence that vice-presidential candidates have an impact as favorite-son candidates in terms of either flipping states or rendering them more competitive. Perhaps their presence on the ticket affects overall turnout or perhaps it has a “down-the-ballot” impact in terms of affecting other races. This is a topic for future study.
It is not surprising that vice-presidential candidates have little impact on how people vote. Research in general reveals that only 59% of the population can name the vice president, much less the candidate, which suggests the limited impact of a running mate in terms of affecting voter choice (Pew Forum on Religion & Public Life 2010). For the most part, voters cast ballots for presidential candidates based on the person at the top of the ticket, not because of who is running as vice president (Polsby and Wildavsky Reference Polsby and Wildavsky2000, 146).
Yet, there are possible exceptions, such as Sarah Palin (Knuckey Reference Knuckey2012; Pomper Reference Pomper and Nelson2010). By Election Day 2008, approximately 60% to 65% of the population thought she was unqualified to be either president or vice president (Pomper Reference Pomper and Nelson2010, 59). This perception was significant because a sizable portion of the population (39%) also expressed concern about John McCain’s age (i.e., 72) and whether he would survive four years. Pomper (2010, 59) reported that McCain won only 32% of the vote among those who expressed this concern. Palin’s perceived lack of qualifications and high name recognition may have cost McCain among independent voters (Knuckey Reference Knuckey2012), although some scholars contend that the “Palin Effect” was negligible and consistent with other presidential races (Burmila and Ryan Reference Burmila and Ryan2013). Even then, Obama’s large victory and McCain’s other liabilities cast doubt about whether he could have beaten Obama—even with a different running mate besides Palin. Palin is more an example of another criterion of vice-presidential selection—that is, choose a running mate who at least will not hurt the ticket.
CONCLUSION
Every presidential-election cycle discussion of national-convention site location and selection of vice-presidential nominees often turns to how both produce state electoral advantages. The belief is that the party hosting a national convention in a specific state will perhaps be able to flip it—or at least make it more competitive. Similar claims often are made about the selection of vice-presidential candidates and their impact in terms of flipping their home state—or at least making them more competitive. The goal of this article was to test the convention and favorite-son claims. Based on a study of the previous 17 presidential elections, the evidence fails to find support for either claim.
Conventional wisdom is wrong. The real impact of conventions and favorite sons is perhaps more apocryphal than realistic, perhaps simply providing great fodder for journalists to discuss or for cities or candidates to suggest when seeking to sell themselves as hosts or potential running mates.