Introduction
No consensus as to the cause(s) of latitudinal gradients of biodiversity has emerged, despite intensive scrutiny (Brown Reference Brown2014a). The wide range of possible explanations that has been advanced includes factors such as diversification rate, habitat area, time, or geographic range shifts for which mechanistic links are relatively clear, and several other factors for which this is less true (e.g., latitudinal variation in temperature, productivity, or biotic interactions) (Mittelbach et al. Reference Mittelbach2007). The lack of consensus is especially vexing, given how common biodiversity gradients are in nature. A meta-analysis by Hillebrand (Reference Hillebrand2004) indicated that 76% of studies that quantified biodiversity along a latitudinal transect reported a statistically significant gradient (200 of the 264 studies with statistical power >0.8). By far the most common pattern is for biodiversity to increase from the poles toward the tropics (191 of 264, or 72%), with only a few taxa exhibiting a reversed pattern (9 of 264, or 3%). Latitudinal diversity gradients have been the preeminent geographic pattern of biodiversity for at least 500 Myr (Powell Reference Powell2009; Naimark and Markov Reference Naimark and Markov2011; Mannion et al. Reference Mannion, Upchurch, Benson and Goswami2014).
Here we investigate the temperature dependence of speciation and extinction rates to directly determine their net effect on latitudinal variation in diversity, using the highly resolved late Cenozoic fossil records of four marine planktonic taxa. We focus specifically on the role of temperature, as well as latitude, because any credible explanation for the existence of biodiversity gradients must account for the close empirical relationship of biodiversity and temperature (Currie Reference Currie1991; Roy et al. Reference Roy, Jablonski, Valentine and Rosenberg1998; Rutherford et al. Reference Rutherford, D’Hondt and Prell1999; Allen et al. Reference Allen, Brown and Gillooly2002; Davies et al. Reference Davies, Savolainen, Chase, Moat and Barraclough2004; Hunt et al. Reference Hunt, Cronin and Roy2005; Jaramillo et al. Reference Jaramillo, Rueda and Mora2006; Hawkins et al. Reference Hawkins, Diniz-Filho, Jaramillo and Soeller2007; Mayhew et al. Reference Mayhew, Jenkins and Benton2008, Reference Mayhew, Bell, Benton and McGowan2012; Wang et al. Reference Wang, Brown, Tang and Fang2009; Tittensor et al. Reference Tittensor, Mora and Jetz2010; Storch Reference Storch2012; Fenton et al. Reference Fenton, Pearson, Dunkley Jones, Farnsworth, Lunt, Markwick and Purvis2016). Mechanisms that have been proposed to link the two have tended to attribute high diversity to the acceleration of speciation rates at warmer temperatures (Allen et al. Reference Allen, Brown and Gillooly2002, Reference Allen, Gillooly, Savage and Brown2006; Wang et al. Reference Wang, Brown, Tang and Fang2009; Gillman and Wright Reference Gillman and Wright2014; Schluter Reference Schluter2016). However, specific models have been criticized on conceptual grounds or have weak empirical support (Hawkins et al. Reference Hawkins, Diniz-Filho, Jaramillo and Soeller2007; Stegen et al. Reference Stegen, Enquist and Ferriere2009; Storch Reference Storch2012; Glazier Reference Glazier2015; Schluter Reference Schluter2016). As a result, Brown (Reference Brown2014a, Reference Brownb) concluded that there is at this time no known mechanistic link between speciation and temperature. Based on empirical results for four taxa of marine plankton with excellent fossil records, we show that speciation and extinction rates do not vary consistently or significantly with temperature or latitude. Instead, biodiversity gradients arise primarily as a result of asymmetric geographic range expansion of species after their origin, which amplifies species diversity in particular latitudinal regions by greater net invasion.
Methods
Fossil occurrence data for planktonic foraminifera, calcareous nannoplankton, diatoms, and radiolarians from the Oligocene (33.9 Ma) to the present were downloaded from the Neptune Sandbox Berlin (Lazarus Reference Lazarus1994, Reference Lazarus2011), using a resolved taxonomy and having filtered out questionable or invalid species identifications. To mitigate any biases caused by reworking, we trimmed the youngest and oldest 3% of occurrences from the stratigraphic ranges of each species (Pacman trimming; Lazarus et al. Reference Lazarus, Weinkauf and Diver2012). We also removed samples adjacent to sedimentary hiatuses if they affected temporal bin assignments. Because the number of samples decreases backward in time (Supplementary Fig. 1 and Supplementary Table 1), we limited our analyses to occurrences younger than 15 Ma in order to maintain acceptable subsample sizes within spatiotemporal bins. Older occurrences were used to identify species that first appeared prior to 15 Ma, so that only true first appearances were recorded in the first temporal bin. Extant species were identified as such if they were found in the World Register of Marine Species (WoRMS Editorial Board 2016) or if their last occurrence was younger than 0.22 Ma, the mean age resolution of the data set. Full details of these quality-control procedures are described in the Supplementary Material.
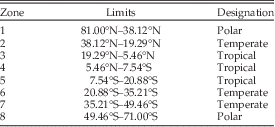
Our analytical methods were modified and extended from the sampling procedures described by Allen et al. (Reference Allen, Gillooly, Savage and Brown2006). Samples were assigned to one of eight equal-area latitudinal zones (Table 1) and one of three 5-Myr-long time intervals from 0 Ma to 15 Ma. The final data set consisted of 21,315 samples containing 229,121 occurrences of 1322 species. To control for uneven sampling in space and time (Supplementary Fig. 1), a fixed number of samples per taxon (planktonic foraminifera=39, calcareous nannoplankton=40, diatoms=12, radiolarians=25) were drawn at random and without replacement from each of the 24 spatiotemporal bins; no samples of diatoms or radiolarians were present in latitudinal zone 6. This procedure was repeated 1000 times to obtain 95% confidence intervals (CIs) for the variables used in this study. Note that temporal trends were not analyzed here; temporal binning was used only to prevent more recent occurrences from dominating the random subsamples.
Latitudinal limits of the eight equal-area zones used in this study. Names of zones are used for convenience and do not necessarily correspond to climatic zones.

We assessed latitudinal variation in speciation and extinction rates by summing the total number of first appearances (≈ speciation events), last appearances (≈ extinction events), and species in each latitudinal zone since 15 Ma. Speciation and extinction rates in each latitudinal zone were calculated as the number of first or last appearances divided by the total number of species. We directly assessed the temperature dependence of speciation and extinction rates by assigning paleo-ocean temperatures to each sample. Ocean temperatures were drawn from a 0.5° latitude by 0.5 Myr (360×30) grid constructed by adjusting present-day sea surface temperatures up or down based on the global temperature estimates in Zachos et al. (Reference Zachos, Pagani, Sloan, Thomas and Billups2001) combined with the heat equation on the surface of a sphere (Crowley and Zachos Reference Crowley and Zachos2000). This method assumes that equatorial ocean temperatures have not changed since 15 Ma, a reasonable assumption over this time span (Crowley and Zachos Reference Crowley and Zachos2000; Zachos et al. Reference Zachos, Pagani, Sloan, Thomas and Billups2001; Brierly et al. Reference Brierly2009).
Uncertainty in Determining Where Species First Appear
A potentially confounding issue is whether the latitudinal bin of a species’ true first or last occurrence (≈ speciation or extinction event) can be correctly determined from incomplete stratigraphic data. Given perfect data, the latitude at which a species originated or became extinct is represented by the endpoints of its stratigraphic range. In reality, due to incomplete sampling a species may have expanded or contracted its geographic range undetected, causing the first or last appearances to be recorded in the wrong latitudinal bin. Our results are robust to this source of error because stratigraphic ranges are known quite precisely relative to the diachroneity of species’ geographic range changes (Supplementary Fig. 2). The mean extension of species’ stratigraphic ranges within individual latitudinal bins, using the endpoint of the 50% CI on the stratigraphic range (Strauss and Sadler Reference Strauss and Sadler1989), was just 0.45 Myr for all taxa combined (bootstrapped 95% CI=0.42–0.49 Myr; N=4634 species-bin combinations). This value overestimates the error, because deep-sea cores are discretely sampled (Marshall Reference Marshall1990). In comparison, the mean time lag between a species’ first appearance and the appearance of the same species in a second latitudinal bin was 3.4 Myr (bootstrapped 95% CI=3.0–3.6 Myr; N=1044 species that expanded into another latitudinal bin). Similarly, the mean time lag between a species’ last appearance and its penultimate disappearance from another latitudinal bin was 3.8 Myr (95% CI=3.5–4.2 Myr). These results indicate that stratigraphic ranges within a particular latitudinal bin would have to be extended in either direction by more than 3 Myr, on average, for that bin to be redesignated the site of origination or extinction, an unlikely possibility given that the actual mean range extension is less than 0.5 Myr. This conclusion is also true for each of the four taxa examined separately (Supplementary Table 2).
Full details of the methods, raw data, and the R subsampling procedure are available as Supplementary Material.
Results
Speciation and Extinction Rates
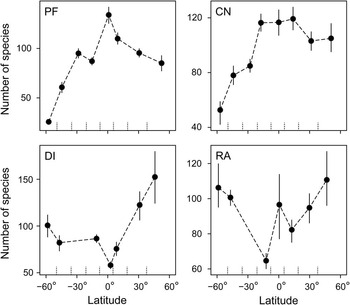
All four taxa showed significant latitudinal biodiversity gradients after controlling for the effects of area and sampling effort (Fig. 1). Planktonic foraminifera and calcareous nannoplankton, which both secrete calcareous tests, exhibited normal gradients, whereas diatoms and radiolarians, which both secrete siliceous tests, exhibited reversed gradients. Although reversed gradients are rare among all taxa, their fortuitous presence in two of the four groups examined here presents an opportunity to examine macroevolutionary dynamics for both usual and exceptional cases.
Area- and sample-standardized latitudinal biodiversity gradients, 15 Ma–present. Planktonic foraminifera (PF) and calcareous nannoplankton (CN) exhibit normal gradients, whereas diatoms (DI) and radiolarians (RA) exhibit reversed gradients. Dashed lines extending from the x-axes indicate the boundaries of equal-area latitudinal zones given in Table 1; negative values are in the Southern Hemisphere. Points are plotted at the mean latitude of samples within each bin (not the bin midpoint) because the distribution of samples within each bin is uneven (data in Supplementary Fig. 1). Error bars are 95% confidence intervals.

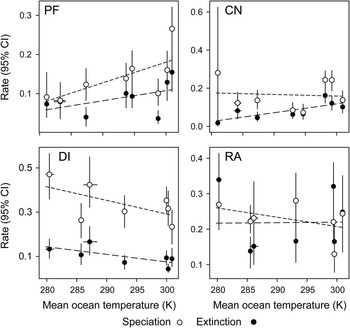
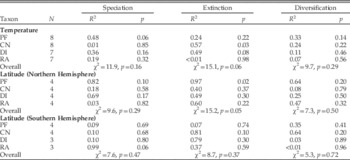
Neither speciation nor extinction rates were significantly related to temperature or latitude at a Bonferroni-corrected α of 0.006 (Fig. 2 and Table 2; the Bonferroni correction [Dunn Reference Dunn1961] divides the significance level, ɑ, by the number of tests to control for multiple comparisons). Weak relationships (0.006<p<0.10) with temperature were evident for the speciation rates of planktonic foraminifera and extinction rates of calcareous nannoplankton and diatoms. Weaker relationships (0.006<p<0.10) with latitude were evident for the speciation and extinction rates of Northern Hemisphere planktonic foraminifera and extinction rates of Southern Hemisphere calcareous nannoplankton (Table 2). Irrespective of statistical significance, these trends could not generate a biodiversity gradient, because each was offset by a similar trend in the opposing rate. As a result, no taxon exhibited a statistically significant relationship between evolutionary diversification rate (speciation minus extinction) and either temperature or latitude (Table 2). Because statistically significant results might be obtained with larger sample sizes, we also tested the aggregate significance of these relationships using Fisher’s combined probability test (Fisher Reference Fisher1970), which is possible because each taxon is an independent test of the hypothesis. We found no support for significant relationships between diversification rate and either temperature (χ2=9.7, N=4, p=0.29) or latitude (north: χ2=7.3, N=4, p=0.50; south: χ2=5.3, N=4, p=0.72).
Temperature dependence of per capita speciation (open circles) and extinction (filled circles) rates. No relationship was significant at a Bonferroni-corrected α level of 0.006 (Table 2). There was no support for any nonlinear relationship, based on the Akaike information criterion. Dashed line is a best-fit line from simple linear regression. Abbreviations as in Fig. 1.

Results for simple linear regressions of speciation, extinction, or net diversification on temperature or latitude. N refers to the number of equal-area latitudinal zones included in each analysis. Overall statistical significance was assessed using Fisher’s (1970) combined probability test.

Geographic Range Shifts
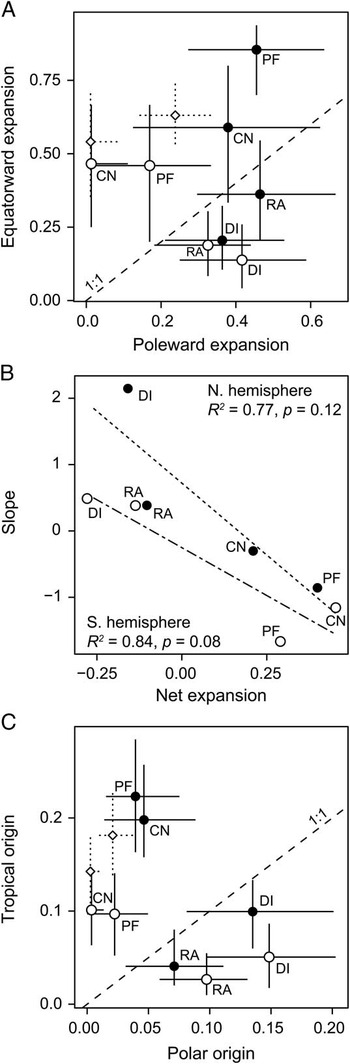
We also examined whether there is a tendency for species to expand their geographic ranges toward regions that are currently most diverse. We restricted our analysis to species that originated within temperate latitudes (using the designations in Table 1) because polar- and tropical-originating species, having only one direction in which to expand, will of necessity asymmetrically expand their range. Species that originated within the temperate zone were more likely to expand their geographic ranges in the direction of peak diversity, that is, equatorward for planktonic foraminifera and calcareous nannoplankton and poleward for diatoms and radiolarians (Fig. 3A). The asymmetry in the proportion of temperate species expanding equatorward or poleward accounts for the majority of variation in the slope of the biodiversity gradients for each hemisphere (Fig. 3B). Although neither slope is individually significant, Fisher’s combined probability test is significant (χ 2 =9.3, N=2, p=0.05).
Geographic range dynamics underpinning latitudinal diversity gradients. A, Mean proportion of species that originated in the temperate zone and then expanded into adjacent zones. PF and CN species preferentially expanded toward the equator (points above the 1:1 line), whereas DI and RA species preferentially expanded toward the poles (points below the 1:1 line). B, A large percentage of variation in the slope of the gradients is predicted by asymmetric geographic range expansion (net expansion=equatorward − poleward expansion of temperate-originating species). Dashed line is a best-fit line from simple linear regression. C, Geographic origin of all species found within the temperate zone. Temperate species were more likely to have originated in the zone in which each taxon is most diverse. Filled circles, Northern Hemisphere; open circles, Southern Hemisphere. Samples of CN and PF from latitudinal bin 6 were removed before calculating means, for comparability with DI and RA; open diamonds indicate uncorrected means. Abbreviations as in Fig. 1.

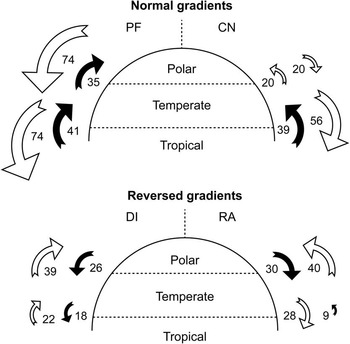
Our results also show that species of planktonic foraminifera and calcareous nannoplankton found in the temperate zone were more likely to have originated in tropical versus polar regions (Fig. 3C). This pattern of tropical origins of extratropical taxa has been previously interpreted as support for the “out of the tropics” view (Jablonski et al. Reference Jablonski, Roy and Valentine2006). However, high-diversity regions are expected to be the largest exporters of diversity on an absolute basis simply because they have a larger source pool of species (Kerkhoff et al. Reference Kerkhoff, Moriarty and Weiser2014). This point is illustrated in our data by temperate diatom and radiolarian species, which were more likely to have been derived from higher latitudes, where those taxa attain their greatest diversity (“out of the poles”). On a proportional basis, however, high-diversity regions were not the most frequent contributors of species to adjacent regions. Planktonic foraminifera, calcareous nannoplankton, and radiolarians each exhibited net equatorward probabilities of expansion, whereas diatoms exhibited a net poleward expansion (Fig. 4; data provided in Supplementary Table 3). Three of these taxa therefore expanded preferentially toward the region that is currently most diverse, as expected. The anomalous pattern exhibited by the radiolarians is actually in accord with their diversity gradient, which has a secondary, equatorial peak (i.e., a W-shaped gradient; Fig. 1), generated because radiolarian species that originated within the tropics did not expand poleward at rates high enough to offset the equatorward expansion of temperate-originating species. The overall reversed gradient of this taxon is caused by net expansion of temperate-originating species toward the poles (Supplementary Table 3).
Asymmetric geographic range expansion model, using realistically scaled arrow sizes. Numbers indicate the mean proportion of species that originated in each zone that later expanded into adjacent latitudinal zones (data provided in Supplementary Table S3). Unfilled arrows indicate the greater proportional direction of expansion. The anomalous net expansion of radiolarian species from the temperate to the tropical zone explains the secondary, circumequatorial peak in diversity in this taxon. Abbreviations as in Fig. 1.

Asymmetric range expansion is also apparent for the timing of invasion into adjacent regions. Species of planktonic foraminifera and calcareous nannoplankton that originate in the temperate zone and subsequently invade both the polar and tropical regions tend to appear earlier in the tropics. The difference is significant for planktonic foraminifera but not for calcareous nannoplankton, which have few widespread, temperate-originating species (planktonic foraminifera: 18 of 21 appear earlier in the tropics, p=0.001, the mean difference in timing is 581 Kyr; calcareous nannoplankton: 3 of 4, p=0.3, 620 Kyr). Conversely, species of diatoms and radiolarians tend to spread first to higher latitudes (diatoms: 49 of 61 appear earlier in the polar zone, p<0.001, the mean difference in timing is 3200 Kyr; radiolarians: 24 of 32, p=0.004, 940 Kyr).
Discussion
Diversification Rates versus Asymmetric Geographic Range Expansion
Our results contrast with the conventional wisdom that net diversification is responsible for species diversity gradients, rather than geographic range dynamics. However, this view has been challenged by recent studies that have found weak or no evidence for latitudinal differences in diversification rate (Wiens et al. Reference Wiens, Graham, Moen, Smith and Reeder2006, Reference Wiens, Sukumaran, Pyron and Brown2009; Ricklefs et al. Reference Ricklefs, Losos and Townsend2007; Buzas and Culver Reference Buzas and Culver2009; Jetz et al. Reference Jetz, Thomas, Joy, Hartmann and Mooers2012; Soria-Carrasco and Castresana Reference Soria-Carrasco and Castresana2012; Jansson et al. Reference Jansson, Rodríguez-Castañeda and Harding2013; Belmaker and Jetz Reference Belmaker and Jetz2015; Rabosky et al. Reference Rabosky, Title and Huang2015; Marin and Hedges Reference Marin and Hedges2016; Schluter Reference Schluter2016). Schluter (Reference Schluter2016) suggested that the discrepancy may in part be explained by the age of the clades included in the analysis. In his survey of 18 studies, clades younger than ~45 Ma showed no evidence for a difference in diversification rate between the tropics and the temperate zone, whereas about half of the older clades did (Schluter Reference Schluter2016: Fig. 2). This pattern suggests that biodiversity gradients may be historical legacies of diversification-rate gradients that no longer exist. Once established, any diversity gradient will then amplify itself, because higher-diversity regions will produce numerically more species even if the per capita diversification rate is the same among regions. Our results cannot directly address this possibility because our data do not extend earlier than 15 Ma. Nonetheless, we do not expect diversification-rate gradients to be important for generating diversity gradients at any time in Earth history because speciation and extinction rates have tended to be tightly correlated over geologic time, due to the fact that the same factors that tend to promote speciation also tend to promote extinction (Stanley Reference Stanley1990; Mayhew et al. Reference Mayhew, Jenkins and Benton2008). The linkage must be exceptionally strong considering that species selection ought to uncouple them by favoring species that are prone to speciation and resistant to extinction. Therefore, even if speciation rates were greater in the tropics, they should tend to be offset by increased extinction rates, as our data show. In support of this view, data on molecular divergence times of living eukaryotic species demonstrate that diversification rate has been approximately constant over at least the past 1 Gyr (Hedges et al. Reference Hedges, Marin, Suleski, Paymer and Kumar2015), despite major, long-term changes in global climate.
Geographic range shifts, which are capable of generating biodiversity gradients even in the absence of diversification gradients (Roy and Goldberg Reference Roy and Goldberg2007), offer a more plausible explanation for the generation of biodiversity gradients. The rate at which species shift their geographic ranges (Parmesan and Yohe Reference Parmesan and Yohe2003) is rapid in comparison to rates of species production (the time-to-speciation for a given species is ~2 Myr on average for multicellular eukaryotes; Hedges et al. Reference Hedges, Marin, Suleski, Paymer and Kumar2015) and may therefore better explain temperature effects on biodiversity over short timescales (Hunt et al. Reference Hunt, Cronin and Roy2005). The relatively nimble response of species’ ranges to climatic change also helps explain why, during Cenozoic cooling, the diversity gradient steepened mainly because tropical taxa contracted their geographic ranges and not because cooling triggered latitudinal changes in the diversification rate (Schluter Reference Schluter2016). The predominance of geographic range shifts over evolutionary diversification is further underscored by the fact that even within areas with the highest endemicity on Earth today, it is common for the majority of species to have immigrated from elsewhere. The proportion of species that are endemic is 14% on average (range 1–58%) within the 18 richest centers of marine endemism based on taxonomic compilations of reef fish, corals, snails, and lobsters (Roberts et al. Reference Roberts, McClean, Veron, Hawkins, Allen, McAllister, Mittermeier, Schueler, Spalding, Wells, Vynne and Werner2002: Table 2). A taxonomic compilation for the Red Sea that included a wider variety of taxa (corals, polychaetes, echinoderms, ascidians, crustaceans, mollusks, and fishes; DiBattista et al. Reference DiBattista2015) showed that endemic species account for no more than 15% of the richness of any of these taxa. Percent endemism is typically higher in the terrestrial realm than the marine realm, with some island biotas consisting nearly entirely of endemic species. However, typical values range from 40% to 60% endemic species (Whittaker and Fernandez-Palacios Reference Whittaker and Fernández-Palacios2007: Section 3.4 includes endemism data for plants, birds, mammals, skinks, land snails, and butterflies). Fossil data also support the view that a substantial portion of local diversity is derived from invasion from a regional species pool rather than by in situ origination (Ricklefs Reference Ricklefs1987; Caley and Schluter Reference Caley and Schluter1997; Patzkowsky and Holland Reference Patzkowsky and Holland2007). More generally, broad-scale changes in diversity among regions have tended to be driven more by geographic range shifts than by in situ speciation or extinction (Powell et al. Reference Powell, Moore and Smith2015). These studies underscore the importance of geographic range shifts as a driver of past and present regional diversity.
Liow and Stenseth (Reference Liow and Stenseth2007) have shown that geographic range changes of marine plankton tend to follow a relatively predictable pattern in which species increase their geographic extent in the initial part of their stratigraphic range and then enter a more prolonged contraction phase until extinction. The fact that most species experience a protracted period of expansion underscores the ease with which geographic range changes can produce diversity gradients, provided that the expansion is biased toward the region of highest diversity.
Out-of-the-Tropics versus Asymmetric Geographic Range Expansion
Our results seem to contrast with data showing that in some taxa with normal latitudinal gradients, more species tend to expand their geographic ranges out of the tropics than the reverse (Jablonski et al. Reference Jablonski, Roy and Valentine2006, Reference Jablonski, Belanger, Berke, Huang, Krug, Roy, Tomasovych and Valentine2013; Jansson et al. Reference Jansson, Rodríguez-Castañeda and Harding2013). However, these studies were based on absolute rather than proportional measures of species interchange (e.g., Valentine et al. [Reference Valentine, Jablonski, Krug and Roy2008] reported that three times as many marine bivalve genera have expanded out of the tropics vs. into the tropics). Expressed in this way, the “out-of-the-tropics” dynamic is an expected, emergent phenomenon of diversity gradients (Kerkhoff et al. Reference Kerkhoff, Moriarty and Weiser2014), which is also seen in our data (cf. Fig. 3C). Because greater net export of taxa to higher latitudes will weaken or destroy normal diversity gradients, the out-of-the-tropics dynamic requires a strong tropical diversity pump to maintain diversity imbalances. This diversity pump has been attributed to greater diversification rates within the tropics relative to the extratropics. For example, Jablonski et al. (Reference Jablonski, Roy and Valentine2006) reported approximately two to three times more originations of marine bivalves in tropical versus extratropical regions. However, the total diversity of marine bivalve genera reported for the same data set is also approximately three times greater in the tropics than in extratropical regions (Krug et al. Reference Krug, Jablonski and Valentine2007), implying that there are no differences in per capita diversification rate between regions that could have generated the existing biodiversity gradient. If latitude-dependent diversification rates were generally important in determining latitudinal diversity gradients, then diversification gradients should be as common as diversity gradients. However, contrary to this view, many taxa that have obvious diversity gradients have no corresponding diversification gradient (Wiens et al. Reference Wiens, Graham, Moen, Smith and Reeder2006, Reference Wiens, Sukumaran, Pyron and Brown2009; Ricklefs et al. Reference Ricklefs, Losos and Townsend2007; Buzas and Culver Reference Buzas and Culver2009; Jetz et al. Reference Jetz, Thomas, Joy, Hartmann and Mooers2012; Soria-Carrasco and Castresana Reference Soria-Carrasco and Castresana2012; Jansson et al. Reference Jansson, Rodríguez-Castañeda and Harding2013; Rabosky et al. Reference Rabosky, Title and Huang2015), as is also true for the four taxa analyzed here. Our data suggest a resolution: latitudinal diversity gradients are ultimately initiated not by latitudinal differences in relative diversification rate but by asymmetrical geographic range expansion, which is detectable as a tendency for species to expand preferentially toward specific latitudes that consequently become most species rich. According to this view, the tropics may be considered to act as a species pump only because it already contains many species, each of which may potentially give rise to new daughter species, and not because of a relatively higher probability of speciation per species.
Generalization to Other Taxa
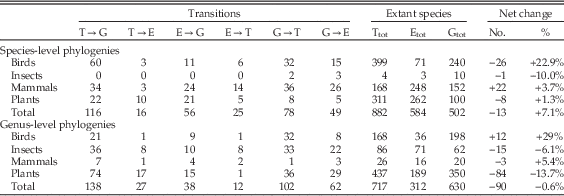
A reanalysis of data from Jansson et al. (Reference Jansson, Rodríguez-Castañeda and Harding2013) suggests that our conclusion that diversity gradients arise from asymmetric expansion of species’ geographic ranges may be generalizable to other taxa. That study inferred the frequency of geographic range shifts using multiple phylogenies of birds, mammals, insects, and flowering plants, and found that invasion of the extratropics was more frequent than invasion of the tropics; that is, in terms of absolute numbers there was a net export of taxa out of the tropics. Here we show that when the number of transitions between zones is divided by the number of taxa now found in each zone, the data show a net proportional import into the tropics of bird (+23%), mammal (+4%), and flowering plant (+1%) species (Table 3). Insects showed a net proportional export of species (−10%) but had only one species-level tree available for analysis. The agreement is less clear using genus-level phylogenies. Of the four taxa, birds (+29%) and mammals (+5%) showed a net proportional import of genera into the tropics, whereas insects (−6%) and flowering plants (−14%) showed a net proportional export. Genus-level data may obscure species-level dynamics, because some genera occupying both tropical and extratropical zones may be composed of tropical-only or extratropical-only species.
Net gain or loss of species to the tropical zone due to geographic range transitions. Data resummarized from Jansson et al. (Reference Jansson, Rodríguez-Castañeda and Harding2013: Table S1). That study categorized species as tropical (T), extratropical (E), or global (G; i.e., occupying both zones) based on their geographic ranges. Species transitions from one category to another (indicated by “→”) resulted in the six possible transition types listed in the table. Arithmetic change in tropical diversity=[E→T] +[E→G] − [T→E] − [G→E]; arithmetic change in extratropical diversity=[T→E] + [T→G] − [E→T] − [G→T]; net proportional change in tropical diversity=[E→T]/Etot + [E→G]/Etot − [T→E]/Ttot − [G→E]/Gtot; net proportional change in extratropical diversity=[T→E]/Ttot + [T→G]/Ttot − [E→T]/Etot − [G→T]/Gtot. The analysis assumes that the relative proportion of extant species in each zone was the same at the time the transitions occurred.

The potential generality of our model is also supported by separate studies of marine gastropods, mammalian Carnivora, and planktonic foraminifera. Species and genera of marine gastropods found in rocky intertidal environments also exhibit a greater probability of expansion into tropical versus extratropical regions (Rivadeneira et al. Reference Rivadeneira, Alballay and Villafaña2015), and the diversity gradient of Carnivora has been attributed to independent dispersal of multiple lineages into low latitudes following their origination in northern midlatitudes (Rolland et al. Reference Rolland, Condamine, Beeravolu, Jiguet and Morlon2015). Buzas and Culver (Reference Buzas and Culver2009) also found a high proportion of invasion into the tropics for planktonic foraminifera species.
A Plausible Mechanism Linking Diversity and Temperature in Marine Plankton
Effects of temperature on the diversity of marine plankton may operate at two causal levels: through large-scale macroevolutionary and macroecological mechanisms (e.g., diversification rates and geographic range shifts) and relatively small-scale organism- and population-level mechanisms that underlie the large-scale mechanisms. In this paper we have focused on estimating the relative importance of three large-scale mechanisms—differential rates of speciation, extinction, and asymmetric geographic range expansion—for generating diversity gradients in marine phytoplankton. However, limited data and space have prevented us from rigorously and comprehensively addressing organism- and population-level factors affecting the gradients we have observed. Multiple small-scale mechanisms are possible that may vary in importance among taxonomic groups, but to stimulate further research we propose a plausible hypothesis that is specifically relevant to the four taxa of marine phytoplankton we have studied.
Our hypothesis is that the asymmetric range expansion of marine phytoplankton is related to the temperature-sensitive metabolic cost of maintaining mineralized exoskeletons (i.e., tests, frustules, or coccoliths). This hypothesis assumes that the solubilities of calcite and aragonite in seawater decrease with temperature (Berner Reference Berner1976), whereas the solubility of biogenic silica in seawater increases with temperature (Kamatani and Riley Reference Kamatani and Riley1979), as is observed. Therefore, in the absence of other influences, the metabolic cost of exoskeletal maintenance (mineral uptake vs. loss) should decrease toward the equator for the two calcareous taxa and increase toward the equator for the two siliceous taxa. Siliceous taxa may be further constrained by the low availability of silica at low latitudes (Garcia et al. Reference Garcia, Locarnini, Boyer, Antonov, Baranova, Zweng, Reagan and Johnson2014), and calcareous taxa may be further constrained by low aragonite saturation at high latitudes (Jiang et al. Reference Jiang, Feely, Carter, Greeley, Gledhill and Arzayus2015). If so, natural selection should favor individuals (genotypes) of these planktonic taxa that dispersed toward latitudes where the temperature allows reduced metabolic costs of skeletal maintenance, thus freeing up energy for increasing fitness-enhancing growth and reproduction. Accordingly, energetic constraints at the individual level and natural selection at the population level may explain the different asymmetric range expansion patterns of calcareous and siliceous planktonic species, thus yielding their different latitudinal diversity gradients, as observed. If this hypothesis is supported by appropriate tests, which are much needed, it may justify further exploration of how latitudinal diversity gradients in other taxa may relate to energetic constraints at the individual level that in turn affect temperature-related patterns of dispersal and species-level range expansion.
This hypothesis has three major virtues. First, it connects species diversity to temperature at the level of individual organisms and their populations (with higher-level effects on species and species assemblages) and therefore provides an explanation for diversity gradients that does not require a mechanistic link between temperature and speciation rates. Unlike the problematic link between those two variables (Storch Reference Storch2012; Brown Reference Brown2014a,Reference Brownb), the effects of temperature on an individual’s probability of survival or its ability to reproduce are well-known and uncontroversial (Root et al. Reference Root, Price, Hall, Schneider, Rosenzweig and Pounds2003). Second, it can explain both normal and reversed latitudinal diversity gradients in marine plankton, which models based on simple relationships between temperature and speciation rate cannot do. Third, the underlying biochemical and physiological mechanisms that are invoked and their postulated large-scale effects are readily testable.
Other biological or ecological differences (e.g., those involving trophic requirements and water-depth occurrence) between the four taxa of marine phytoplankton studied here may also affect their latitudinal diversity gradients. However, taxonomic differences in trophic requirements do not appear to have any explanatory power inasmuch as the autotrophic calcareous nannoplankton and diatoms exhibit opposite latitudinal diversity gradients, as do the heterotrophic planktonic foraminifera and radiolarians. By contrast, water depth may play a role in generating the W-shaped diversity gradient of the radiolaria, which mimics the latitudinal distribution of silica concentration at depths greater than about 200 m (Garcia et al. Reference Garcia, Locarnini, Boyer, Antonov, Baranova, Zweng, Reagan and Johnson2014).
In summary, our analyses show that both normal and reversed latitudinal diversity gradients can result from asymmetric geographic range expansion of newly formed species into different latitudes, an underappreciated but generally applicable mechanism. More broadly, our results suggest that latitudinal diversity gradients may ultimately originate from the effects of temperature on geographic range shifts rather than on speciation or extinction rates, a new perspective for understanding one of the fundamental patterns of the natural world.
Acknowledgments
This work was supported in part by a research fellowship to M.G.P. through the University of Hawaii–Mānoa. Steven Stanley, David Lazarus, Johan Renaudie, and two anonymous reviewers provided helpful comments on an earlier version of this article.
Supplementary Material
Data available from the Dryad Digital Repository: https://doi.org/10.5061/dryad.jh6h1