1. Introduction
Lower limb prostheses are artificial devices that are used to replace a lost limb and restore its motor function to the maximum possible. By focusing on ankle prostheses, most commercial models are inactive or passive (devices with passive spring [Reference Dao and Chau11, Reference Koehler-McNicholas, Slater, Koester, Nickel, Ferguson and Hansen29]). The mechanical legs of the passive prosthesis are controlled solely on a mechanical design (e.g., sliding-spring joints or hydraulic valves) by moving the user’s torso, pelvis and other limbs, and there is no external control input. A small share of the commercial market of artificial limbs or prostheses belongs to semi-active (microprocessor-controlled [10, Reference Ernst, Altenburg, Schmalz, Kannenberg and Bellmann16, Reference Lee, Mooney and Rouse32]) types. Semi-active prostheses often control the damping of the replaced joint by changing the viscosity of a smart fluid (such as magnetorheological or MR fluids) during the gait cycle [10]. Although these types of prostheses provide the person with the ability to walk, they still have a limited ability to help the amputee walk normally on smooth ground and especially uneven ground (such as stairs and slopes) because there is no substitute for the active behavior of body muscles in the prosthesis and there is no input driving power. In addition, it has been shown that compared to a healthy human, a person’s metabolic energy consumption increases significantly (more than 50%) and also the torque and power consumption of the thigh increase by about three times [Reference Zhang and Huang42]. Passive prosthetic devices can mimic the behavior of acentric or isometric (static contraction) muscle behavior (for example, by a damper). They can also cause elastic tendon-like behavior by a variety of springs. It is not possible to mimic the behavior of concentric muscle (introverted contraction) with a passive system. Creating such a capability can provide additional capabilities for a prosthetic system. Therefore, bringing the movements of the amputated person closer to a healthy person and resolving the problems and shortcomings of inactive and semi-active specimens are among the necessities that have been felt in recent years. The proposed alternative is active prostheses; a prosthesis that can also be fed from outside. In fact, the movement of the knee or ankle joint is provided and controlled using electrical or hydraulic-pneumatic systems.
The first step towards an active prosthesis was taken by Radcliffe in the form of an upper knee prosthesis in the late 1980s under the name AKP [Reference Radcliffe36]. This prosthesis uses an external power supply and control, as well as DC motor technology to move the knee joint. By using this system, the amputation energy of the amputated person is reduced and the maximum walking speed is also increased [Reference Popovic, Tomovic, Tepavac and Schwirtlich34]. In the last 25 years, only a few commercial systems have been able to provide active energy and torque to the prosthetic joint. The first commercially active leg is Proprio from Ossur [Reference Laferrier and Gailey30]. The latest revision of this prosthesis is called Proprio-Foot with Evo [13]. However, it is not considered to be a fully powered prosthesis because its active components are only used to position the ankle angle for larger swing leg clearance. It cannot provide any extra energy when the foot is in pushed off phase. A more advanced active below knee prosthesis with active ankle has been provided by iWalk [35]. They introduced BiOM as a replacement of the human ankle, which uses an elastic element and a motor to produce a behavior similar to the calf muscle [Reference Au and Herr3, Reference Au, Weber and Herr4]. The drive train and the implemented series spring together comprise a series elastic actuator called “SEA” which is the major design concept of this prosthesis. In this way, it is possible to generate power for the push of phase in normal walking. Latest revision of this prosthesis has successfully become commercially available for testing in recent years by iWalk LLC [Reference Eilenberg, Geyer and Herr14]. In the past decade, other research prostheses such as Sparky 1-3 [Reference Alzaydi, Cheung, Joshi and Wong1, Reference Bellman, Holgate and Sugar6, Reference Hitt, Sugar, Holgate and Bellman25], Cyberlegs based on the MACCEPA mechanism [Reference Flynn, Geeroms, Jimenez-Fabian, Vanderborght, Vitiello and Lefeber18, Reference Jimenez-Fabian, Geeroms, Flynn, Vanderborght and Lefeber27], active alignment prosthesis [Reference LaPrè, Umberger, Sup and Frank28], AMP Foot 1-3 [Reference Cherelle, Grosu, Flynn, Junius, Moltedo, Vanderborght and Lefeber7–Reference Cherelle, Matthys, Grosu, Vanderborght and Lefeber9], and pneumatically actuated transtibial prosthesis [Reference Zheng and Shen43, Reference Zheng and Shen44] have also been presented, which have their own strengths and weaknesses and all are developed for laboratory researches.
The performance of all introduced prostheses has been evaluated by making samples and performing some clinical tests and improved if needed [Reference Au and Herr3, Reference LaPrè, Umberger, Sup and Frank28]. In some researches, an independent laboratory setup has been developed to test the function of the designed and manufactured prosthesis so that a favorable evaluation of its function has been made before testing on amputee [Reference Bavarsad, Fakharian and Menhaj5]. Considering the importance of modeling in the study of kinematics and kinetics of human movement, it is also important to provide a suitable model for amputee walking. This model can be a powerful tool for analyzing the behavior of an amputee with a designed prosthesis before construction, which will greatly reduce the costs caused by possible trials and errors. In addition, modeling close to real human behavior has information about the behavior of other limbs of the body, which are either complex or very costly to investigate in reality and experimentally. Also, it is a suitable tool for the design of the controller in the manufacture of active prostheses. Therefore, providing a suitable model of human amputee movement is very useful and helpful. In one research [Reference Xu, Greenland, Bloswick, Zhao and Merryweather41], in order to modeling of the movement of an amputee with a passive below knee prosthesis, OpenSim software was used to investigate the effect of using springs and dampers in the ankle joint of the prosthesis on the forces acting on the knee of the amputated leg. In this model, in order to simulate the amputee gait with passive prosthesis, the muscles of the amputated leg have been removed and the mass and inertia characteristics of the remaining bone links have been set to be similar to the prosthesis. In a new research in 2018, Price et al. modeled the normal gait of an amputee with a passive prosthesis using OpenSim software [Reference LaPrè, Price, Wedge, Umberger and Sup31]. In this model, CAD of prosthesis is transferred into the OpenSim environment and added to the amputee walking model, which gives reasonable results. But, this modeling is done only in the normal gait with passive prosthesis, so there is no modeling of amputed gait with active prosthesis which is more important than passive ones because prototyping of an active prosthesis is more expensive than passive ones.
The main contribution of this research is to modeling of the amputee’s gait with the designed active prosthesis. In this research, an appropriate design of active transtibial prosthesis with maximum proximity to the lost limb of the disabled person is proposed. The anthropometric data of reference [Reference Winter40] are used in the design process in order to achieve the desired weight, inertia, and dimensional characteristics. With the aim of evaluating the kinematics and kinetics of the amputee’s gait with a designed prosthesis, a 7-link two-dimensional model is developed. This model offers the possibility of investigating the effect of different design parameters on the dynamic and kinematic characteristics of the amputee’s gait. Also, with the help of this model, it is possible to carry out suitable simulations for amputees with different weight and height specifications and update the prosthesis design before constructing expensive sample.
The rest of this paper is organized as follows: Section 1 describes the ankle active prosthesis design characteristics, and Section 3 explains overall design of prosthesis. In Section 4, prosthesis feasibility study and evaluation has been described, whereas Section 5 indicates total control system design and primary evaluation. Section 6 depicts the procedure for simulation of amputee gait with designed active prosthesis by the use of 2D 7-link inverse dynamic model. Simulation results and discussion are presented in Section 6, too. Finally, the conclusion is explained in Section 7.
Biomechanics of ankle joint in different subphases of normal gait.

2. Transtibial prosthesis design specifications
In order to design a transtibial (below knee) active prosthesis, it is necessary that the kinematic and kinetic characteristics of the amputee are available or, in the minimum situation, the limitation of the person’s movement parameters can be obtained and evaluated. For this purpose, in order to evaluate and compare the results, Winter’s data have been used in design procedure [Reference Winter40] (all data analysis including kinematic and kinetic calculations of gait and raw data filtering procedure are available in reference [Reference Barooji, Ohadi and Towhidkhah37]). Based on these data, the prosthesis is designed for a person with 56.7 kg weight and approximate height of 1.53 m (Table I). From [Reference Au and Herr3, Reference Au, Weber and Herr4, Reference Eilenberg, Geyer and Herr14, Reference Gates19, Reference Hatze23, Reference Herr and Grabowski24, Reference Palmer33], the stance phase of normal gait can be divided into three sub-phases: controlled plantar flexion (CP), controlled dorsiflexion (CD), and powered plantar flexion (PP). These phases of gait and position curve of ankle joint during one gait cycle are presented in Fig. 1. The detailed kinematics and kinetics of ankle joint can be seen in Fig. 2 curves. Also, the torque–angle curve as a main design index is also shown in Fig. 3.
Amputee and prosthesis design parameters.

Ankle kinematics and kinetics in normal gait.

Ankle torque versus angle during level ground walking including different sub-phases.

From the analysis of Figs. 1–3:
Ankle angle variates from −
 $20^\circ$
to +
$7^\circ$
.
Maximum ankle torque is 90.2 and maximum speed is below 40 rpm.
Instantaneous output power is a maximum of 200 W and the amount of energy consumed in a cycle is about 16 J.


One of the important challenges in designing this prosthesis is to obtain the stiffness or impedance of the ankle joint. For this purpose, the torque–angle curve of Fig. 3 and fitting the appropriate linear curve (linear regression) in different sub-phases of normal walking are used. The results obtained from linear regression of ankle torque-angle data are presented in Fig. 4.
Ankle different sub-phase stiffness estimation with linear regression.

The stiffness values obtained in different subphases of the gait are listed in Table II. In this table, the R-squaredFootnote
1
value is presented as an indicator of the accuracy of stiffness estimation for each of the subphases. In the best case, the regression model exactly match the observed values (gait data), which results in
 $R^2=1$
. Therefore, due to the less data of CP phase, the estimation accuracy has been reduced. In two other subphases CD and PP, a suitable linear estimation has been made. Also, the average stiffness value of the entire gait cycle cannot show the completely linear behavior and the error is high.
Stiffness estimation results of different subphases of gait.

In order to design of prosthesis series elastic actuator (SEA) structure, an approximate quasi-linear behavior of the entire gait cycle should be achieved. The normal human ankle behavior was broken down into a spring component and a torque source. The spring component was then piecewise linearized and its stiffness varies with the sign of the ankle angle. The torque source was modeled as a constant offset torque
 $\Delta \tau$
, which was applied to the ankle joint during PP phase. Figure 5 shows two different types of estimations where it is assumed that by changing the sign of the relative angle of the ankle, according to the design of the proposed prosthesis, the stiffness will be changed.
Ankle different quasi-linear impedance/stiffness estimation in one gait cycle.

Meanwhile, between the CD and PP phases, a constant instantaneous torque should be applied (
 $\Delta \tau$
), which practically estimates the net input torque of the push-off phase. Also, based on the results of previous researches [Reference Davis and DeLuca12, Reference Gates19, Reference Palmer33, Reference Shamaei, Sawicki and Dollar38], there is an offset stiffness (
 $k_{\text{offset}}$
) at different walking speeds that shows the passive behavior of the ankle joint. This stiffness is shown schematically with dash-dotted line in Fig. 5. The offset stiffness can be obtained by computing the average slope of the measured human ankle torque–angle curve of the human ankle during CD phase. Based on this analysis for both cases, the values of offset stiffness and push-off torque are equal to relation 1.
 \begin{equation} \begin{cases} \Delta \tau _g=45 \,\text{N.m}\\ \\[-8pt] k_{\text{offset}_g}=550 \,\text{N.m/rad} \end{cases}\!, \begin{cases} \Delta \tau _c=70\,\text{N.m}\\ \\[-8pt] k_{\text{offset}_c}=330 \,\text{N.m/rad} \end{cases} \end{equation}
in which subscript “g” denotes green line estimate and subscript “c” means crimson color linear estimated stiffness curve. Parameters
 $\Delta \tau$
and
 $k_{\text{offset}}$
are design targets, and selection of the most appropriate offset stiffness and torque estimation is based on the capability of the designed drive system of prosthesis, which will be discussed further. In addition, this approach has practically established the procedure of the control system of the designed active ankle prosthesis, which is described in Section 4. The ability of the actuator designed by SEA to produce sufficient and fast torque for different desired speeds is one of the most key topics in the design of actuators. The characteristic that shows this ability is the torque bandwidth. The torque bandwidth can be calculated based on the power spectrum of the ankle torque data for a single gait cycle. In this research, based on the results of ref. [Reference Au, Weber and Herr4], the torque bandwidth is determined in the frequency range that covers 70% of the total torque data power. Based on gait data analysis in ref. [Reference Barooji, Ohadi and Towhidkhah37], power spectrum of ankle torque in normal gait is plotted as in Fig. 6. According to this figure, cutoff frequency (
 $\omega _c$
) is 6 Hz and torque bandwidth (BW) is found to be about 3.5 Hz. This parameter will be evaluated after designing of prosthesis actuator in Section 3.
Power spectrum of ankle torque data for one cycle of normal gait.

3. Overall design of prosthesis
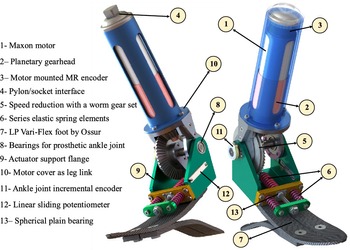
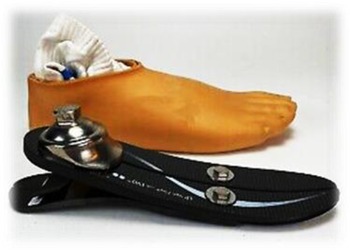
Based to the intended design objectives, the conceptual design of Fig. 7 for an active below-knee prosthesis is presented. According this design, an electric motor with a planetary gearbox will provide rotational motion to the ankle joint through a bevel gear reduction system. In this design, the flexible foot of Ossur company of Vari-Flex size 25 has been used. The reason for this choice is the predominance of this size among the various carbon fiber flex-foot sizes available (Fig. 8).
Schematic design of active below-knee prosthesis.

Ossur LP Vari-Flex carbon fiber foot with plastic cover.

The working principle of the drive system is shown schematically in Fig. 9. Accordingly, by creating motion in the electric motor and reducing it in the planetary gearhead, the pinion of the bevel gear system rotates. In order to create a series elastic behavior in the actuator, an arm is attached to a bevel gear on the ankle axis. The output gear (larger size) can rotate freely on the joint shaft. This gear rotates this arm and creates a linear motion through the compression springs so the springs applies torque to the foot link. For this reason, the power train treats as a series elastic actuator (SEA). A SEA is effectively a 2 degrees of freedom (DOF) actuator (the dynamic model is presented in Section 5.1), because even though the leg and foot links are both fixed, the springs are compressed by the rotation of the motor shaft and the large bevel gear. Of course, these spring deformations during gait are minimized by using springs with high stiffness, and they are used only due to absorption of walking shocks and also providing the possibility of measuring the ankle joint torque. Therefore, according to Fig. 9a, in the stance phase, the foot link is assumed to be fixed and with the rotation of the pinion of the bevel gear system (
 $\theta _{\text{in}}$
), the big bevel gear rotates (
 $\theta _{\text{se}}$
), and the series springs is deformed until the necessary output torque is created to rotate the leg (
 $\theta _{\text{out}}$
). In the swing phase, the leg link is assumed to be practically the same as the fixed ground, and because the inertia of the foot link is not so impressive, with minimal deformation of the series springs, the foot link rotates (
 $\theta _{\text{in}}$
) and movement is produced (Fig. 9b).
On the other hand, according to Fig. 3, in CD phase, more ankle stiffness/impedance is needed in the normal gait compared to CP. Therefore, the elastic elements used for different subphases should be different. For this purpose, the prosthesis is designed in such a way that two parallel compression springs engage in the CD phase and in the CP phase, only one compression spring will be active. So, assuming the springs are of the same size (equal stiffness and dimension), in CD phase joint stiffness will be twice of CP phase. After finalizing concept design of power train, it is needed to select an appropriate electric motor. Due to the optimization goals between cost and output torque-speed characteristics, Maxon DC RE40 is selected and its overall specifications are shown in Table III. This motor is 150 W and its important speed–torque characteristics are given in Eq. (2) [21]. All the parameters are defined in Table III.
 \begin{equation} \begin{cases} T_{\text{stall}}=2420 \,\text{mN.m}\\ \\[-10pt] \omega _{\text{nl}}=7580 \,\text{rpm} \end{cases}\!, \begin{cases} T_{\text{rm}}=177\, \text{mN.m}\\ \\[-10pt] \omega _{\text{rm}}=6940 \,\text{rpm} \end{cases} \end{equation}
Maxon 150W RE40 motor data [21].

This motor also has a 3-stage GP42C planetary gearbox mounted on the end. The specifications of this gearbox, which offers a 43:1 speed reduction [22], are shown in Table IV. According to this table, the maximum efficiency of this gearbox is 72%, and it can withstand a torque of 15 N.m continuously.
Maxon GP42C planetary gearhead data [22].

Schematic of prosthesis series elastic actuator working principle.

At the rear of the motor-gearbox, a 500-pulse L-type MR three-channel encoder is installed (Table V), which can provide the angular position of the engine up to a frequency of 200 kHz [20]. This encoder will be used to control the internal position loop of the motor.
Maxon L-type MR encoder data [20].

In order to achieve the control goals, it is necessary to measure the deformation of the springs of the SEA system along with the ankle joint angle. The Fenac [17] incremental rotary encoder (FNC35 with 2500 counts/turn) is used to measure the deformation of series springs. Also, in order to measure the relative angle of the ankle joint, a Bourns linear 10
 $\text{k}\Omega$
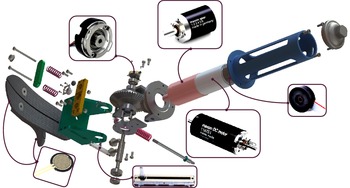
slide potentiometer [2] is used. In addition to these, two FSR [39] foot pressure sensors are used in the heel and under the toe of the Flex-foot of the prosthesis to detect the switch between different phases of gait. In Fig. 10, the installation drawing of all the main elements of the designed prosthesis is depicted in an exploded view.
Installation drawing and exploded view of the designed prosthesis.

Another requirement for running the electric motor and implementing the designed control system is choosing the right motor driver. In this research, Maxon EPOS2 driver [Reference Eppinger and Seering15] with digital and analog input capability with 24 VDC output voltage is used. This system is one of the best available drivers for position and torque control purposes. After choosing the main elements of the designed prosthesis, it is necessary to evaluate the fulfillment of the targeted specifications in order to ensure the correct function of the prosthesis before prototyping. In the continuation of the research, this evaluation is discussed.
4. Feasibility of designed prosthesis
It is now necessary that the designed prosthesis be slightly advanced in terms of detail design in order to meet the general specifications of the system.
-
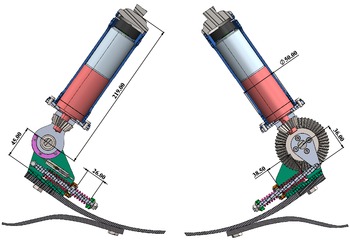
1. By choosing the dimensions of structural links as shown in Fig. 11, the height of the prosthetic ankle joint from the flex-foot floor is about 5 cm, which is similar to this distance for a healthy person in the same size (weight 60 kg and average height 160 cm). Also, total height of the prosthesis (without socket) is less than lost limb height (
$h_{\text{ll}}=36.7\,\text{cm}$
) and there is a need to use 6 cm height stainless steel pylon. -
2. According to Fig. 11, springs deflection (
$\Delta x$
) in the dorsiflexion phase is 25.3 mm and in the plantarflexion phase is 36.2 mm. Now using these two values, the angle range of the prosthesis ankle joint (
$\Delta \theta$
) is obtained from Eq. (3). Due to this relationship, the desired angle range of
$\pm 20^\circ$
(0.3 rad) will be satisfied.(3)where r is the moment arm of springs longitude force.
\begin{equation} \Delta x = r \Delta \theta ;\ \Delta \theta = \pm 0.3 \,\text{rad} \Rightarrow \Delta x = 36 \times 0.3 \cong \pm 11 \,\text{mm} \end{equation}
-
3. In addition to meeting the dimensional specifications and range of motion of the prosthetic joint, it is necessary to evaluate the ability of the system to satisfy the requirements of speed and torque. Assuming a 4:1 deceleration for the bevel gear set (
$n_b=4$
), the maximum speed and torque that the motor can provide under operating conditions can be calculated from the following equations. Based on Eq. (4), the total speed ratio (
$\text{V.R.}$
) of the actuator is 172 (
$n_p$
is planetary gearhead speed reduction ratio as mentioned in Table IV). Under operating conditions, by dividing the nominal speed (
$\omega _{\text{rm}}$
) by this value and multiplying it by the rated motor torque (
$T_{\text{rm}}$
) similar to Eq. (5), these values will be obtained at the ankle joint (
$T_{\text{ra}}$
and
$\omega _{\text{ra}}$
are rated torque and speed of ankle joint of prosthesis, respectively).(4)
\begin{equation} \text{V.R.} = n_p \times n_b = 43 \times 4 = 172 \end{equation}
(5)According to the obtained torques, the value of 31 N.m is much less than the required amount of maximum 120 N.m (max torque of target green line quasi-static stiffness estimation in Fig. 5). Of course, the nominal speed value is satisfied the goal joint speed. The important point in discussing torque is how fast the maximum torque is needed. Given the torque–velocity curve of the reference data shown in Fig. 12, this torque is required at almost zero velocity. Therefore, the motor torque can be equal to its maximum value (stall torque). In this case, the torque that the motor can supply to the joint is obtained from Eq. (6). In this calculation, the efficiency of 72% of the gearbox (Table IV) is also applied. Therefore, the amount of motor capacity is up to three times the required amount. However, it is assumed that maximum torque is required in a very short interval, which according to Fig. 2 lasts less than 0.1 s.
\begin{equation} \begin{cases} T_{\text{rm}}=177\, \text{mN.m}\\ \\[-8pt] \omega _{\text{rm}}=6940 \,\text{rpm} \end{cases} \!\!\!{\rightarrow} \begin{cases} T_{\text{ra}} = T_{\text{rm}} \times V.R. = 31 \,\text{N.m}\\ \\[-8pt] \omega _{\text{ra}} = \frac{\omega _{\text{rm}}}{\text{V.R.}} = 4 \,\text{rad/s} \end{cases} \end{equation}
(6)
\begin{equation} T_{\text{stall}} = 2.42 \,\text{N.m} \rightarrow T_a = 2.420 \times 172 \times 0.72 = 300 \,\text{N.m} \gt 120 \end{equation}
In which
$T_{\text{stall}}$
is stall torque of electric motor (Table III) and
$T_a$
indicates maximum torque of prosthesis ankle joint. -
4. Assuming the 6000 series T6 aluminum material for structural links and stainless steel for bevel gear set, the total weight of the prosthesis (excluding electronic components such as the control board) is about 2.3 kg which is less than targeted weight of lost limb (
$W_{ll}=2.6\,\textrm{kg}$
). -
5. The power required for the ankle joint based on the Fig. 2 during one cycle of the gait has an RMS value of below 40 W. It should be noted that, the maximum power is around 300 W. The power of the electric motor used in the nominal mode is 150 W, but this motor can provide up to 10 times of this nominal power in an instant, which is much higher than the required 300 W.
-
6. According to point 3 and the ability of the power train to withstand the torque up to 300 N.m, the amount of offset torque (
$\Delta \tau$
) and stiffness (
$k_{offset}$
) are assumed to be equal to 70 N.m and 330 N.m/rad (equation IV), respectively. This assumption provides more appropriate estimate of the ankle behavior in normal gait (Fig. 5).


The main dimensions and details of the prosthetic concept design.

Torque-speed curve of ankle joint for prosthetic design.

According to the evaluations are made, the designed prosthesis is generally desirable in terms of dimensional, kinematic, and kinetic characteristics. In the following, useful control system is designed and more detailed dynamic evaluations are made in the presence of the controller.
5. General control method and initial evaluations
In this research, with the aim of creating quasi-linear stiffness behavior in the prosthesis (Fig. 5), a two-layer control structure is used (Fig. 13). At the low level of control, three different types of torque, impedance, and position controllers are used according to the different subphases of gait. The high-level controller switches between these three controllers in different phases of the gait according to its conditions. This is done by a finite state machine. In the following, a simple view of the performance of each of the low-level controllers in their respective gait phases is discussed.
General control method (low and high level).

5.1. Torque control
A simple torque controller was designed to provide the required offset torque and create the quasi-linear stiffness behavior. First of all, the power train should satisfy the bandwidth constraint defined in Fig. 6. This prosthesis uses the force feedback with measuring the series spring deflection, to control the joint torque of the SEA. This control loop can be seen if Fig. 14. In this figure,
 $\tau _d$
is the desired reference torque,
 $\tau _s$
is the measured torque from spring’s deflection,
 $D(s)$
is the torque controller transfer function,
 $K_a$
is the motor amplifier (driver) coefficient,
 $i_m$
is the motor current,
 $V_m$
is the motor input voltage m and
 $k_s$
is the series spring stiffness.
Inner torque control.

There are two choices for this torque controller; PD and PID controller. The transfer function of these controllers is presented in relations (7)–(8).
 \begin{equation} C_{\text{PIDF}}=K_p+K_i \frac{1}{s}+K_d \frac{s}{T_f s+1} \end{equation}
 \begin{equation} C_{\text{PDF}}=K_p+K_d \frac{s}{T_f s+1} \end{equation}
where
 $K_p$
,
 $K_i$
, and
 $K_d$
are proportional, integrator, and damping gain of controller, respectively. Also, in order to remove the noise caused by the derivative (damping) used in the controller, as well as to improve the stability of the system in switching between different phases of the walking with a prosthesis [Reference Eppinger and Seering15], a large negative pole with a time constant of
 $T_f$
is used in both controllers.
Prosthesis simplified dynamic model.

In order to evaluation of designed torque controller, dynamic simplified model of prosthesis is needed. Figure 15 illustrates this simplified model. In this model,
 $T_m$
is the motor input torque,
 $J_m$
is the motor shaft inertia,
 $\theta _m$
is the motor rotor angle,
 $K_s$
is the equivalent torsional series stiffness,
 $\theta _1$
is the planetary gear head output angle,
 $\theta _2$
is the worm gear set output angle,
 $\theta _L$
is the ankle joint angle (load angle),
 $b_m$
is the motor rotor damping,
 $b_L$
is the joint damping, and
 $J_L$
is the external load inertia. The equations of motion are presented in Eqs. (9)–(10).
 \begin{equation} \begin{cases} J_m \ddot{\theta }_m + \dfrac{K_s}{n_p^2 n_b^2} \theta _m+b_m \dot{\theta }_m - \dfrac{K_s}{n_p n_b} \theta _L = T_m \\ \\[-8pt] J_L \ddot{\theta }_L - \dfrac{K_s}{n_p n_b} \theta _m + b_L \dot{\theta }_L + K_s \theta _L = 0 \end{cases}\!\!,\quad \theta _2 = \dfrac{\theta _m}{n_p n_b}, K_s = r^2 k_s\\ \end{equation}
 \begin{equation} \begin{bmatrix} J_m &\quad 0 \\ \\[-8pt] 0 &\quad J_L \\ \end{bmatrix} \begin{bmatrix} \ddot{\theta }_m \\ \\[-8pt] \ddot{\theta }_L \\ \end{bmatrix}+ \begin{bmatrix} b_m &\quad 0 \\ \\[-8pt] 0 &\quad b_L \\ \end{bmatrix} \begin{bmatrix} \dot{\theta }_m \\ \\[-8pt] \dot{\theta }_L \\ \end{bmatrix}+ \begin{bmatrix} \dfrac{K_s}{n_p^2 n_b^2} &\quad - \dfrac{K_s}{n_p n_b} \\ \\[-8pt] - \dfrac{K_s}{n_p n_b} &\quad K_s \\ \end{bmatrix} \begin{bmatrix} \theta _m \\ \\[-8pt] \theta _L \\ \end{bmatrix}= \begin{bmatrix} T_m \\ \\[-8pt] 0 \\ \end{bmatrix} \end{equation}
The general matrix form of the equations can be written as
 \begin{equation} \begin{split} \textbf{M} \boldsymbol{\ddot{\theta }}+\textbf{C} \boldsymbol{\dot{\theta }}+\textbf{K} \boldsymbol{\theta }=\textbf{F};\ \textbf{M}= \begin{bmatrix} J_m &\quad 0 \\ \\[-8pt] 0 &\quad J_L \\ \end{bmatrix},\ \textbf{C}= \begin{bmatrix} b_m &\quad 0 \\ \\[-8pt] 0 &\quad b_L \\ \end{bmatrix}\!,\ \ & \textbf{K}= \begin{bmatrix} \dfrac{K_s}{n_p^2 n_b^2} &\quad - \dfrac{K_s}{n_p n_b} \\ \\[-8pt] - \dfrac{K_s}{n_p n_b} &\quad K_s \\ \end{bmatrix}, \\ \\[-8pt] \textbf{F}= \begin{bmatrix} T_m \\ \\[-8pt] 0 \\ \end{bmatrix}, &\quad \boldsymbol{\theta }= \begin{bmatrix} \theta _m \\ \\[-8pt] \theta _L \\ \end{bmatrix} \end{split} \end{equation}
For the purpose of finding designed elastic actuator bandwidth, the model of fixed-end actuator is needed [Reference Eppinger and Seering15]. In this case, system will be similar to single forced mass-spring-damper model. By replacing of the parameters from Tables III and IV, and
 $K_s=380 \,\text{N.m/rad}$
, open-loop transfer function of the transferred load to the base can be written as below:
 \begin{equation} G_{\text{fixed}} = \frac{T_L}{T_m} = \frac{0.4098}{1.739 \times 10^{-5} s^2+0.01s+0.003903} \end{equation}
This system has two poles as in relation (13), where one is so close to imaginary axis and the another one is so large stable pole, so the open loop system treats as first-order plant.
 \begin{equation} p_1=-0.3905, p_2=-574.4922 \end{equation}
The step response and bode plot of open-loop system can be seen in Fig. 16. Based on this result, the open-loop system operates very slowly and also has DC gain.
In order to improve the transient and steady-state behavior of the system, two PD and PID controllers are designed, whose parameters are included in Table VI.
Designed PD and PID controller’s gains.

Bode plot and step response of original model of prosthesis.

The step response and bode diagram of the closed loop system are drawn in Figs. 17 and 18, respectively. According to these curves, despite the 15% overshoot, the PID controller provides a faster response and wider bandwidth (
 $bw_{pid}=22.6$
Hz, which is six times of the required value and suitable). While the bandwidth of the PD controller, which is similar to a proportional controller, is slightly more than 3.5 Hz, which is not desirable (
 $bw_{\text{pd}}=4.6 \,\text{Hz}$
).
PD and PID torque controller response.

PD and PID torque controller bode plot for bandwidth comparison.

5.2. Impedance controller
With the aim of modulating output impedance of the SEA (especially the joint stiffness), an impedance controller should be designed. This controller has two main components: (a) outer position feedback control loop, (b) inner force controller loop (Fig. 19). The outer impedance controller loop has been designed in the basis of the structure of the ‘Simple Impedance Control’ of Hogan [Reference Hogan and Buerger26]. The basic idea of this controller is to use the motion feedback from the ankle joint to enhance the joint impedance. The transfer function of desired output impedance of the is defined as follow:
 \begin{equation} Z(s)=\frac{\tau _d}{s\theta }=S_d+C_d \frac{s}{T_{fi} s+1}\\ \end{equation}
where
 $S_d$
,
 $C_d$
, and
 $T_{fi}$
are stiffness, damping, and noise cancelation parameters of simple PD impedance controller.
Impedance controller diagram.

The designed controller (
 $S_d=637.6$
,
 $C_d=3.86$
,
 $T_{fi}=0.001$
) is implied on closed-loop system, and step response is plotted in Fig. 20 and the answer is reasonable enough.
Impedance controller diagram.

5.3. Position controller
Since the behavior of the ankle in the swing phase is similar to a position control system, a standard proportional (
 $P$
) controller is designed for this purpose. The goal of this controller is to adjust the angle of the foot when landing on the ground or in another words, when the heel strikes with the ground. In this case, dynamic model of prosthetic foot acts as 2 DOF system as mentioned in Eq. (9). The block diagram of this controlled system is presented in Fig. 21. In order to find the proper gain of the controller, the step response of the system should be plotted. This response curve is plotted in Fig. 22 with controller parameter of
 $P=117.8$
and the answer is fast and robust.
Simulink model of swing phase P controller.

Step response of position controller.

5.4. High-level finite state controller
In recent years, finite state machine is used as a method of controlling locomotion devices and walking robots, because the nature of walking is a multiphase movement due to the change of steps during the gait. In this research, state machine is used for the two phases of stance and swing depending on the various low-level control structures. In the following, the details of the structure of this high-level control method are discussed.
5.4.1. Finite state control of the stance phase
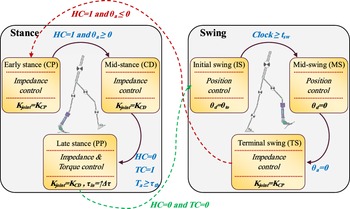
According to what was explained in section 2, the stationary phase has three different states CP, CD, and PP. Therefore, the following rules and regulations can be considered for these three situations (Fig. 23):
General scheme of the high-level finite state control system.

The CP state or early stance phase starts with heel-strike and continues until the angle of the ankle joint is positive. In this state, the controller must be able to adjust the ankle stiffness around
$K_{\text{CP}}$
so that the shock caused by the impact of the heel on the ground can be removed and the stability of walking can be maintained.The CD state or the middle stance phase starts with the positive angle of the ankle according with toe contact and continues until near the toe-off instant. In this state, the stiffness of the ankle is adjusted on the
$K_{\text{CD}}$
so that the body rotates smoothly without the risk of the person falling.If the total measured torque in the ankle joint exceeds the predefined
$\tau _{\text{th}}$
and only the toe is on the ground, the PP state starts. If the walking speed is such that the required torque does not reach this number (
$\tau _{\text{th}}$
), there is no need to apply the offset torque (
$\Delta \tau$
).


All the parameters of
 $K_{\text{CP}}$
,
 $K_{\text{CD}}$
, and
 $\tau_{\text{th}}$
are tuned based on experimental and clinical tests to produce the most suitable gait pattern.
5.4.2. Finite state control of the swing phase
The swing phase is also divided into three states, which are as follows:
The initial swing state starts from the toe-off instant and continues for a certain period of time (
$t_{\text{sw}}$
). In this state, the position controller maintains the position of the toe-off (
$\theta _{\text{to}}$
) for the ankle angle (
$\theta _a$
).The middle swing state should start immediately after the initial swing and continue until the angle of the foot becomes zero (
$\theta _d=0$
). In this case, the controller tries to provide the suitable angle of zero degrees for the foot.In the terminal swing state, which starts after the middle swing, the controller prepares the heel to strike with the ground. Therefore, ankle stiffness is adjusted to the
$K_{\text{CP}}$
, as there is not enough time to increase stiffness at the moment of heel strike in the early stance state.


In these cases, the parameters of
 $\theta _{\text{to}}$
and
 $t_{\text{sw}}$
can be adjusted according to the experimental tests.
The general process governing the state machine structure can be seen in Fig. 23. To recognition of the states and switch between them, it is necessary to provide four measurement characteristics:
-
1. Determining the event of the heel contact, which is determined by
$\text{HC} = 1$
. The FSR sensor under the heel makes this possible. -
2. It is necessary to detect the contact of the toe with the ground, which is characterized by
$\text{TC} = 1$
. The FSR sensor under the toe is used for this. -
3. The angle of the wrist joint, which is done with a built-in linear potentiometer (using a cable system to convert rotational movement into linear).
-
4. The torque of the ankle joint (
$T_{\text{ankle}}$
) should be measured, which can be calculated from the encoder on the ankle joint that can measure the deformation of the springs (the stiffness of the springs of SEA is also obtained experimentally).


With this finite state machine and low-level controllers, it is possible to create the desired gait of the amputee with the designed prosthesis.
In order to investigate the effect of prosthesis augmentation on the amputated person, it is necessary to use dynamic modeling, because before making the functional prototype, the only method for evaluating of designed system operation is only software simulation. Therefore, by using an inverse dynamic model, the effect of the designed active prosthesis on amputee gait will be carefully investigated.
6. Amputee gait simulation with dynamic modeling
In this section, first the dynamic model used is introduced and then the hypotheses used in the simulation of walking with a prosthesis will be explained. Then, by adding the parameters of the designed prosthesis on the presented model, a complete analysis of the kinetic behavior and energy consumption of the walking amputee will be done.
6.1. Sagittal plane link parameter model
The model chosen to simulate sagittal plane normal gait of amputee is a two-dimensional model in which each member is assumed to be a separate rigid link (Fig. 24). Since the aim of this study is to investigate the walking behavior of the amputee with active ankle prosthesis, modeling of the upper torso has been partially omitted. In this model, the main bones of the lower limbs are considered separately.
Amputee sagittal plane walking 7-link model with active prosthesis.

In order to achieve a suitable model, length of each link of the moving parts of the body, accurate measurement of the mass of the parts, the center of the masses, the centers of the joints, and the moment of inertia are required. Assumptions of modeling are as follows:
-
1. Flexible behavior of prosthesis foot is omitted.
-
2. Prosthesis shank and residual limb of amputee assumed to be rigidly connected.
-
3. Each member has constant point mass at its center of mass.
-
4. The location of the center of mass of each member (link) remains constant during motion (rigid body motion assumption).
-
5. The joints are considered as 2D hinges.
-
6. The moment of inertia of each link around its center of mass (or around any of the initial or terminal joints) is constant during motion.
-
7. The length of each piece is constant during the movement (for example, the distance between the joints remains constant).
This skeletal model includes the femur, tibia, and leg bones (calcaneus, tarsal, and metatarsal). In addition, the upper torso members are integrally modeled and includes the bones of the spine, chest, head, arms, and forearms.
In this modeling, the method used in [Reference Barooji, Ohadi and Towhidkhah37] is used to simulate human walking in seven links. In this study, human body is modeled with seven separate rigid links, including six complete lower limbs (including the prosthesis foot, prosthesis shank with amputee residual limb, right healthy shank, and two thighs) and a HAT link representing the head, arms, and trunk (Fig. 24). The number of moving joints is six, which includes two ankles, two knees, and two hip joints. The method of investigation at this stage is inverse dynamics; that is, in this modeling process, joint angles are assumed as input and kinetic parameters like joint torques as the system output is verified.
6.2. Modeling assumptions with active below-knee prosthesis
In order to make the analysis simple and justifiable, the following assumptions seem necessary:
-
1. The person wearing the prosthesis does not show any change in the kinematics of the gait, i.e. it is assumed that after wearing the prosthesis, the person tries to walk as if he were healthy. Therefore, it is expected that the power and energy consumption of other joints will increase.
-
2. The ground reaction force is assumed to be the same as before due to small changes in the total weight of the person.
-
3. Amputation occurred in only one leg (left).
-
4. Increasing the total mass of the leg and foot is about 0.5 kg by adding a prosthesis (battery with other electronic devices such as control boards, encoders, etc. are also considered effectively).
-
5. All the required simulation parameters such as mass and moment of inertia of the components are obtained from SolidWorks software. As an example, the moment of inertia of all moving parts of the prosthesis about ankle joint is available for the stance and swing phase in Table VII based on Fig. 25.
-
6. In order to reduce the complexity of modeling, the 7-link model mentioned in Fig. 24 is used in inverse dynamics.
Two rigid link of prosthesis for dynamic modeling.

Inertial moment of two prosthesis link relative to its center of mass.

The dynamic model considered for simulating the normal gait of an amputee is the inverse dynamic model presented by Rostami et al. in ref. [Reference Barooji, Ohadi and Towhidkhah37]. In this research, a 9-link model including toe joint was developed, and the accuracy of its results was confirmed with reliable sources. According to the assumptions made, the walking kinematics of an amputee should not be different from a healthy person. Therefore, all the kinematic results presented in ref. [Reference Barooji, Ohadi and Towhidkhah37] can be used and developed for amputees. In addition, all the anthropometric data of a healthy person have been assumed to be similar in this study, and only the inertial and weight parameters of the amputated leg are different compared to the healthy person. So, the effect of amputation will be on the individual’s kinetic characteristics.
The dynamic equations of the amputated person’s gait, with the same approach as the healthy person, are written only as an example for the foot of amputated leg and can be easily developed for other links of body.
Free diagram of the prosthesis foot link in the inverse dynamic model.

With the acceleration of the centers of mass of each components of the model, a complete analysis of the forces acting on the model can be performed using Newtonian equations. For the prosthesis foot, the free force diagram is drawn in Fig. 26. Since the amount of ground reaction force along with its position (COPx) is obtained from the force plate [Reference Barooji, Ohadi and Towhidkhah37], with two force and one moment equations, intermittent forces at the ankle joint with torque can be obtained as follows:
 \begin{equation} \begin{cases} \sum F_x = m a_x \rightarrow R_x+F_{Bx} = m_f a_{Gx} \\ \\[-8pt] \sum F_y = m a_y \rightarrow R_y+F_{By}-m_f g = m_f a_{Gy} \\ \\[-8pt] \sum M_G = \overline{I} \alpha \rightarrow T_a+R_y (COP_x-x_G) - F_{By} (x_G-x_B) + R_x y_G-F_{Bx} (y_B-y_G ) = \overline{I}_f \alpha \end{cases} \end{equation}
 \begin{equation} \left[\begin{array}{c@{\quad}c@{\quad}c} 1 & 0& 0 \\ \\[-8pt] 0 & 1& 0 \\ \\[-8pt] y_G-y_B& x_G-x_B& 1 \end{array}\right] \begin{bmatrix} F_{Bx} \\ \\[-8pt] F_{By} \\ \\[-8pt] T_a \\ \end{bmatrix} = \begin{bmatrix} m_f a_{Gx} - R_x \\ \\[-8pt] m_f a_{Gy} - R_y + m_f g \\ \\[-8pt] \overline{I}_f \alpha - R_x y_G - R_y (COP_x-x_G) \\ \end{bmatrix} \end{equation}
 \begin{align} \nonumber \\[-36pt] \begin{bmatrix} F_{Bx} \\ \\[-8pt] F_{By} \\ \\[-8pt] T_a \\ \end{bmatrix} = \left[\begin{array}{c@{\quad}c@{\quad}c} 1 & 0& 0 \\ \\[-8pt] 0 & 1& 0 \\ \\[-8pt] y_G-y_B& x_G-x_B& 1 \end{array}\right]^{-1} [A] \end{align}
 \begin{equation} A = \begin{bmatrix} m_f a_{Gx} - R_x \\ \\[-8pt] m_f a_{Gy} - R_y + m_f g \\ \\[-8pt] \overline{I}_f \alpha - R_x y_G - R_y (COP_x-x_G) \\ \end{bmatrix} \end{equation}
where
-
$F_x$
,
$F_y$
: reaction forces in x and y direction, respectively
-
$a_x$
,
$a_y$
: acceleration in x and y direction, respectively
-
$m$
: segment/link mass (prosthesis foot mass)
-
$M_G$
: reaction moment about center of gravity (COG)
-
$\overline{I}$
: link’s moment of inertia about its center of gravity
-
$\alpha$
: angular acceleration
-
$R_x$
,
$R_y$
: ground reaction forces
-
$F_{Bx}$
,
$F_{By}$
: prosthesis ankle joint reaction forces
-
$a_{Gx}$
,
$a_{Gy}$
: prosthesis foot COG acceleration
-
$m_f$
: prosthesis foot mass
-
$x_G$
,
$x_B$
,
$y_B$
,
$y_G$
: coordinates of prosthesis foot COG and ankle
-
$T_a$
: prosthesis ankle torque or reaction moment


Considering these assumptions, with a complete analysis of the gait in the case of a healthy person compared to the case of amputation, a detailed study of the functional effects of the prosthesis can be performed.
6.3. Simulation results
After changing the equations for the walking model of the amputee with a designed prosthesis, it is necessary to assume the changed inertial parameters similar to the previous healthy person in order to satisfy the correctness of the equations and same anthropometric parameters. In order to evaluate the correctness of the equations, the results related to the torque of the joints and their power consumption are shown in Figs. 27 and 28. As explained in ref. [Reference Barooji, Ohadi and Towhidkhah37], to calculate these torques, the recorded Winter’s data [Reference Winter40] of the gait (the position of the markers installed on different points of the active lower limbs in normal walking) are used. First, these raw data are filtered using a 2nd order Butterworth filter and using the kinematic equations, angular position, velocity and acceleration of ankle, knee and thigh joints for both legs are obtained. With replacing the inertial parameter in Eqs. (15)–(18) and expanding it to other active joints in the gait, reaction forces and input external torques/moments can be calculated in comparison with Winter’s results from reference [Reference Winter40].
Torque of the ankle, knee, and hip joints in comparison with Winter results.

Torque of the ankle, knee, and hip joints in comparison with Winter results.

The input power is also calculated from the multiplier of the speed and torque of each joint and is shown in Fig. 28. In order to check the results error, Fig. 29 is presented for the power and torque of all three joints. The most observed error in the calculated torques and powers is related to the initial data, which is caused by the finite difference error used in the numerical differentiation to calculate the velocity and acceleration of the limbs. Also, the error increases in the peak points of the torque and acceleration curves, which is also caused by the data filtering error [Reference Barooji, Ohadi and Towhidkhah37]. By calculating the RMS (root mean square) of the errors for the obtained torque and power for all three joints, it is evident that the error is negligible (Table VIII). Since the study focused on a single cycle of the gait and the available data of Winter is for more than one cycle, the initial and last data in the simulation of the gait with the designed prosthesis are omitted and only the data between the first heel-strike (
 $t_{hs1}=0.386 \,\text{s}$
) to the next heel-strike (
 $t_{hs2}=1.358 \,\text{s}$
) instant of a same leg are used.
RMS data of joint’s calculated torque and power error.

Error curves of calculated torque and power of ankle, knee, and hip joint in one gait cycle.

After feeling confidence from equations correctness, taking into account the assumptions of Section 6.2, the parameters of the designed prosthesis are added on one of the legs and the simulation is performed in a gait cycle. The torque and power curve of the knee and thigh joints of the amputed limb in comparison with the healthy person is shown in Figs. 30 and 31. In these figures, the time of swing phase initialization is noted with data marker. This time is
 $t_{ss}=0.987 \,\text{s}$
. Also, the extremum points in swing phase are depicted with data marker for clear visualization of difference between curves.
Amputee hip and knee joint’s torque in comparison with healthy situation.

Amputee hip and knee joint’s power consumption in comparison with healthy situation.

According to Fig. 30, at the extreme points of the knee and thigh torque curve, 25% and 20% increase in torque can be seen, respectively, and no such effect can be seen in the stance phase.
Also, by observing the comparison made in Fig. 31, the power consumption in the swing phase shows a change of 20% in the extreme points, which in fact indicates an increase in power consumption in the normal walking with a prosthesis.
7. Conclusion
In this study, an active prosthesis with reasonable weight and dimensions is designed in accordance with the presumed amputee and was evaluated and analyzed in full detail. In this prosthesis, a feasible and compact rotational SEA was designed in order to empower artificial joint of ankle. Joint range of motion, maximum and continues time torque, and velocity are in accordance with lost limb. In the following, a suitable control system was designed and initially evaluated with the aim of simulating the quasi-linear behavior of ankle stiffness. Two-level control system is designed based on human neural control system working procedure. In stance phase, impedance control (PD controller) in conjunction with torque control (PID controller) is designed and implemented. For swing phase, simple position control system (PD controller) is designed in order to adjust foot angle in heel strike instant. Also, actuator bandwidth was enhanced by PID torque controller up to 24 Hz which is so compatible with normal gait. By completing the design and considering all the components and parts of the prosthesis, finally, 0.5 kg of overweight for the prosthesis was obtained compared to the healthy foot. By placing the prosthesis inertial parameters on a relatively complex but comprehensive 2D 7-link inverse dynamic model of gait, the torque and power of other active joints in the normal gait (knee and thigh of amputated leg) compared to a healthy leg were analyzed and increased by nearly 20% in maximum power and torque of the swing phase. According to the results, no significant change was observed on these kinetic characteristics in the stance phase, which is in accordance with physical experiences. The model developed in this research can clearly be used in the design of different concepts of active prostheses before prototyping to minimize the trial and error costs caused by the real performance experiments and clinical tests.
Acknowledgements
This research was partially supported by Iran National Science Foundation (INSF). We thank our colleagues from INSF who provided insight and expertise that greatly assisted the research.
Author contributions
H. Rostami developed the design of prosthesis, performed the analytic calculations, and performed the numerical simulations. Both A. Ohadi and F. Towhidkhah authors supervised the project. All authors reviewed the results and approved the final version of the manuscript.
Financial support
This research received no specific grant from any funding agency, commercial, or not-for-profit sectors.
Conflicts of interest
The authors declare that they have no known competing financial interests or personal relationships that could have appeared to influence the work reported in this paper.
Availability of data
Winter’s gait data in excel form is available at “Dustyn Robots” website.
Code availability
The code used for the simulation can be provided via email if required.
Ethical approval
Not applicable.