
1. Introduction
Fluid flow separation is generally regarded as fluid detachment from a no-slip boundary. It is the root cause of several complex flow phenomena, such as vortex formation, wake flow and stall, which typically reduce engineering flow devices’ performance. For a recent survey of existing literature, we refer to (Melius, Cal & Mulleners Reference Melius, Cal and Mulleners2016; Melius, Mulleners & Cal Reference Melius, Mulleners and Cal2018; Serra, Vétel & Haller Reference Serra, Vétel and Haller2018; Le Fouest, Deparday & Mulleners Reference Le Fouest, Deparday and Mulleners2021; Deparday et al. Reference Deparday, He, Eldredge, Mulleners and Williams2022; Sudharsan, Ganapathysubramanian & Sharma Reference Sudharsan, Ganapathysubramanian and Sharma2022) and references therein, which include (Prandtl Reference Prandtl1904; Sears & Telionis Reference Sears and Telionis1971, Reference Sears and Telionis1975; Liu & Wan Reference Liu and Wan1985; Haller Reference Haller2004; Surana et al. Reference Surana, Jacobs, Grunberg and Haller2008; Wu, Ma & Zhou Reference Wu, Ma and Zhou2015). Three-dimensional (3-D) flow separation is challenging to analyse and visualize, and it has been subject to numerous studies since the mid-1950s. Inspired by dynamical systems studies by Poincaré, Legendre (Reference Legendre1956); Délery (Reference Délery2001) and Lighthill (Reference Lighthill1963) pioneered 3-D flow separation research. Several methods followed after these seminal works (Tobak & Peake Reference Tobak and Peake1982; Simpson Reference Simpson1996; Wu et al. Reference Wu, Tramel, Zhu and Yin2000). Years later, Haller and co-workers (Surana, Grunberg & Haller Reference Surana, Grunberg and Haller2006; Jacobs et al. Reference Jacobs, Surana, Peacock and Haller2007; Surana, Jacobs & Haller Reference Surana, Jacobs and Haller2007; Surana et al. Reference Surana, Jacobs, Grunberg and Haller2008) derived an exact theory of asymptotic 3-D separation in steady flows and unsteady flows with an asymptotic mean.
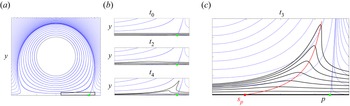
Existing techniques invariably focus on the longer-term particle dynamics, as opposed to the appearance of separation triggered by the formation of a material spike, i.e. a sharp-shaped set of fluid particles ejected from the wall. Several of these techniques rely on the notion of Lagrangian coherent structures (Haller Reference Haller2015) and their applications (Green, Rowley & Haller Reference Green, Rowley and Haller2007; Wilson, Tutkun & Cal Reference Wilson, Tutkun and Cal2013). However, the long-term behaviour in material deformation and transport is significantly different from the short-term one, which is the most relevant for early flow separation detection and control. To illustrate the difference between short-term material spikes and longer-term material ejection, figure 1(a,b) shows the evolution of material lines initially close to the wall in a steady 2-D flow analysed in detail in Serra et al. (Reference Serra, Vétel and Haller2018). While fluid particles released within the black box in (a) approach asymptotically the singular streamline (unstable manifold) emanating from the Prandtl point  $p$, the birth of a material spike takes place at a different upstream location. Serra et al. (Reference Serra, Vétel and Haller2018) derived a theoretical framework to identify such a location, named the spiking point
 $s_p$, as well as the backbone of separation (red curve) that acts as the centrepiece of the forming spike (cf. figure 1(c) and supplementary movie 1 available at https://doi.org/10.1017/jfm.2023.559) for general unsteady 2-D flows. This recent technique has proven successful in identifying the onset of flow separation in highly unsteady planar flows (Serra et al. Reference Serra, Crouzat, Simon, Vétel and Haller2020) including the flow over a wing profile at moderate Reynolds number (Klose, Serra & Jacobs Reference Klose, Serra and Jacobs2020b).
(a) Streamlines of a steady 2-D flow analysed in detail in Serra et al. (Reference Serra, Vétel and Haller2018). The green dot represents the zero skin friction or Prandtl separation point. (b) Zoom of (a) in the region enclosed by the bottom right rectangle, along with the evolution of the spike visualized through the advection of material lines shown in black. (c) Backbone of separation (red curve) as defined in Serra et al. (Reference Serra, Vétel and Haller2018), along with the streamlines (blue), and material lines initially parallel to the wall (black). The red dot marks the spiking point, where the backbone connects to the wall. The time evolution of the material spike is in supplementary movie 1.

Identifying separating structures is arguably a necessary first step in the design of flow control mechanisms (Greenblatt & Wygnanski Reference Greenblatt and Wygnanski2000; You & Moin Reference You and Moin2008) that can mitigate the upwelling and breakaway from walls. Common control strategies target the asymptotic separation structures either passively (Schlichting & Gersten Reference Schlichting and Gersten2000) or actively (Cattafesta & Sheplak Reference Cattafesta and Sheplak2011). Recent efforts include optimal flow control using dynamic modes decomposition (Hemati et al. Reference Hemati, Deem, Williams, Rowley and Cattafesta2016; Taira et al. Reference Taira, Brunton, Dawson, Rowley, Colonius, McKeon, Schmidt, Gordeyev, Theofilis and Ukeiley2017) and resolvent analysis (Yeh & Taira Reference Yeh and Taira2019). None of these studies, however, explicitly control spiking, and most importantly, they target Prandtl's definition of separation. Using the asymptotic separation criterion from Haller (Reference Haller2004), Kamphuis et al. (Reference Kamphuis, Jacobs, Chen, Spedding and Hoeijmakers2018) showed that a pulsed actuation upstream of Haller's separation criterion reduces drag. Interestingly, Bhattacharjee et al. (Reference Bhattacharjee, Klose, Jacobs and Hemati2020) showed that the optimal actuator place to mitigate separation is upstream of the asymptotic separation point on an airfoil, consistent with the spiking point location (Klose et al. Reference Klose, Serra and Jacobs2020b). A 3-D theory to locate and control the material spike formation universally observed in separation experiments is still missing.
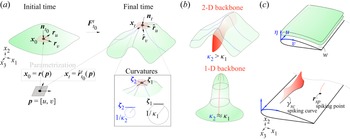
Building on Serra et al. (Reference Serra, Vétel and Haller2018), here, we propose a frame-invariant theory that identifies the origin of spike formation over a no-slip boundary in 3-D flows with arbitrary time dependence. Our technique identifies the Lagrangian centrepieces – or backbone lines and surfaces (figure 2b,c) – of separation and is also effective over short times, which are inaccessible by previous methods. Our theory is based on explicit formulas for the Lagrangian evolution of the largest principal curvature of material surfaces. The emergence of the largest principal curvature maxima (or ridge) near the boundary locates the onset of spike formation, its dimension (1-D or 2-D backbones, cf. figure 2b,c) and type. Specifically, we speak of fixed separation if the ridge emanates from the wall. Otherwise, it is a moving separation. For fixed separation, our theory discovers previously undocumented spiking points  $\boldsymbol {r}_{sp}$ and spiking curves
 $\gamma _{sc}$, which are distinct locations where the 1-D and 2-D backbones connect to the wall. We provide explicit formulas for the spiking points and curves using wall-based quantities. Remarkably, the spiking points and curves remain hidden from classic skin-friction line plots even in steady flows, consistent with the 2-D case (figure 1).
(a) We denote the initial position of a 2-D material surface in a 3-D space by  $\mathcal {M}(t_0)$. Points on the surface have coordinates
 $\boldsymbol {r}(\,\boldsymbol {p})$, where
 $\boldsymbol {p}$ contains the two independent parameters. At later times, points on the material surface
 $\mathcal {M}(t) =\boldsymbol {F}_{t_0}^{t} (\mathcal {M}(t_0))$ have coordinates
 $\hat {\boldsymbol {r}}_{t_0}^{t}(\,\boldsymbol {p})$. At each point
 $\boldsymbol {r}(\,\boldsymbol {p})$ of
 $\mathcal {M}(t)$,
 $\hat {\boldsymbol {r}}_u, \hat {\boldsymbol {r}}_v$ are basis vectors for the local tangent space,
 $\boldsymbol {n}_t$ is the local normal vector,
 $\kappa _1$ and
 $\kappa _2$ are the principal curvatures and
 $\boldsymbol {\zeta }_1$ and
 $\boldsymbol {\zeta }_2$ are the principal curvature directions (inset). (b) Sketch of possible separating spikes in 3-D flows from a no-slip boundary: 2-D backbone where
 $\kappa _2>\kappa _1$ or a 1-D backbone where
 $\kappa _2 \approx \kappa _1$. (c) We define a coordinate system with
 $[u,v]$ parameterizing the no-slip boundary
 $\mathcal {W}$ and
 $\eta$ the coordinate normal to the boundary. We define a spiking curve
 $\gamma _{sc}$ and spiking point
 $\boldsymbol {r}_{sp}$, as the intersection – when present – of the 2-D backbone and 1-D backbone to the no-slip boundary.

This paper is organized as follows. We first develop our theoretical results in §§ 2–5. Then we give an algorithmic summary of our theory in § 6. In § 7, we illustrate our results on several examples, including steady and unsteady velocity fields that generate different flow separation structures over no-slip boundaries.
2. Set-up and notation
We consider a 3-D unsteady smooth velocity field  $\boldsymbol {f}(\boldsymbol {x},t)$ on a 3-D domain
 $U$, whose trajectories satisfy
 \begin{align} \dot{\boldsymbol{x}}(t) = \boldsymbol{f}(\boldsymbol{x},t), \quad \boldsymbol{f}= [f_1,f_2,f_3]^\top, \quad \boldsymbol{x}=[x_1,x_2,x_3]^{\top} \in U \subset \mathbb{R}^3, \quad \boldsymbol{x}(t=0) = \boldsymbol{x}_0. \end{align}
We recall the customary velocity Jacobian decomposition
 \begin{equation} \boldsymbol{\nabla} \boldsymbol{f}(\boldsymbol{x},t) = \boldsymbol{S}(\boldsymbol{x},t) + \boldsymbol{\varOmega}(\boldsymbol{x},t),\quad \boldsymbol{S} = \tfrac{1}{2}(\boldsymbol{\nabla} \boldsymbol{f} +\boldsymbol{\nabla} \boldsymbol{f}^{\top}),\end{equation}
where  $\boldsymbol {S}$ and
 $\boldsymbol {\varOmega }$ denote the rate-of-strain and spin tensors. Trajectories
 $\boldsymbol {x}(t; t_0, \boldsymbol {x}_0)$ of (2.1a–d) define the flow map
 $\boldsymbol {F}_{t_0}^{t} (\boldsymbol {x_0})$ and the corresponding right Cauchy–Green strain tensor
 $\boldsymbol {C}_{t_0}^{t}(\boldsymbol {x_0})$ that can be computed as
 \begin{equation} \boldsymbol{F}_{t_0}^{t} (\boldsymbol{x_0}) = \boldsymbol{x_0} + \int_{t_{0}}^t \boldsymbol{f}(\boldsymbol{F}_{t_0}^{\tau}(\boldsymbol{x_0}),\tau)\, {\rm d} \tau,\quad \boldsymbol{C}_{t_0}^{t} (\boldsymbol{x_0}) = [\nabla_{\boldsymbol{x_0}} \boldsymbol{F}_{t_0}^{t} (\boldsymbol{x_0})]^{\top} \nabla_{\boldsymbol{x_0}} \boldsymbol{F}_{t_0}^{t} (\boldsymbol{x_0}). \end{equation}
Here,  $\boldsymbol {F}_{t_0}^{t} (\boldsymbol {x}_0)$ maps an initial condition
 $\boldsymbol {x}_0$ at time
 $t_0$ to its position
 $\boldsymbol {x}_t$ at time
 $t$, and
 $\boldsymbol {C}_{t_0}^{t}(\boldsymbol {x_0})$ encodes Lagrangian stretching and shearing deformations of an infinitesimal material volume in the neighbourhood of
 $\boldsymbol {x_0}$.
3. Curvature evolution of a material surface
To derive explicit formulas for the curvature evolution of a 2-D material surface  $\mathcal {M}(t)$, we define the following parametrization (figure 2):
 \begin{align} \left.\begin{array}{c@{}}
\mathcal{M}(t_0) = \{\boldsymbol{x_0}\in U:
\boldsymbol{x_0} =\boldsymbol{r}(\,\boldsymbol{p}),
\boldsymbol{p}=[u,v]^{\top}\in V =
[u_1,u_2]\times[v_1,v_2]\subset \mathbb{R}^2\},\\
\mathcal{M}(t) = \boldsymbol{F}_{t_0}^{t}
(\mathcal{M}(t_0))= \{\boldsymbol{x_t}\in U:
\boldsymbol{x_t} =
\hat{\boldsymbol{r}}_{t_0}^{t}(\,\boldsymbol{p}) =
\boldsymbol{F}_{t_0}^{t}
(\boldsymbol{r}(\,\boldsymbol{p})), \boldsymbol{p}\in V\}.
\end{array}\right\} \end{align}
In other words,  $\boldsymbol {p}$ contains the two independent variables that uniquely specify an initial point of the material surface
 $\boldsymbol {r}(\,\boldsymbol {p})$. The coordinates of this point at time
 $t$, are given by
 $\boldsymbol {F}_{t_0}^{t} (\boldsymbol {r}(\,\boldsymbol {p}))$, or alternatively, in compact notation, by
 $\hat {\boldsymbol {r}}_{t_0}^{t}(\,\boldsymbol {p})$.
At each point  $\hat {\boldsymbol {r}}_{t_0}^{t}(\,\boldsymbol {p})$ on the surface, the vectors
 $\partial _u \hat {\boldsymbol {r}}_{t_0}^{t}, \partial _v \hat {\boldsymbol {r}}_{t_0}^{t}$ define a basis for the local tangent space at
 $\hat {\boldsymbol {r}}_{t_0}^{t}(\,\boldsymbol {p})$. For compactness, we will denote these vectors
 $\boldsymbol {r}_u,\boldsymbol {r}_v$ at
 $t_0$ and
 $\hat {\boldsymbol {r}}_u, \hat {\boldsymbol {r}}_v$ at
 $t$. We can now compute a local basis for the local tangent and normal spaces at
 $\hat {\boldsymbol {r}}_{t_0}^{t}(\,\boldsymbol {p})$ as
 \begin{equation} \hat{\boldsymbol{r}}_{u} = \nabla_{\boldsymbol{x_0}}\boldsymbol{F}_{t_0}^{t}(\boldsymbol{r} (\,\boldsymbol{p}))\boldsymbol{r}_{u},\quad \hat{\boldsymbol{r}}_{v} = \nabla_{\boldsymbol{x_0}}\boldsymbol{F}_{t_0}^{t} (\boldsymbol{r}(\,\boldsymbol{p}))\boldsymbol{r}_{v},\quad \boldsymbol{n}_t =\hat{\boldsymbol{r}}_u \times \hat{\boldsymbol{r}}_v/\vert \hat{\boldsymbol{r}}_u \times \hat{\boldsymbol{r}}_v \vert,\end{equation}
where  $\times, \vert ({\cdot }) \vert$ denote the cross-product and the vector norm, and
 $\boldsymbol {n}_t$ the unit vector normal to the surface.
The Weingarten map quantifies the surface curvature in different directions, and can be computed as  $\boldsymbol {W}_{t_0}^t(\,\boldsymbol {p}) =({}_1\boldsymbol {\varGamma }_{t_0}^t(\,\boldsymbol {p}))^{-1}{}_2 \boldsymbol {\varGamma }_{t_0}^t(\,\boldsymbol {p})$, where
 ${}_1\boldsymbol {\varGamma }$ and
 ${}_2\boldsymbol {\varGamma }$ are the first and second fundamental forms (e.g. Kuhnel & Hunt (Reference Kuhnel and Hunt2015) and Appendix A). The eigenvalues
 ${}_{2}k_{t_0}^t (\,\boldsymbol {p})\geq {}_{1}k_{t_0}^t (\,\boldsymbol {p})$ of
 $\boldsymbol {W}_{t_0}^t(\,\boldsymbol {p})$ characterize the principal curvatures at
 $\hat {\boldsymbol {r}}_{t_0}^{t}(\,\boldsymbol {p})$ along the corresponding principal curvature directions
 $\boldsymbol {\zeta _1}$ and
 $\boldsymbol {\zeta _2}$, identified by the eigenvectors of
 $\boldsymbol {W}$ (figure 2a). As a result, the time evolution of
 $\boldsymbol {W}$ fully characterizes the curvatures of
 $\mathcal {M}(t)$. The Weingarten map of
 $\mathcal {M}(t_0)$ is
 $\boldsymbol {W}_{t_0} = \boldsymbol {W}_{t_0}^{t_0}(\,\boldsymbol {p})$ and can be computed as
 \begin{equation} \left.
\begin{array}{c@{}} \boldsymbol{W}_{t_0} =
({}_1\boldsymbol{\varGamma}_{t_0}(\,\boldsymbol{p}))^{-1}{}_2
\boldsymbol{\varGamma}_{t_0}(\,\boldsymbol{p}), \quad
{}_1\boldsymbol{\varGamma}_{t_0}(\,\boldsymbol{p}) =
\left(\begin{matrix}
\langle\boldsymbol{r}_u,\boldsymbol{r}_u\rangle &
\langle\boldsymbol{r}_u,\boldsymbol{r}_v\rangle\\
\langle\boldsymbol{r}_v,\boldsymbol{r}_u\rangle &
\langle\boldsymbol{r}_v,\boldsymbol{r}_v\rangle
\end{matrix}\right),\\
{}_2\boldsymbol{\varGamma}_{t_0}(\,\boldsymbol{p}) =
\left(\begin{matrix}
\langle\boldsymbol{n}_{t_0},\boldsymbol{r}_{uu}\rangle &
\langle\boldsymbol{n}_{t_0},\boldsymbol{r}_{uv}\rangle\\
\langle\boldsymbol{n}_{t_0},\boldsymbol{r}_{vu}\rangle &
\langle\boldsymbol{n}_{t_0},\boldsymbol{r}_{vv}\rangle
\end{matrix}\right)
\end{array}\right\},\end{equation}
with  $\langle,\rangle$ denoting the dot product and
 $\boldsymbol {r}_{uv} = \partial _{uv} \boldsymbol {r}$. To understand how a velocity field (2.1a–d) folds a material surface, we derive the exact map and the underlying matrix differential equation for
 $\boldsymbol {W}_{t_0}^t(\,\boldsymbol {p})$, as summarized in the following theorem.
Theorem 1 Consider a smooth material surface  $\mathcal {M}(t) \subset U \subseteq \mathbb {R}^3$ parametrized at
 $t_0$ in the form
 $\boldsymbol {r}(\,\boldsymbol {p})$,
 $\boldsymbol {p}=[u,v]^{\top }\in [u_1,u_2]\times [v_1,v_2]=V\subset \mathbb {R}^2$, and whose tangent space is spanned by
 $\boldsymbol {r}_u(\,\boldsymbol {p})$ and
 $\boldsymbol {r}_v(\,\boldsymbol {p})$. The evolution of the Weingarten map
 $\boldsymbol {W}_{t_0}^t(\,\boldsymbol {p})$ of
 $\mathcal {M}(t)$ under the action of the flow map can be computed as
 \begin{equation} \boldsymbol{W}_{t_0}^t(\,\boldsymbol{p})= \underbrace{({}_1\boldsymbol{\varGamma}_{t_0}^{t} (\,\boldsymbol{p}))^{-1}{}_1\boldsymbol{\varGamma}_{t_0}(\,\boldsymbol{p}) \frac{J_{t_0}(\,\boldsymbol{p}) {\rm det}(\boldsymbol{\nabla}\boldsymbol{F}^t_{t_0} (\boldsymbol{r}(\,\boldsymbol{p})))}{J_{t_0}^{t}(\,\boldsymbol{p})} \boldsymbol{W}_{t_0}}_{\boldsymbol{W}_I}+\underbrace{{({}_{1} \boldsymbol{\varGamma}_{t_0}^t}(\,\boldsymbol{p}))^{-1} \boldsymbol{B}_{t_0}^{t}(\,\boldsymbol{p})}_{\boldsymbol{W}_{II}}, \end{equation}
where
 \begin{equation} \boldsymbol{B}_{t_0}^{t}(\,\boldsymbol{p}) = \left(\begin{matrix} \langle\boldsymbol{n}_t,{\nabla}^2\boldsymbol{F}^t_{t_0} (\boldsymbol{r}(\,\boldsymbol{p}))\boldsymbol{r}_u\boldsymbol{r}_u\rangle & \langle\boldsymbol{n}_t,{\nabla}^2\boldsymbol{F}^t_{t_0} (\boldsymbol{r}(\,\boldsymbol{p}))\boldsymbol{r}_u\boldsymbol{r}_v\rangle\\ \langle\boldsymbol{n}_t,{\nabla}^2\boldsymbol{F}^t_{t_0} (\boldsymbol{r}(\,\boldsymbol{p}))\boldsymbol{r}_v\boldsymbol{r}_u\rangle & \langle\boldsymbol{n}_t,{\nabla}^2\boldsymbol{F}^t_{t_0} (\boldsymbol{r}(\,\boldsymbol{p}))\boldsymbol{r}_v\boldsymbol{r}_v\rangle \end{matrix}\right), \end{equation}
where  ${[{\nabla }^2\boldsymbol {F}^t_{t_0}(\boldsymbol {r} (\,\boldsymbol {p})\boldsymbol {r}_u\boldsymbol {r}_v]_i = [{\nabla }^2\boldsymbol {F}^t_{t_0}(\boldsymbol {r}) \boldsymbol {r}_{u}]_{ij} [\boldsymbol {r}_{v}]_{j}= \langle \boldsymbol {\nabla }[\boldsymbol {\nabla }\boldsymbol {F}^t_{t_0} (\boldsymbol {r})]_{ij},\boldsymbol {r}_{u}\rangle [\boldsymbol {r}_{v}]_{j}}$,
 $J_{t_0}^{t}(\,\boldsymbol {p}) = \sqrt { {\rm det}({}_{1}\boldsymbol {\varGamma }_{t_0}^t(\,\boldsymbol {p}))}$ and
 $J_{t_0}(\,\boldsymbol {p}) = \sqrt { {\rm det}({}_{1}\boldsymbol {\varGamma }_{t_0}(\,\boldsymbol {p}))}$. Here
 $[{\nabla }^2\boldsymbol {F}^t_{t_0}(\boldsymbol {r})\boldsymbol {r}_{u}]_{ij}$ represents the directional derivatives of
 $[\boldsymbol {\nabla }\boldsymbol {F}^t_{t_0}(\boldsymbol {r})]_{ij}$ in the direction
 $\boldsymbol {r}_{u}$. We use the same notation in (3.8) and (3.9). The rate of change of the Weingarten map at
 $t_0$ is given by
 \begin{align} \displaystyle{\dot{\boldsymbol{W}}_{t_0}(\,\boldsymbol{p})}&= \underbrace{\displaystyle{\left[\left( \boldsymbol{\nabla} \boldsymbol{\cdot}\boldsymbol{f}(\boldsymbol{r}(\,\boldsymbol{p}),t_0)- \frac{3\alpha_{t_0}(\,\boldsymbol{p})}{J_{t_0}^2(\,\boldsymbol{p})}\right) \boldsymbol{I}+\frac{2\boldsymbol{D}(\boldsymbol{p},t_0){}_1 \boldsymbol{\varGamma}_{t_0}(\,\boldsymbol{p})}{J_{t_0}^2(\,\boldsymbol{p})} \right]\boldsymbol{W}_{t_0}}}_{\dot{\boldsymbol{W}}_{I}}\nonumber\\ &\quad +\underbrace{\displaystyle{({}_1\boldsymbol{\varGamma}_{t_0} (\,\boldsymbol{p}))^{-1}\boldsymbol{M}(\boldsymbol{p},t_0)}}_{{\dot{\boldsymbol{W}}_{II}}} +\underbrace{\displaystyle{({}_1\boldsymbol{\varGamma}_{t_0}(\boldsymbol{p }))^{-1} \boldsymbol{N}_{t_0}}}_{\dot{\boldsymbol{W}}_{III}}, \end{align}
where  $\alpha _{t_0}(\,\boldsymbol {p}) = \langle \boldsymbol {r}_{u},\boldsymbol {S}(\boldsymbol {r} (\,\boldsymbol {p}),t_0)\boldsymbol {r}_{u}\rangle \langle \boldsymbol {r}_{v},\boldsymbol {r}_{v}\rangle +\langle \boldsymbol {r}_{v}, \boldsymbol {S}(\boldsymbol {r}(\,\boldsymbol {p}),t_0)\boldsymbol {r}_{v} \rangle \langle \boldsymbol {r}_{u},\boldsymbol {r}_{u}\rangle -2\langle \boldsymbol {r}_{u},\boldsymbol {S}(\boldsymbol {r}(\,\boldsymbol {p}), t_0) \boldsymbol {r}_{v}\rangle \langle \boldsymbol {r}_{u},\boldsymbol {r}_{v} \rangle, \boldsymbol {I}$ is the identity matrix of rank 2,
 \begin{align} \boldsymbol{D}(\boldsymbol{p},t_0) &=\left(\begin{matrix} \langle\boldsymbol{r}_v,\boldsymbol{S}(\boldsymbol{r}(\,\boldsymbol{p}),t_0) \boldsymbol{r}_v\rangle & -\langle\boldsymbol{r}_u,\boldsymbol{S} (\boldsymbol{r}(\,\boldsymbol{p}),t_0)\boldsymbol{r}_v\rangle\\ -\langle\boldsymbol{r}_u,\boldsymbol{S}(\boldsymbol{r}(\,\boldsymbol{p}),t_0) \boldsymbol{r}_v\rangle & \langle\boldsymbol{r}_u,\boldsymbol{S} (\boldsymbol{r}(\,\boldsymbol{p}),t_0)\boldsymbol{r}_u\rangle \end{matrix}\right), \end{align}
 \begin{align} \boldsymbol{M}(\boldsymbol{p},t_0) &=\left(\begin{matrix} \langle\boldsymbol{n}_{t_0},\boldsymbol{\nabla} \boldsymbol{S} (\boldsymbol{r}(\,\boldsymbol{p}),t_0)\boldsymbol{r}_u \boldsymbol{r}_u\rangle & \langle\boldsymbol{n}_{t_0},\boldsymbol{\nabla} \boldsymbol{S}(\boldsymbol{r}(\,\boldsymbol{p}),t_0)\boldsymbol{r}_u \boldsymbol{r}_v\rangle\\ \langle\boldsymbol{n}_{t_0},\boldsymbol{\nabla} \boldsymbol{S}(\boldsymbol{r} (\,\boldsymbol{p}),t_0)\boldsymbol{r}_v\boldsymbol{r}_u\rangle & \langle \boldsymbol{n}_{t_0},\boldsymbol{\nabla} \boldsymbol{S}(\boldsymbol{r} (\,\boldsymbol{p}),t_0)\boldsymbol{r}_v\boldsymbol{r}_v\rangle \end{matrix}\right), \end{align}
 \begin{align} \boldsymbol{N}(\boldsymbol{p},t_0) &= \left(\begin{matrix} \langle\boldsymbol{n}_{t_0},\boldsymbol{\nabla} \boldsymbol{\varOmega} (\boldsymbol{r}(\,\boldsymbol{p}),t_0)\boldsymbol{r}_u\boldsymbol{r}_u\rangle & \langle\boldsymbol{n}_{t_0},\boldsymbol{\nabla} \boldsymbol{\varOmega}(\boldsymbol{r} (\,\boldsymbol{p}),t_0)\boldsymbol{r}_u\boldsymbol{r}_v\rangle\\ \langle\boldsymbol{n}_{t_0},\boldsymbol{\nabla} \boldsymbol{\varOmega} (\boldsymbol{r}(\,\boldsymbol{p}),t_0)\boldsymbol{r}_v\boldsymbol{r}_u\rangle & \langle\boldsymbol{n}_{t_0},\boldsymbol{\nabla} \boldsymbol{\varOmega} (\boldsymbol{r}(\,\boldsymbol{p}),t_0)\boldsymbol{r}_v\boldsymbol{r}_v\rangle \end{matrix}\right). \end{align}
Proof. See Appendices A and B.
The term  $\boldsymbol {W}_{I}$ in (3.4) describes the contribution to material folding induced by the flow if
 $\mathcal {M}(t_0)$ has non-zero initial curvature
 $\boldsymbol {W}_{t_0}$ while
 $\boldsymbol {W}_{II}$ folds
 $\mathcal {M}(t)$ regardless of
 $\boldsymbol {W}_{t_0}$. In
 $\boldsymbol {W}_{I}$,
 $J_{t_0}^t(\,\boldsymbol {p})$ relates the area element (
 $\textrm {d} A$) of
 $\mathcal {M}(t)$ to the area element (
 $\textrm {d}u\, \textrm {d}v$) at
 $\boldsymbol {p}$ by
 $\textrm {d} A = J_{t_0}^{t}(\,\boldsymbol {p})\,\textrm {d}u\,\textrm {d}v$,
 $ {\rm det}(\boldsymbol {\nabla }\boldsymbol {F}^t_{t_0} (\boldsymbol {r}(\,\boldsymbol {p}))$ accounts for volume changes and the first fundamental form
 ${}_1\boldsymbol {\varGamma }_{t_0}(\,\boldsymbol {p})$ accounts for the shape of
 $\mathcal {M}(t_0)$. In
 $\boldsymbol {W}_{II}$,
 $\boldsymbol {B}_{t_0}^{t}(\,\boldsymbol {p})$ accounts for the folding of
 $\mathcal {M}(t)$ described by second spatial derivatives of
 $\boldsymbol {F}^t_{t_0}$. In the short-time limit, (3.6) quantifies the rate of change of
 $\boldsymbol {W}_{t_0}^t(\,\boldsymbol {p})$ at
 $t_0$, and elucidates which flow features contribute to the folding rate of
 $\mathcal {M}_{t_0}$. Specifically,
 $\dot {\boldsymbol {W}}_{I}$) encodes the compressibility of
 $\boldsymbol {f}$ (
 $\boldsymbol {\nabla }\boldsymbol {\cdot } \boldsymbol {f}$), the stretching rate along
 $\mathcal {M}_{t_0}$ (
 $\alpha _{t_0}(\,\boldsymbol {p})$ and
 $\boldsymbol {D}(\boldsymbol {p},t_0)$) and the metric properties (
 ${}_1\varGamma _{t_0}(\,\boldsymbol {p})$), weighted by its current curvature
 $\boldsymbol {W}_{t_0}$;
 $\dot {\boldsymbol {W}}_{II}$) accounts for spatial variations of the stretching rates on
 $\mathcal {M}_{t_0}$ encoded in
 $\boldsymbol {\nabla }\boldsymbol {S}$; and
 $\dot {\boldsymbol {W}}_{III}$) accounts for spatial variations of rigid-body rotation rates on
 $\mathcal {M}_{t_0}$ encoded in
 $\boldsymbol {\nabla } \boldsymbol {\varOmega }$. Equations (3.4) and (3.6) have the same functional form as their 2-D analogues in Serra et al. (Reference Serra, Vétel and Haller2018) describing the folding of material curves, with the tensor
 $\boldsymbol {W}_{t_0}^t$ replacing the scalar curvature
 $\kappa _{t_0}^t$.
Theorem 1 shows that the Lagrangian folding and the Eulerian folding rate of a material surface are caused by stretching- and rotation-based quantities. In Appendix C, we show that  $\boldsymbol {W}_{t_0}^t(\,\boldsymbol {p})$ and
 $\dot {\boldsymbol {W}}_{t_0}^t(\,\boldsymbol {p})$ are invariant with respect to changes in the parametrization
 $\boldsymbol {r}(\,\boldsymbol {p})$ and time-dependent rotations and translations of the coordinate frame. Remarkably, although the spin tensor
 $\boldsymbol {\varOmega }$ is not objective, its spatial variations contributing to folding (cf. (3.9)) is objective, similar to the 2-D case (Serra et al. Reference Serra, Vétel and Haller2018). We summarize these results as follows.
Proposition 1 Denote all Euclidean coordinate changes by
 \begin{equation} \tilde{\boldsymbol{x}}=\boldsymbol{Q}(t)\boldsymbol{x}+ \boldsymbol{b}(t),\end{equation}
where  $\boldsymbol {Q}(t)\in SO(3)$ and
 $\boldsymbol {b}(t)\in \mathbb {R}^{3}$ are smooth functions of time. Here,
 $\boldsymbol {W}_{t_0}^t(\,\boldsymbol {p})$ and
 $\dot {\boldsymbol {W}}_{t_0}^t(\,\boldsymbol {p})$ are independent of the parametrization
 $\boldsymbol {r}(\,\boldsymbol {p})$ (3.1) and invariant under the coordinate changes in (3.10). Invariance here means
 $\tilde {\boldsymbol {W}}_{t_0}^t(\,\boldsymbol {p})= \boldsymbol {W}_{t_0}^t(\,\boldsymbol {p})$ and
 $\widetilde {\dot {\boldsymbol {W}}}_{t}(\,\boldsymbol {p})= \dot {\boldsymbol {W}}_{t}(\,\boldsymbol {p})$, where
 $\widetilde {({\cdot })}$ denotes quantities expressed as a function of the
 $\tilde {\boldsymbol {x}}$-coordinate, and
 $({\cdot })$ the same quantity expressed in terms of
 $\boldsymbol {x}$-coordinate.
Proof. See Appendix C.
We note that the invariance of material folding in Proposition 1 is stronger than objectivity (Truesdell & Noll Reference Truesdell and Noll2004), which is required in the continuum mechanics assessment of material response and the definitions of Lagrangian and Eulerian coherent structures (Haller Reference Haller2015; Serra & Haller Reference Serra and Haller2016).
4. The Lagrangian backbone of flow separation
The onset of fluid flow separation is characterized by a distinctly folded material spike that will later separate from the boundary surface, similar to the spike formation in 2-D flows (figure 1). In three dimensions, however, the Lagrangian backbone of separation – i.e. the centrepiece of the material spike – can be one-dimensional (codimension 2) or two-dimensional (codimension 1). A 1-D backbone marks an approximately symmetric spike. In contrast, a 2-D backbone marks a ridge-like spike where folding perpendicular to the ridge is higher than the one along the ridge (cf. figure 2b).
Equipped with the exact expressions from § 3, we proceed with the definition and identification of the Lagrangian backbone of separation in three dimensions. We first define the Lagrangian change and the Eulerian rate of change of the Weingarten map as
 \begin{equation} \bar{\boldsymbol{W}}_{t_0}^{t}(\,\boldsymbol{p}) =\boldsymbol{W}_{t_0}^{t}(\,\boldsymbol{p})- \boldsymbol{W}_{t_0}(\,\boldsymbol{p}),\quad \dot{\bar{\boldsymbol{W}}}_{t_0}(\,\boldsymbol{p}) = \dot{\boldsymbol{W}}_{t_0}(\,\boldsymbol{p}),\end{equation}
which quantify the finite-time folding and instantaneous folding rates induced by the flow on  $\mathcal {M}(t)$. We denote the eigenvalues of
 $\bar {\boldsymbol {W}}_{t_0}^{t}(\,\boldsymbol {p})$ by
 ${}_{1}\bar {\kappa }_{t_{0}}^t(\,\boldsymbol {p})\leq {}_{2}\bar {\kappa }_{t_{0}}^t(\,\boldsymbol {p})$ and the associated eigenvectors by
 $\bar {\boldsymbol {\zeta }}_1, \bar {\boldsymbol {\zeta }}_2$. Here,
 ${}_{2}\bar {\kappa }_{t_{0}}^t(\,\boldsymbol {p})$ quantifies the highest curvature change, i.e. the folding induced by
 $\boldsymbol {F}_{t_0}^t$, at
 $\boldsymbol {r}(\,\boldsymbol {p})$. By selecting normal vectors pointing towards the no-slip boundary, positive eigenvalues of
 $\bar {\boldsymbol {W}}_{t_0}^{t}(\,\boldsymbol {p})$ mark upwelling-type deformations.
As aggregate curvature measures described by  $\bar {\boldsymbol {W}}_{t_0}^{t}(\,\boldsymbol {p})$, we denote the Gaussian curvature change by
 $\bar {K}_{t_0}^t(\,\boldsymbol {p})= \det [\bar {\boldsymbol {W}}_{t_0}^{t}(\,\boldsymbol {p})]={}_{1} \bar {\kappa }_{t_{0}}^t(\,\boldsymbol {p}) {}_{2}\bar {\kappa }_{t_{0}}^t(\,\boldsymbol {p})$ and the mean curvature change by
 $\bar {H}_{t_0}^t(\,\boldsymbol {p})= {\textrm {Trace}[\bar {\boldsymbol {W}}_{t_0}^{t}(\,\boldsymbol {p})]}/{2}= ({{}_{1}\bar {\kappa }_{t_{0}}^t(\,\boldsymbol {p})+ {}_{2}\bar {\kappa }_{t_{0}}^t(\,\boldsymbol {p})})/{2}$. For compactness, we may denote the principal curvature changes also by
 $\bar {\kappa }_{1},\bar {\kappa }_{2}$, the Gaussian curvature change by
 $\bar {K}$ and the mean curvature change by
 $\bar {H}$. We note that the Gaussian curvature
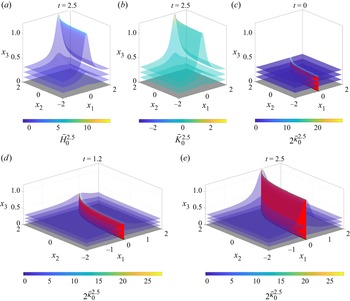
 $\bar {K}$ is not a good metric to characterize the Lagrangian spike formation because in the case of flat (or approximately flat) 2-D separation ridges (e.g. figure 3),
 $\bar {K} \approx 0$ on the ridge. Similarly, the mean curvature change
 $\bar {H}$ is not a good metric for separation as in the case of hyperbolic-type upwelling deformations, i.e. when
 $\bar {K}<0$,
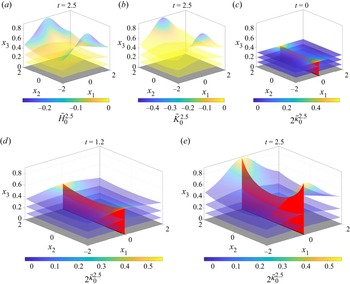
 $\bar {H}$ can vanish on points along the separation backbone (e.g. figure 4).
Separation ridge curved in  $x_1-x_2$ generated by flow described in § 7.1 over a time interval
 $[0,2.5]$. (a) Mean curvature change
 $\bar {H}_{0}^{2.5}$ and (b) Gaussian curvature change
 $\bar {K}_{0}^{2.5}$ fields shaded on representative material surfaces at
 $t=2.5$. (c) Larger principal curvature change
 ${}_2\bar {\kappa }_{0}^{2.5}$ field shaded on a material surface at
 $t=0$. The Lagrangian backbone of separation
 $\mathcal {B}(0)$ is shown in red, and the black line corresponds to the Lagrangian spiking curve
 $\gamma _{sc}$. (d,e) The Lagrangian backbone of separation
 $\mathcal {B}(t)$ at later times in red, with the change in the larger principal curvature
 ${}_2\bar {\kappa }_{0}^{2.5}$ shaded on selected material surfaces. The time evolution of panels (a–e) is available in supplementary movie 2.


We observe that for either 1-D or 2-D separation backbones, high values of  $\bar {\kappa }_2$ mark the material spike location. For the 2-D separation backbone,
 $\bar {\kappa }_2$ is maximum along the principal direction
 $\bar {\boldsymbol {\zeta }}_2$ (figure 2a,b). In the 1-D separation backbones, however,
 $\bar {\kappa }_2 \cong \bar {\kappa }_1$ and
 $\bar {\boldsymbol {\zeta }}_1, \bar {\boldsymbol {\zeta }}_2$ are not defined (figure 2a,b). In this symmetric case, maxima of
 $\bar {\kappa }_2$ mark the separation backbone. To express this coherence principle mathematically, we consider a general curved no-slip boundary (figure 2c) and a set – mathematically, a foliation – of wall-parallel material surfaces at
 $t_0$ parametrized by
 $\boldsymbol {r}_{\eta }(\,\boldsymbol {p}), \eta \in [0,\eta _{1}], \eta _1\in \mathbb {R}^+$, where the boundary is defined as
 \begin{equation} \mathcal{W} := \{\boldsymbol{r}_{\eta}(\,\boldsymbol{p})\subset\mathbb{R}^3, \boldsymbol{p}\in V, \eta = 0 \}. \end{equation}
We denote the largest principal curvature change along each layer ( $\eta = \textrm {const.}$) as
 ${}_{2}\bar {\kappa }_{\eta }$, the Weingarten map change as
 $\bar {\boldsymbol {W}}_{\eta }$ and the corresponding Gauss and mean curvature changes by
 $\bar {K}_{\eta },\bar {H}_{\eta }$. Following Serra et al. (Reference Serra, Vétel and Haller2018), we give the following mathematical definition.
Definition 1 The Lagrangian backbone  $\mathcal {B}(t)$ of separation is the theoretical centrepiece of the material spike over the time interval
 $[t_0,t_0+T]$.
(a) A 1-D backbone
 $\mathcal {B}(t)$ is an evolving material line whose initial position $\mathcal {B}(t_0)$ is a set of points made by positive-valued maxima of the ${}_{2}\bar {\kappa }_{\eta }$ field (figure 2b). For each $\eta = const.$ layer, $\mathcal {B}(t_0)$ is made of positive maximum points of ${}_{2}\bar {\kappa }_{\eta }$.
(b) A 2-D backbone
$\mathcal {B}(t)$ is an evolving material surface whose initial position $\mathcal {B}(t_0)$ is a positive-valued, wall-transverse ridge of ${}_{2}\bar {\kappa }_{\eta }$ (figure 2b). For each $\eta = const.$ layer, $\mathcal {B}(t_0)$ is made of positive maxima of ${}_{2}\bar {\kappa }_{\eta }$ along the principal direction $\bar {\boldsymbol {\zeta }}_2$.


To discern 1-D and 2-D separation backbones, we first identify the set of points  $\boldsymbol {r}_{\eta }(\,\boldsymbol {p})$ on different (
 $\eta =\textrm {const.}$) layers where
 $2\sqrt {\vert \bar {K}_{\eta }(\,\boldsymbol {p})\vert } = \vert \bar {H}_{\eta }(\,\boldsymbol {p})\vert$. On these points,
 $\bar {\boldsymbol {W}}_{t_0}^{t}(\,\boldsymbol {p})$ does not have distinct eigenvalues. Within this set, a 1-D separation backbone
 $\mathcal {B}(t_0)$ at
 $t_0$ is made of positive maximum points of
 ${}_2\bar {\kappa }_{\eta }(\,\boldsymbol {p}):= \bar {H}_{\eta }(\,\boldsymbol {p})/2$, specified by the conditions in Proposition 2(i) left. The first condition ensures material upwelling while the second and third conditions ensure that
 ${}_2\bar {\kappa }_{\eta }(\,\boldsymbol {p})$ is maximum, i.e. that
 ${}_2\bar {\kappa }_{\eta }(\,\boldsymbol {p})$ has zero gradient and a negative definite Hessian. By contrast, 2-D separation backbones
 $\mathcal {B}(t_0)$ at
 $t_0$ are made of points
 $\boldsymbol {r}_{\eta }(\,\boldsymbol {p})$ on different (
 $\eta =const.$) layers where
 $2\sqrt {\vert \bar {K}_{\eta }(\,\boldsymbol {p})\vert } \neq \vert \bar {H}_{\eta }(\,\boldsymbol {p})\vert$. Within this set,
 $\mathcal {B}(t_0)$ is made of positive maxima of
 ${}_{2}\bar {\kappa }_{\eta }$ along the principal direction
 $\bar {\boldsymbol {\zeta }}_2$, specified by the conditions in Proposition 2(i) right.
Similar to the 2-D case (Serra et al. Reference Serra, Vétel and Haller2018), in three dimensions, the points (curves) where the Lagrangian one- (two-)dimensional separation backbones connect to the wall are of particular interest for understanding whether the separation is on-wall or off-wall and for potential flow control strategies. We name these on-wall points Lagrangian spiking points  $\boldsymbol {r}_{sp}$ and Lagrangian spiking curves
 $\boldsymbol {\gamma }_{sc}$ (figure 2c). They can be identified as the intersection of
 $\mathcal {B}(t_0)$ with the wall
 $\mathcal {W}$:
 \begin{equation} \boldsymbol{r}_{sp} := \text{one-dimensional } \mathcal{B}(t_0) \cap \mathcal{W},\quad \gamma_{sc} := \text{two-dimensional } \mathcal{B}(t_0) \cap \mathcal{W}.\end{equation}
We provide below an alternative method for locating  $\boldsymbol {r}_{sp}$ and
 $\boldsymbol {\gamma }_{sc}$ in terms of the Weingarten map. Because
 ${}_2\bar {\kappa }_{0}(\,\boldsymbol {p}) = 0$ on the wall,
 $\boldsymbol {r}_{sp}$ and
 $\boldsymbol {\gamma }_{sc}$ are distinguished wall points and lines with maximal positive
 ${}_2\bar {\kappa }_{\eta }(\,\boldsymbol {p})$ in the limit of
 $\eta \rightarrow 0$. To this end, we define
 $\bar {K}_{\delta \eta }(\,\boldsymbol {p}) = \textrm {det}(\bar {\boldsymbol {W}}_{\delta \eta }(\,\boldsymbol {p}))$ (we use the subscript
 $0<\delta \eta \ll 1$ to indicate the leading-order contribution of material folding close to the wall) and
 $\bar {H}_{\delta \eta }(\,\boldsymbol {p}) = \textrm {Tr}(\bar {\boldsymbol {W}}_{\delta \eta }(\,\boldsymbol {p}))$, where
 $\bar {\boldsymbol {W}}_{\delta \eta }(\,\boldsymbol {p})$ encodes the leading-order curvature change close to the wall. Using
 $\bar {K}_{\delta \eta }$ and
 $\bar {H}_{\delta \eta }$, in Appendix D we derive explicit formulas for the Lagrangian spiking points and curves in the case of compressible and incompressible flows. The only difference between the two cases is that, in the former,
 $\bar {\boldsymbol {W}}_{\delta \eta }(\,\boldsymbol {p}):= \partial _{\eta }\bar {\boldsymbol {W}}_\eta (\,\boldsymbol {p})\vert _{\eta =0}$, while, in the latter,
 $\bar {\boldsymbol {W}}_{\delta \eta }(\,\boldsymbol {p}) := \partial _{\eta \eta }\bar {\boldsymbol {W}}_\eta (\,\boldsymbol {p})\vert _{\eta =0}$. We summarize our results for the identification of
 $\boldsymbol {r}_{sp}$ and
 $\boldsymbol {\gamma }_{sc}$ in terms of Lagrangian quantities in table 1.
Exact criteria for the Lagrangian spiking points  $\boldsymbol {r}_{sp}$ and curves
 $\boldsymbol {\gamma }_{sc}$ on a no-slip boundary over the time interval
 $[t_0,t_0+T]$ for compressible and incompressible flows. All quantities
 $\overline {({\cdot })}$ describe eigenvalues, eigenvectors, trace and determinant of
 $\bar {\boldsymbol {W}}_{\delta \eta }(\,\boldsymbol {p})$, consistent with our earlier notation.

In table 2, we provide exact formulas for computing  $\bar {\boldsymbol {W}}_{\delta \eta }(\,\boldsymbol {p})$ used in the definitions of the Lagrangian spiking points and curves (table 1) in terms of on-wall Eulerian quantities for steady, time-periodic and time-aperiodic flows. The formulas in tables 1 and 2 highlight three important facts. First, in the case of steady flows, spiking points and curves are fixed, independent of
 $T$, and can be computed from derivatives of the velocity field on the wall. Second, in the case of
 $T_p$-periodic flows, with
 $T$ equal to any arbitrary multiple of
 $T_p$, spiking points and curves are fixed, independent of
 $t_0$, and can be computed by averaging derivatives of the velocity field on the wall over one period. Third, for general unsteady flows or time-periodic flows with
 $T\neq nT_p, n\in \mathbb {N}^+$, spiking points and curves move depending on
 $t_0$ and
 $T$, and can be computed by averaging derivatives of the velocity field over
 $[t_0,t_0+T]$. We summarize the results of this section in the following Proposition.
Formulas for computing  $\bar {\boldsymbol {W}}_{\delta \eta }(\,\boldsymbol {p})$ used in the definitions of the Lagrangian spiking points and curves (table 1) in terms of on-wall Eulerian quantities for steady, time-periodic and time-aperiodic flows. Here,
 $f_3= f_3(\boldsymbol {r}_\eta (\,\boldsymbol {p}),t)$, and derivatives are evaluated at
 $\eta =0$.

Proposition 2 Over the finite-time interval  $t\in [t_0, t_0+T]$:
(i) The initial position
$\mathcal {B}(t_0)$ of the Lagrangian backbone of separation can be computed as the set of points $\boldsymbol {r}_{\eta }(\,\boldsymbol {p})\in U, \boldsymbol {p}\in V, \eta \in [0,\eta _1]$ that satisfy the following conditions.
The Lagrangian spiking points
$\boldsymbol {r}_{sp}$ and curves $\boldsymbol {\gamma }_{sc}$ can be computed in terms of Lagrangian quantities using the formulas in table 1, in terms of wall-based averaged Eulerian quantities using the formulas in tables 1 and 2, or as the intersection of $\mathcal {B}(t_0)$ with the no-slip boundary (4.3a,b).(ii) Later positions
$\mathcal {B}(t)$ of the Lagrangian backbone of separation can be computed as $\mathcal {B}(t):= \boldsymbol {F}_{t_0}^t(\mathcal {B}(t_0))$.(iii) The Lagrangian spiking points and curves


By Proposition 1, the Lagrangian backbone of separation is invariant under coordinate ( $\boldsymbol {x}$) transformations (cf. (3.10)) and changes in the parametrization (
 $\boldsymbol {r}(\,\boldsymbol {p})$) of initial conditions. Although the analytic formulas in tables 1 and 2 involve higher derivatives of the velocity field, the spiking point can also be identified as the intersection of
 $\mathcal {B}(t_0)$ with the wall (cf. (4.3a,b)) with low numerical effort. We note that, in general unsteady flows
 $\boldsymbol {f}(\boldsymbol {x},t)$, the flow map
 $\boldsymbol {F}_{t_0}^{t_0+T}$ depends on both the initial time
 $t_0$ and on the Lagrangian time interval
 $T$. Varying these two parameters enables uncovering all the separation features generated by
 $\boldsymbol {f}(\boldsymbol {x},t)$, and their choice depends on technological limitations and the desired separation analysis. We provide two examples for selecting
 $t_0$ or
 $T$ in Appendix I.
5. The Eulerian backbone of flow separation
Over an infinitesimally short-time interval, the Eulerian backbone of flow separation acts as the centrepiece of the material spike formation. We define this Eulerian concept by taking the time derivative of the Lagrangian backbone of separation and evaluating it at  $T=0$. From (4.1a,b), the rate of change of
 $\bar {\boldsymbol {W}}_{t_0}^{t}(\,\boldsymbol {p})$ in the infinitesimally short time limit is
 $\dot {\boldsymbol {W}}_{t}(\,\boldsymbol {p})$ (eq. (3.6)). Denoting by
 ${}_{1}\dot {\kappa }_{t}(\,\boldsymbol {p})\leq {}_{2}\dot {\kappa }_{t}(\,\boldsymbol {p})$,
 $\dot {\boldsymbol {\zeta }}_1, \dot {\boldsymbol {\zeta }}_2$ the eigenvalues and eigenvectors of
 $\dot {\boldsymbol {W}}_{t}(\,\boldsymbol {p})$, and by
 $\dot {K}_{t}(\,\boldsymbol {p})= \det [\dot {\boldsymbol {W}}_{t}(\,\boldsymbol {p})]={}_{1}\dot {\kappa }_{t}(\,\boldsymbol {p}) {}_{2}\dot {\kappa }_{t}(\,\boldsymbol {p})$,
 $\dot {H}_{t}(\,\boldsymbol {p})= {\textrm {Trace}[\dot {\boldsymbol {W}}_{t}(\,\boldsymbol {p})]}/{2}= ({{}_{1}\dot {\kappa }_{t}(\,\boldsymbol {p})+ {}_{2}\dot {\kappa }_{t}(\,\boldsymbol {p})})/{2}$ the Gaussian and mean curvature rates, we define the Eulerian backbone of separation as follows. We may omit the explicit time dependence notation for compactness.
Definition 2 At a time instant  $t$, the Eulerian backbone of separation
 $\mathcal {B}_E(t)$ is the theoretical centrepiece of the material spike over an infinitesimally short time interval.
(a) A 1-D backbone
$\mathcal {B}_E(t)$ is a set of points made by positive-valued maxima of the ${}_{2}\dot {\kappa }_{\eta }$ field. For each $\eta = \textrm {const.}$ layer, $\mathcal {B}_E(t)$ is made of positive maximum points of ${}_{2}\dot {\kappa }_{\eta }$.(b) A 2-D backbone
$\mathcal {B}_E(t)$ is a positive-valued, wall-transverse ridge of ${}_{2}\dot {\kappa }_{\eta }$. For each $\eta = const.$ layer, $\mathcal {B}_E(t)$ is made of positive maxima of ${}_{2}\dot {\kappa }_{\eta }$ along the principal direction $\dot {\boldsymbol {\zeta }}_2$.


Here,  $\mathcal {B}_E(t)$ is a set of points where the instantaneous folding rate is positive and attains a local maximum along each
 $\eta =\textrm {const.}$ surfaces, and can be computed as described in Proposition 3.
Similar to the Lagrangian case, we define the Eulerian spiking point  $\boldsymbol {r}_{spE}$ and the Eulerian spiking curve
 $\gamma _{scE}$ as follows:
 \begin{align} \boldsymbol{r}_{spE} := \text{one-dimensional}\ \mathcal{B}_E(t_0) \cap \mathcal{W},\quad \gamma_{scE} := \text{two-dimensional}\ \mathcal{B}_E(t_0) \cap \mathcal{W},\end{align}
i.e. where the Eulerian backbones of separation connects to the wall. Because  $\dot {\kappa }_{t}(\,\boldsymbol {p})\equiv 0$ on the no-slip boundary,
 $\boldsymbol {r}_{spE}, \gamma _{scE}$ are distinguished points on the wall with positive maximal curvature rate in the limit of
 $\eta \rightarrow 0$.
For a flat wall, we derive analytic expressions for  $\boldsymbol {r}_{spE} = \boldsymbol {r}_{\eta =0}(\boldsymbol {p}_{spE})$ and
 $\gamma _{scE}$ (a set of
 $\boldsymbol {r}_{scE} = \boldsymbol {r}_{\eta =0}(\boldsymbol {p}_{scE})$) in Appendix E, and summarize them in tables 3 and 4. For steady flows, comparing the formula of
 $\boldsymbol {p}_{sp}$ and
 $\boldsymbol {p}_{sc}$ (cf. table 1) with the one of
 $\boldsymbol {p}_{spE}$ and
 $\boldsymbol {p}_{scE}$ (cf. table 3), we obtain that the Lagrangian and the Eulerian backbones of separation connect to the wall at the same location, i.e.
 $\boldsymbol {p}_{spE}\equiv \boldsymbol {p}_{sp}$ and
 $\gamma _{spE}\equiv \gamma _{sp}$ (see e.g. figure 9). We summarize the results of this section in the following Proposition.
Proposition 3 At a time instant  $t$:
(i) The Eulerian backbone of separation
$\mathcal {B}_E(t)$ can be computed as the set of points $\boldsymbol {r}_{\eta }(\,\boldsymbol {p})\in U, \, \boldsymbol {p}\in V,\, \eta \in [0,\eta _1]$ that satisfy the following conditions.
The Eulerian spiking points
$\boldsymbol {r}_{spE}$ and curves $\boldsymbol {\gamma }_{scE}$ can be computed using the formulas in tables 3 and 4, or as the intersection of $\mathcal {B}_E(t)$ with the no-slip boundary (5.1a,b).(ii) The Eulerian spiking point and curve coincides with the Lagrangian spiking point and curve in steady flows.


Exact criteria determining the Eulerian spiking points  $\boldsymbol {r}_{spE}$ and curves
 $\boldsymbol {\gamma }_{scE}$ on a no-slip boundary at a time instant
 $t$ for compressible and incompressible flows. All quantities
 $\dot {\overline {({\cdot })}}$ describe eigenvalues, eigenvectors, trace and determinant of
 $\dot {\bar {\boldsymbol {W}}}_{\delta \eta }(\,\boldsymbol {p})$, consistent with our earlier notation.

Formulas for computing  $\dot {\boldsymbol {W}}_{\delta \eta }(\,\boldsymbol {p})$ used in the definitions of the Eulerian spiking points and curves (table 3) in terms of on-wall Eulerian quantities. Here,
 $f_3= f_3(\boldsymbol {r}_\eta (\,\boldsymbol {p}),t)$, and derivatives are evaluated at
 $\eta = 0$ and
 $t= t_0$.

By Proposition 1, the Eulerian backbone of separation is objective. Following the same argument of § 4, although the analytic formulas in table 4 involve higher derivatives of the velocity field, the spiking point can also be identified with low numerical effort directly from (5.1a,b), as the intersection of  $\mathcal {B}_E(t)$ with the wall.
6. Numerical schemes
We summarise the numerical steps necessary to locate Lagrangian and Eulerian separation backbones in a general 3-D flow.
Compute the Lagrangian backbone  $\mathcal{B}(t)$ of separation (Proposition 2)

Compute the Eulerian backbone  $\mathcal{B}_E(t)$ of separation (Proposition 3)

In §§ 7.1–7.5, we have applied Algorithms 1 and 2 using the standard ode45 function in MATLAB (2021b) with absolute and relative tolerances  $10^{-6}$ to compute
 $\boldsymbol {F_{t_0}^t}(\boldsymbol {x_{0}})$, and approximated spatial derivatives of
 $\boldsymbol {F_{t_0}^t}(\boldsymbol {x_{0}})$ with finite differencing. We adopt a similar procedure in §§ 7.6 and 7.7, except for the computation of
 $\boldsymbol {F_{t_{0}}^t}(\boldsymbol {x_{0}})$, which is outputted directly by the Navier Stokes solver, as detailed in Appendix H. The computation of Eulerian and Lagrangian backbones of separation is robust. Similarly, we robustly identified the spiking points and curves using their topological definitions in ((4.3a,b) and (5.1a,b)). Identifying the spiking points and curves using only wall-based quantities (cf. tables 1 and 3), however, is more sensitive to noise due to higher spatial derivatives involved. We have addressed this challenge in Klose et al. (Reference Klose, Serra and Jacobs2020b) by computing the higher wall-normal and tangential velocity derivatives at the wall using a high-order spectral element method with polynomial orders higher than required by the derivatives. In (Klose et al. Reference Klose, Serra and Jacobs2020b), we have also reduced numerical noise by properly filtering the spatial derivatives. We expect a similar procedure to apply to 3-D flows.
7. Examples
We illustrate our results by applying Algorithms 1 and 2 to 3-D analytical and simulated flow fields. In §§ 7.1 and 7.4, we introduce our results on simple, synthetic, analytical flows, demonstrating how our method captures simultaneous 1-D and 2-D backbones of separation. We also show that other metrics, such as the Gaussian curvature  $\bar {K}_{t_0}^{t}$ and mean curvature
 $\bar {H}_{t_0}^{t}$ changes are suboptimal to capture flow separation. In § 7.4, we capture separating structures that transition from a purely on-wall separation to on-wall and off-wall separation for longer time intervals. In §§ 7.5 and 7.7, we apply our results to steady and unsteady velocity fields that solve the Navier–Stokes equations and are computed by direct numerical simulation.
7.1. Two-dimensional separation ridge curved on the wall
We consider an analytical velocity field that generates a curved separation structure from a flat, no-slip boundary located at  $x_3 = 0$. We construct the velocity field as
 $f_1 = 0, f_2 = 0$ and
 $f_3 =0.5 ({x_3^2}/({(x_1- e^{x_2-2})^2+0.5}))$, and perform a Lagrangian analysis in the time interval
 $[0,2.5]$.
 $\bar {H}_{0}^{2.5}$ and
 $\bar {K}_{0}^{2.5}$ are shaded on three representative material surfaces
 $\mathcal {M}(t)$ at increasing distances from the wall in figure 3(a,b). Figure 3(c) shows the initial Lagrangian backbone of separation
 $\mathcal {B}(0)$ (red) along with the largest principal curvature change field
 ${}_2\bar {\kappa }_{0}^{2.5}$ shaded on
 $\mathcal {M}(0)$. The advected backbone of separation
 $\mathcal {B}(t)$ is shown in figure 3(d) at
 $t = 1.2$ and (e) at
 $t = 2.5$, along with
 ${}_2\bar {\kappa }_{0}^{2.5}$ shaded on
 $\mathcal {M}(t)$. The black curve on the wall in panels (c–e) marks the Lagrangian spiking curve, i.e. the on-wall signature of the separation backbone. The Gaussian curvature change is zero along the ridge, making
 $\bar {K}_{t_0}^{t_0+T}$ an unsuitable metric to characterize the separation backbone.
7.2. Two-dimensional separation ridge curved off-wall
We consider an analytical velocity field that generates an off-wall curved separation ridge from a flat, no-slip boundary located at  $x_3 = 0$. We construct a velocity field as
 $f_1 = 0,f_2 =0$ and
 $f_3= 0.5 ({(0.2 x_2^2+1)x_3^2}/({0.2x_1^2 +1}))$. Figure 4 shows the same quantities of figure 3 for this new velocity. Here,
 $\bar {H}_{0}^{2.5}$ is zero at the saddle point of the separation spike, showing that the mean curvature change is suboptimal for identifying the backbone of separation. By contrast,
 ${}_2\bar {\kappa }_{0}^{2.5}$ has a maximal ridge along the centrepiece of the material spike, correctly identifying the backbone of separation (red), and the corresponding Lagrangian spiking curve
 $\gamma _{sc}$ (black).
7.3. Coexisting 1-D and 2-D backbones of separation
Material spike formation could lead to either 1-D or 2-D backbones of separation (figure 2). Here, we consider an analytical velocity field coexisting 1-D and 2-D separation backbones. The velocity field is given by  $f_1= 0,f_2 = 0$ and
 $f_3 = 0.1 ({x_3^2}/({(x_1+2)^2 + x_2^2 +0.2})) + 0.1 ({x_3^2}/({(x_1-2)^2 +0.2}))$. Figure 5(a) shows the Eulerian backbones of separation (magenta), the largest principal curvature rate
 ${}_2\dot {\kappa }$ shaded on representative material surfaces at different distances from the wall and the Eulerian spiking curve
 $\gamma _{scE}$ and point
 $\gamma _{spE}$ (green), representing the on-wall footprints of the Eulerian backbones of separation. We also compute the Lagrangian backbones of separation
 $\mathcal {B}(t)$ over a time interval
 $[0, 5]$, and show them in red along with the
 ${}_2\bar {\kappa }_{0}^{5}$ field at the initial and final times along their corresponding
 $\gamma _{sp}$ and
 $\gamma _{sc}$ in black (figure 5b,c). A closer inspection of panels (a,b) shows that the Eulerian and Lagrangian spiking points and curves coincide in steady flows, as predicted theoretically in Proposition 3.
Coexisting 1-D and 2-D separation backbones generated by the flow described in § 7.3. (a) Larger principal curvature rate field  ${}_2\dot {\kappa }$, Eulerian backbones of separation
 $\mathcal {B}_E$ (magenta) and their corresponding Eulerian spiking point
 $\boldsymbol {r}_{spE}$ and curve
 $\gamma _{scE}$ (green). (b,c) The Lagrangian backbones of separation
 $\mathcal {B}(t)$ (red), their corresponding Lagrangian spiking point
 $\boldsymbol {r}_{sp}$ and curve
 $\gamma _{sc}$ (black), along with the larger principal curvature change
 ${}_2\bar {\kappa }_{0}^{5}$ shaded on representative material surfaces at
 $t=0$ and
 $t = 5$. The time evolution of the above panels, along with the
 $\bar {H}$ and
 $\bar {K}$ metrics, are available in supplementary movie 4.

This simple example illustrates the ability of our method to simultaneously detect 1-D and 2-D backbones of separation without a priori assumptions. In controlling general unsteady flows (e.g. aerodynamic applications subject to unknown external disturbances), one would ideally want a method that readily locates spike formation and informs the control action to mitigate flow separation at its onset. Specifically, identifying automatically the numbers and locations of forming spikes and their dimensions (one dimension and two dimensions) is relevant for designing optimal control strategies.
7.4. On-wall to off-wall separation
We consider a general unsteady flow generated by a rotating–translating cylinder, as shown in figure 6 with the parameters  $\varOmega = 3.5$,
 $U_0 =0.3$,
 $\beta =0.5$ and
 $\omega _c =2{\rm \pi} /5$. We extend the analytical solution to this creeping 2-D flow with components
 $[u,v]$ given in Appendix F to generate a 3-D velocity field given by
 $f_1 = u, f_2 = 0$ and
 $f_3 =v$. The initial position of the Lagrangian backbone of separation
 $\mathcal {B}(t_0)$ computed over a time interval
 $T =6$ is shown in red (figure 7a), along with
 $\gamma _{sc}$ (black) and the
 ${}_2\kappa _{0}^{6}$ field shaded on selected material surfaces. Here,
 $\mathcal {B}(t)$ and the advected material surfaces are shown in panel (b) at
 $t=3$ and (c) at
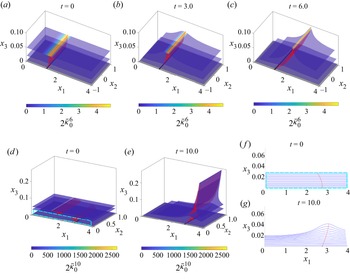
 $t = 6$. Over this time interval, the separation is fixed or on-wall, as a single continuous backbone connects to the wall at the spiking curve
 $\gamma {sc}$ (black). By contrast, for a longer time scale,
 $T = 10$, the Lagrangian backbone of separation
 $\mathcal {B}(t_0)$ becomes discontinuous (figure 7d,e).
Set-up of a flow separation induced by a rotating and translating cylinder. The analytical solution of the creeping flow generated by this set-up is in Appendix F.

Separation backbone generated by the flow described in § 7.4. (a–c) Change in the larger principal curvature  ${}_2\bar {\kappa }_{0}^{T}$ for
 $T=6$ shaded on a material surface at
 $t=0$,
 $t=3$ and
 $t=6$. (d,e) Same as (a–c) for
 $T=10$ shaded on material surfaces at
 $t=0$ and
 $t=10$. The Lagrangian backbone of separation
 $\mathcal {B}(t)$ is in red, and the Lagrangian spiking curve
 $\gamma _{sc}$ is in black. (f,g) Evolution of the material surfaces (blue) and the separation backbone (red) intersecting the
 $x_1-x_3$ plane in the close-to-wall region marked by the cyan rectangle in (d). The time evolution of the above panels, along with the
 $\bar {H}$ and
 $\bar {K}$ fields, are available in supplementary movie 5 for
 $T=6$ and in supplementary movie 6 for
 $T=10$.

Because the rotating cylinder moves towards larger  $x_1$ values, for longer time scales
 $T = 10$, the separation backbone loses its original footprint on the wall (
 $\gamma _{sc}$ in panels a–c) and develops two disconnected pieces. The lower backbone connecting to the wall uncovers a new spiking curve (
 $\gamma _{sc}$ in panels d–g), which serves as the on-wall footprint of the latest separation structure close to the wall. Figure 7(f,g) shows how the lower section of the
 $\mathcal {B}(t)$ acts as the centrepiece of the new spike formation close to the wall. In this case, we speak about moving separation. The upper part, in contrast, connects to the highest value of
 ${}_2\bar {\kappa }$ and acts as the centrepiece of the separation spike governed by the off-wall dynamics. This transition from on-wall (fixed) to off-wall (moving) separation and the ability to capture distinct separation structures over time is an automated outcome of our method – grounded on a curvature-based theory – which does not require any a priori assumptions. For a detailed discussion comparing our curvature-based theory and previous approaches to identify off-wall flow separation, see § 6.2.1 of Serra et al. (Reference Serra, Vétel and Haller2018).
The analytical, synthetic examples above show how our approach automatically (i) captures 1-D and 2-D separation backbones, (ii) discerns on-wall (fixed) to off-wall (moving) separation and (iii) locates previously unknown on-wall signatures of fixed separation. We now apply our approach to physical flow fields.
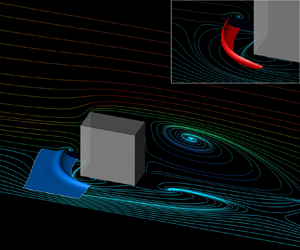
7.5. Steady flow past a cube
We consider a flow past a mounted cube of edge length  $h=1$, placed on the wall at
 $x_3 =0$ and centred at
 $x_1 = 4.5$ and
 $x_2 = 1.5$. We solve the incompressible Navier–Stokes equations at a Reynolds number
 $Re = U_{\infty }h/\nu = 200$, where
 $U_{\infty }$ is the free-stream velocity and
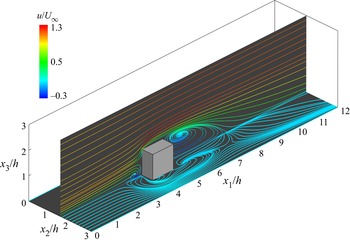
 $\nu$ the kinematic viscosity. Figure 8 shows the flow set-up and the velocity streamlines. Additional details regarding the numerical simulation are in Appendix G. We explore the separation dynamics in the region upstream of the mounted cube near the wall
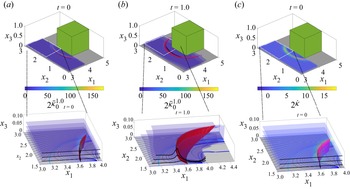
 $x_3 = 0$. Figure 9(a) shows the initial position of the Lagrangian backbone of separation
 $\mathcal {B}(0)$ (red) computed for the time interval
 $[0,1]$ and the corresponding
 ${}_2\kappa _{0}^{1}$ field shaded over selected material surfaces at the initial time. Figure 9(a,b) shows
 $\mathcal {B}(t)$ along with the
 ${}_2\kappa _{0}^{t}$ field shaded over material surfaces at
 $t = 0$ and
 $t = 1$. Panels (a,b) show again how
 $\mathcal {B}(t)$ acts as the centrepiece of the separation structure over time. The inset in (a,b) shows the geometry of the separation backbone and how the Lagrangian spiking curve (
 $\gamma _{sc}$) remains invisible to skin-friction streamlines (blue). Figure 9(c) shows the Eulerian backbone of separation
 $\mathcal {B}_E$ (magenta) and the rate of change of the largest principal curvature
 ${}_2\dot {\kappa }$ shaded on selected material surfaces. The inset in figure 9(d) shows the Eulerian spiking curve
 $\gamma _{scE}$(green) and the geometry of
 $\mathcal {B}_E(0)$. We can see that
 $\gamma _{scE}\equiv \gamma _{sc}$, which is true for all steady flows (cf. tables 1 and 3). As already found in two dimensions (figure 1 and Serra et al. Reference Serra, Vétel and Haller2018), the onset of separation is distinct from the on-wall footprint of the corresponding asymptotic structure.
Steady velocity field for the flow past a mounted cube described in Appendix G. The streamlines are coloured by the streamwise velocity component  $u/U_{\infty }$ in the
 $x_2 = 1.5h$ plane and the streamlines at
 $x_3 = 0$ correspond to skin-friction lines. Here,
 $U_{\infty }$ is the free-stream velocity and
 $h=1$ is the cube height.

Separation backbone generated by the flow past a cube described in § 7.5. (a,b) Value of  ${}_2\bar {\kappa }_{0}^{1}$ shaded on selected material surfaces at (a)
 $t=0$ and (b)
 $t=1$. The Lagrangian backbone of separation
 $\mathcal {B}(t)$ is in red, the black line on the wall marks the Lagrangian spiking curve
 $\gamma _{sc}$, and skin-friction lines are in blue. Skin (c)
 ${}_2\dot {\kappa }$ shaded on selected material surfaces. The Eulerian backbone of separation is in magenta, and the Eulerian spiking curve
 $\gamma _{scE}$ is in green. Insets show a zoomed view of the above panels and the limiting skin-friction line in light blue. Black lines at the edge of material surfaces aid visualization. The time evolution of the above panels, along with the
 $\bar {H}$ and
 $\bar {K}$ metrics, are available in supplementary movie 7.

7.6. Steady laminar separation bubble flow
We consider a steady, laminar separation bubble (LSB) on a flat plate with a spanwise modulation. We use an eighth-order accurate discontinuous Galerkin spectral element method (Kopriva Reference Kopriva2009; Klose, Jacobs & Kopriva Reference Klose, Jacobs and Kopriva2020a) to discretize the compressible Navier–Stokes equations spatially. The Reynolds number is  $Re_{\delta _{{in}}^*} = U_\infty \delta _{{in}}^*/\nu = 500$, based on the free-stream velocity
 $U_\infty$, the height of the inflow boundary layer displacement thickness
 $\delta _{{in}}^*$ and the kinematic viscosity
 $\nu$. The free-stream Mach number is 0.3. The computational domain is
 $L_{x_1} \times L_{x_2} \times L_{x_3}= 200\delta _{{in}}^* \times 10\delta _{{in}}^* \times 15\delta _{{in}}^*$, where
 $x_1$,
 $x_2$ and
 $x_3$ are the streamwise, spanwise and transverse directions. We prescribe a Blasius profile at the inlet and outlet and set the wall to be isothermal. We prescribe a modified free-stream condition at the top boundary, with a suction profile for lateral velocity component similar to Alam & Sandham (Reference Alam and Sandham2000), to induce flow separation on the bottom wall. Figure 10(a) shows the streamlines of the flow in red and the skin-friction lines in blue. We refer to Appendix H for additional details on the set-up and the flow field.
(a) Flow field of the steady LSB. (b,c) Flow field of the unsteady, moving LSB at (b)  $t=100$ and (c)
 $t=110$. Slice colour map represents the streamwise velocity component
 $u/U_\infty$, streamlines are in red and skin-friction lines are in blue.

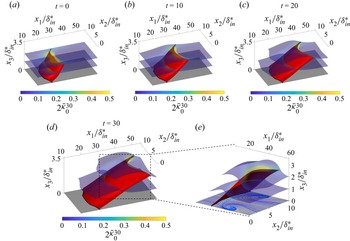
Figure 11 shows selected material sheets coloured by the curvature  ${}_2\bar {\kappa }_{0}^{30}$. The Lagrangian backbone of separation
 $\mathcal {B}(t)$ for the time interval
 $[0,30]$ is in red: its initial position is in panel (a), and its advected positions
 $\mathcal {B}(t)$ in panels (b–d), with a detailed plot in panel (e) showing skin-friction lines in blue. As already noted earlier, the Lagrangian spiking curve (black line)
 $\gamma _{sc}$ is located upstream of the limiting skin-friction line again, indicating that the onset of flow separation has a different location compared with the asymptotic separation structures, even in steady flows.
Lagrangian backbone of separation  $\mathcal {B}(t)$ (red) generated by a steady LSB on a flat plate with selected material sheets coloured by the
 ${}_2\bar {\kappa }_{0}^{30}$. The Lagrangian spiking curve
 $\gamma _{sc}$ is in black. Panels (a–d) show advected positions of the backbone
 $\mathcal {B}(t)$. (e) Detailed plot showing the same as (d) from a different view along with skin-friction lines in blue and the limiting skin-friction line in light blue. The time evolution of the above panels, along with the
 $\bar {H}$ and
 $\bar {K}$ metrics, are available in supplementary movie 8.

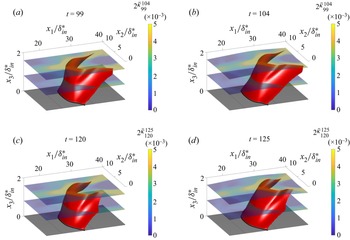
7.7. Unsteady, moving LSB flow
We consider the flow around a LSB on a flat plate with a spanwise modulation introduced in § 7.6, but with a time-periodic oscillation of the suction profile on the top boundary to induce unsteady movement of the bubble. The oscillation frequency is  $f=1/20$ and the magnitude is
 $10\delta _{{in}}^*$. Figure 10(b,c) illustrates the flow's streamlines and skin-friction lines. We perform a Lagrangian analysis over a time interval of
 $T=5$ convective time units starting at
 $t_0 = 99$ (figure 12a,b) and
 $t_0 = 120$ (figure 12c,d), hence compute the Lagrangian backbone of separation based on
 ${}_2\bar {\kappa }_{99}^{104}$ and
 ${}_2\bar {\kappa }_{120}^{125}$. Figure 12 highlights the time dependency of the Lagrangian separation backbone, with its shape and surface signature, i.e. the Lagrangian spiking curve
 $\gamma _{sc}$, being a function of
 $t_0$. The backbone and material sheets are shown at their initial positions (a,c) and final positions (b,d).
Moving LSB on a flat plate. The Lagrangian backbone of separation  $\mathcal {B}(t)$ based on
 ${}_2\bar {\kappa }_{99}^{104}$ (a,b),
 ${}_2\bar {\kappa }_{120}^{125}$ (c,d) are in red, along with selected material surfaces coloured by the respective
 ${}_2\bar {\kappa }$ fields, and the Lagrangian spiking curves
 $\gamma _{sc}$ (black). Panels (a,c) show the material surfaces and
 $\mathcal {B}(t)$ at the initial times, while panels (b,d) at the final times. The time evolution of the above panels, along with the
 $\bar {H}$ and
 $\bar {K}$ metrics, are available in supplementary movie 9 for
 $t\in [99,104]$ and supplementary movie 10 for
 $t\in [120,125]$.

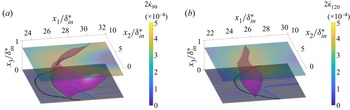
Last, figure 13 shows the Eulerian backbone of separation (magenta) at  $t_0=99$ and
 $t_0=120$, their Eulerian spiking curves
 $\gamma _{scE}$ (green) and the skin-friction lines (blue). For comparison, we also show the Lagrangian spiking curves
 $\gamma _{sc}$ (black) discussed in figure 12. The Eulerian backbone intersects the wall at a location different from the Lagrangian backbone of separation, consistent with theoretical predictions (cf. §§ 4 and 5). Note that the scale of the axes in figure 13 is different to figure 12. Consistent with the earlier test cases, the backbones of separation we locate remain inaccessible to skin-friction lines while acting as the centrepieces of the forming material spikes.
Moving LSB on a flat plate. The Eulerian backbone of separation  $\mathcal {B}_E(t)$ is in magenta, the Eulerian spiking curve is in green and the Lagrangian spiking curves based on
 $_2\bar {\kappa }_{99}^{104}$ (a) and
 $_2\bar {\kappa }_{120}^{125}$ (b) are in black. Selected material sheets are coloured by
 ${}_2\dot {\kappa }_{99}$ (a) and
 ${}_2\dot {\kappa }_{120}$ (b). Skin-friction lines are in blue and the limiting skin-friction lines are in light blue.

8. Conclusions
We developed a frame-invariant theory of material spike formation during flow separation over a no-slip boundary in 3-D flows with any time dependence. Based on the larger principal curvature evolution of material surfaces, our theory uncovers the material spike formation from its birth to its developed Lagrangian structure. Curvature arises from an objective interplay of stretching- and rotation-based kinematic quantities, revealing features that remain hidden to criteria based only on stretching or rotation. Our kinematic theory applies to numerical, experimental or model velocity fields.
The backbone can be one- or two-dimensional, connected to the wall or not. When the backbones connect to the wall, we speak about fixed separation. Otherwise, it is a moving separation. For fixed separation, we have discovered new, distinct, wall locations called spiking points and spiking curves, where 1-D and 2-D backbones connect to the no-slip boundary. We provide criteria for identifying spiking curves and points using wall-based quantities. Remarkably, spiking points and curves remain invisible to classic skin-friction line plots even in steady flows.
Similarly to the spike formation in two dimensions (Serra et al. Reference Serra, Vétel and Haller2018), the spiking points and curves identified here are constant in steady flows and in time-periodic flows analysed over a time interval that is a multiple of their period. By contrast, they move in general unsteady flows. Our theory is also effective over short-time intervals and admits a rigorous instantaneous limit. These properties, inaccessible to existing criteria, make the present approach promising for monitoring and controlling separation. To mitigate flow separation in general unsteady flows, for example, we envision locating the Eulerian backbones of separation over time (see Appendix I for details) and inform the actuation strategy with the backbones’ on-wall footprints (i.e. the spiking points and curves). The number of spiking locations and their dimensions (one or two) provide essential geometric information to direct the control action toward the on-wall locations associated with the onset of separation. Interestingly, using data-driven methods, Bhattacharjee et al. (Reference Bhattacharjee, Klose, Jacobs and Hemati2020) showed that the optimal actuator place to mitigate separation is upstream of the asymptotic separation point on an airfoil, consistent with a 2-D spiking point location (Klose et al. Reference Klose, Serra and Jacobs2020b). Locating spiking points and curves using only wall-based quantities needs higher-order spatial derivatives of the velocity field. Estimating these derivatives requires dedicated filtering techniques. We have successfully identified spiking points in two dimensions (Klose et al. Reference Klose, Serra and Jacobs2020b) and expect the same approach to be effective in 3-D flows.
The backbone of separation we identify evolves materially under all flow conditions, serving as the core of the separating spike, a universally observed phenomenon unrelated to the flow's time dependence and the presence of singularities in the flow. Two natural next steps are using our results in active flow control strategies and understanding the dynamics or the hydrodynamic forces causing spike formation.
Supplementary movies
Supplementary movies are available at https://doi.org/10.1017/jfm.2023.559.
Funding
G.B.J. gratefully acknowledges the funding provided by the Air Force Office of Scientific Research under award number FA9550-21-1-0434. M.S. acknowledges support from the Hellman Foundation.
Declaration of interests
The authors report no conflict of interest.
Appendix A. Curvature of a material surface $\mathcal {M}(t)$

In this section, we define the quantities to describe the curvature and stretching of material surfaces  $\mathcal {M}(t)$. We use the same notation in § 3. The first fundamental form of
 $\mathcal {M}(t)$ can be computed as
 \begin{equation} {}_{1}\boldsymbol{\varGamma}_{t_0}^{t}(\,\boldsymbol{p})= \begin{pmatrix} \langle \hat{\boldsymbol{r}}_u, \hat{\boldsymbol{r}}_u\rangle & \langle \hat{\boldsymbol{r}}_u, \hat{\boldsymbol{r}}_v\rangle\\ \langle \hat{\boldsymbol{r}}_v, \hat{\boldsymbol{r}}_u\rangle & \langle \hat{\boldsymbol{r}}_v, \hat{\boldsymbol{r}}_v\rangle \end{pmatrix} =\begin{pmatrix} \langle\boldsymbol{r}_u(\,\boldsymbol{p}),C_{t_0}^{t} (\boldsymbol{r}(\,\boldsymbol{p})) \boldsymbol{r}_u(\,\boldsymbol{p})\rangle & \langle\boldsymbol{r}_u(\,\boldsymbol{p}),C_{t_0}^{t} (\boldsymbol{r}(\,\boldsymbol{p})) \boldsymbol{r}_v(\,\boldsymbol{p})\rangle \\ \langle\boldsymbol{r}_u(\,\boldsymbol{p}),C_{t_0}^{t} (\boldsymbol{r}(\,\boldsymbol{p})) \boldsymbol{r}_v(\,\boldsymbol{p})\rangle & \langle\boldsymbol{r}_v(\,\boldsymbol{p}),C_{t_0}^{t} (\boldsymbol{r}(\,\boldsymbol{p})) \boldsymbol{r}_v(\,\boldsymbol{p})\rangle \end{pmatrix}. \end{equation}
The second fundamental form of  $\mathcal {M}(t)$ is given by
 \begin{align} {}_{2}\boldsymbol{\varGamma}_{t_0}^{t}(\,\boldsymbol{p}) &= \begin{pmatrix} \langle\boldsymbol{n}_t, \hat{\boldsymbol{r}}_{uu}(\,\boldsymbol{p})\rangle & \langle\boldsymbol{n}_t, \hat{\boldsymbol{r}}_{uv}(\,\boldsymbol{p})\rangle \\ \langle\boldsymbol{n}_t, \hat{\boldsymbol{r}}_{uv}(\,\boldsymbol{p})\rangle & \langle\boldsymbol{n}_t, \hat{\boldsymbol{r}}_{vv}(\,\boldsymbol{p})\rangle \end{pmatrix} \nonumber\\ &= \begin{pmatrix} \langle\boldsymbol{n}_t, {\nabla}^2\boldsymbol{F}^{t}_{t_0}(\boldsymbol{r}(\,\boldsymbol{p})) \boldsymbol{r}_u\boldsymbol{r}_u+\boldsymbol{\nabla} \boldsymbol{F}_{t_0}^{t}(\boldsymbol{r}(\,\boldsymbol{p})) \boldsymbol{r}_{uu}\rangle & \langle\boldsymbol{n}_t, {\nabla}^2\boldsymbol{F}^{t}_{t_0}(\boldsymbol{r}(\,\boldsymbol{p})) \boldsymbol{r}_u\boldsymbol{r}_v+\boldsymbol{\nabla} \boldsymbol{F}_{t_0}^{t}(\boldsymbol{r}(\,\boldsymbol{p})) \boldsymbol{r}_{uv}\rangle\\ \langle\boldsymbol{n}_t, {\nabla}^2\boldsymbol{F}^{t}_{t_0}(\boldsymbol{r}(\,\boldsymbol{p}))\boldsymbol{r}_v\boldsymbol{r}_u+\boldsymbol{\nabla}\boldsymbol{F}_{t_0}^{t}(\boldsymbol{r}(\,\boldsymbol{p}))\boldsymbol{r}_{vu}\rangle & \langle\boldsymbol{n}_t, {\nabla}^2\boldsymbol{F}^{t}_{t_0}(\boldsymbol{r}(\,\boldsymbol{p}))\boldsymbol{r}_v\boldsymbol{r}_v+\boldsymbol{\nabla}\boldsymbol{F}_{t_0}^{t}(\boldsymbol{r}(\,\boldsymbol{p}))\boldsymbol{r}_{vv}\rangle \end{pmatrix}\nonumber\\ & =\boldsymbol{B}_{t_0}^{t}(\,\boldsymbol{p})+\boldsymbol{A}_{t_0}^{t} (\,\boldsymbol{p}), \end{align}
where  $[{\nabla }^2\boldsymbol {F}^t_{t_0}(\boldsymbol {r}(\,\boldsymbol {p})\boldsymbol {r}_u\boldsymbol {r}_v]_i = [{\nabla }^2\boldsymbol {F}^t_{t_0}(\boldsymbol {r})\boldsymbol {r}_{u}]_{ij} [\boldsymbol {r}_{v}]_{j}= \langle \boldsymbol {\nabla }[\boldsymbol {\nabla }\boldsymbol {F}^t_{t_0}(\boldsymbol {r})]_{ij},\boldsymbol {r}_{u}\rangle [\boldsymbol {r}_{v}]_{j}$ (
 $[{\nabla }^2\boldsymbol {F}^t_{t_0}(\boldsymbol {r})\boldsymbol {r}_{u}]_{ij}$ represents the directional derivatives of
 $[\boldsymbol {\nabla }\boldsymbol {F}^t_{t_0}(\boldsymbol {r})]_{ij}$ in the direction
 $\boldsymbol {r}_{u}$. We use the same notation in (B8)–(B11)) and
 $$\begin{gather} \boldsymbol{B}_{t_0}^{t}(\,\boldsymbol{p}) = \begin{pmatrix} \langle \boldsymbol{n}_t,{\nabla}^2\boldsymbol{F}^{t}_{t_0}(\boldsymbol{r}(\,\boldsymbol{p}))\boldsymbol{r}_u\boldsymbol{r}_u\rangle & \langle \boldsymbol{n}_t,{\nabla}^2\boldsymbol{F}^{t}_{t_0}(\boldsymbol{r}(\,\boldsymbol{p}))\boldsymbol{r}_u\boldsymbol{r}_v\rangle \\ \langle \boldsymbol{n}_t,{\nabla}^2\boldsymbol{F}^{t}_{t_0}(\boldsymbol{r}(\,\boldsymbol{p}))\boldsymbol{r}_v\boldsymbol{r}_u\rangle & \langle \boldsymbol{n}_t,{\nabla}^2\boldsymbol{F}^{t}_{t_0}(\boldsymbol{r}(\,\boldsymbol{p}))\boldsymbol{r}_v\boldsymbol{r}_v\rangle \end{pmatrix}, \end{gather}$$
 $$\begin{gather}\boldsymbol{A}_{t_0}^{t}(\,\boldsymbol{p}) = \begin{pmatrix} \langle \boldsymbol{n}_t,\boldsymbol{\nabla}\boldsymbol{F}_{t_0}^{t}(\boldsymbol{r}(\,\boldsymbol{p}))\boldsymbol{r}_{uu}\rangle & \langle \boldsymbol{n}_t,\boldsymbol{\nabla}\boldsymbol{F}_{t_0}^{t}(\boldsymbol{r}(\,\boldsymbol{p}))\boldsymbol{r}_{uv}\rangle \\ \langle \boldsymbol{n}_t,\boldsymbol{\nabla}\boldsymbol{F}_{t_0}^{t}(\boldsymbol{r}(\,\boldsymbol{p}))\boldsymbol{r}_{vu}\rangle & \langle \boldsymbol{n}_t,\boldsymbol{\nabla}\boldsymbol{F}_{t_0}^{t}(\boldsymbol{r}(\,\boldsymbol{p}))\boldsymbol{r}_{vv}\rangle \end{pmatrix}. \end{gather}$$
The Weingarten map of  $\mathcal {M}(t)$ is given by
 \begin{equation} \boldsymbol{W}_{t_0}^{t}(\,\boldsymbol{p}) = ({}_1\boldsymbol{\varGamma}(\,\boldsymbol{p}))^{-1}{}_2 \boldsymbol{\varGamma}_{t_0}^{t}(\,\boldsymbol{p}). \end{equation}
The principal curvatures  ${}_{1}\kappa _{t_0}^t(\boldsymbol {p},t)$ and
 ${}_{2}\kappa _{t_0}^t(\boldsymbol {p},t)$ are given by the eigenvalues of the Weingarten map
 $\boldsymbol {W}_{t_0}^{t}(\,\boldsymbol {p})$.
Appendix B. Proof of Theorem 1
Here, we derive the Lagrangian evolution of the Weingarten map along a material surface  $\mathcal {M}(t)$.
B.1. Material evolution of the Weingarten map
We expand (A4) as
 \begin{equation} \boldsymbol{A}_{t_0}^{t}(\,\boldsymbol{p}) = \frac{1}{J_{t_0}^{t}(\,\boldsymbol{p})}\left(\begin{matrix} \langle(\boldsymbol{\nabla}\boldsymbol{F}^t_{t_0}\boldsymbol{r}_u)\times(\boldsymbol{\nabla}\boldsymbol{F}^t_{t_0}\boldsymbol{r}_v),\boldsymbol{\nabla}\boldsymbol{F}^t_{t_0}\boldsymbol{r}_{uu}\rangle & \langle(\boldsymbol{\nabla}\boldsymbol{F}^t_{t_0}\boldsymbol{r}_u)\times(\boldsymbol{\nabla}\boldsymbol{F}^t_{t_0}\boldsymbol{r}_v),\boldsymbol{\nabla}\boldsymbol{F}^t_{t_0}\boldsymbol{r}_{uv}\rangle\\ \langle(\boldsymbol{\nabla}\boldsymbol{F}^t_{t_0}\boldsymbol{r}_u)\times(\boldsymbol{\nabla}\boldsymbol{F}^t_{t_0}\boldsymbol{r}_v),\boldsymbol{\nabla}\boldsymbol{F}^t_{t_0}\boldsymbol{r}_{vu}\rangle & \langle(\boldsymbol{\nabla}\boldsymbol{F}^t_{t_0}\boldsymbol{r}_u)\times(\boldsymbol{\nabla}\boldsymbol{F}^t_{t_0}\boldsymbol{r}_v),\boldsymbol{\nabla}\boldsymbol{F}^t_{t_0}\boldsymbol{r}_{vv}\rangle \end{matrix}\right),\end{equation}
where  $\boldsymbol {\nabla }\boldsymbol {F}^t_{t_0} = \boldsymbol {\nabla }\boldsymbol {F}^t_{t_0}(\boldsymbol {r}(\,\boldsymbol {p}))$ and
 $J_{t_0}^{t}(\,\boldsymbol {p}) = \sqrt {det({}_1\boldsymbol {\varGamma }(\,\boldsymbol {p})_{t_0}^{t})}$. We simplify (B1) as
 \begin{align} \boldsymbol{A}_{t_0}^{t}(\,\boldsymbol{p}) &= \frac{1}{J_{t_0}^{t}(\,\boldsymbol{p})}\left(\begin{matrix} \langle(\boldsymbol{\nabla}\boldsymbol{F}^t_{t_0}\boldsymbol{r}_u) \times(\boldsymbol{\nabla}\boldsymbol{F}^t_{t_0}\boldsymbol{r}_v), \boldsymbol{\nabla}\boldsymbol{F}^t_{t_0}\boldsymbol{r}_{uu}\rangle & \langle(\boldsymbol{\nabla}\boldsymbol{F}^t_{t_0}\boldsymbol{r}_u) \times(\boldsymbol{\nabla}\boldsymbol{F}^t_{t_0}\boldsymbol{r}_v), \boldsymbol{\nabla}\boldsymbol{F}^t_{t_0}\boldsymbol{r}_{uv}\rangle\\ \langle(\boldsymbol{\nabla}\boldsymbol{F}^t_{t_0}\boldsymbol{r}_u) \times(\boldsymbol{\nabla}\boldsymbol{F}^t_{t_0}\boldsymbol{r}_v),\boldsymbol{\nabla}\boldsymbol{F}^t_{t_0}\boldsymbol{r}_{vu}\rangle & \langle(\boldsymbol{\nabla}\boldsymbol{F}^t_{t_0}\boldsymbol{r}_u)\times(\boldsymbol{\nabla}\boldsymbol{F}^t_{t_0}\boldsymbol{r}_v),\boldsymbol{\nabla}\boldsymbol{F}^t_{t_0}\boldsymbol{r}_{vv}\rangle \end{matrix}\right) \nonumber\\ &= \frac{{\rm det}(\boldsymbol{\nabla}\boldsymbol{F}^t_{t_0}(\boldsymbol{r}(\,\boldsymbol{p})))}{J_{t_0}^{t}(\,\boldsymbol{p})}\begin{pmatrix} \langle\boldsymbol{r}_u\times \boldsymbol{r}_v, \boldsymbol{r}_{uu}\rangle & \langle\boldsymbol{r}_u\times \boldsymbol{r}_v, \boldsymbol{r}_{uv}\rangle \\ \langle\boldsymbol{r}_u\times\boldsymbol{r}_v, \boldsymbol{r}_{vu}\rangle & \langle\boldsymbol{r}_u\times \boldsymbol{r}_v,\boldsymbol{r}_{vv}\rangle \end{pmatrix}\nonumber\nonumber\\ &=\frac{J_{t_0}(\,\boldsymbol{p}){\rm det}(\boldsymbol{\nabla}\boldsymbol{F}^t_{t_0}(\boldsymbol{r}(\,\boldsymbol{p})))}{J_{t_0}^{t}(\,\boldsymbol{p})}\frac{1}{J_{t_0}(\,\boldsymbol{p})}\begin{pmatrix} \langle\boldsymbol{r}_u\times \boldsymbol{r}_v,\boldsymbol{r}_{uu}\rangle & \langle\boldsymbol{r}_u\times \boldsymbol{r}_v,\boldsymbol{r}_{uv}\rangle\\ \langle\boldsymbol{r}_u\times \boldsymbol{r}_v, \boldsymbol{r}_{vu}\rangle & \langle\boldsymbol{r}_u\times \boldsymbol{r}_v, \boldsymbol{r}_{vv}\rangle\\ \end{pmatrix}\nonumber\\ &=\frac{J_{t_0}(\,\boldsymbol{p}){\rm det}(\boldsymbol{\nabla} \boldsymbol{F}^t_{t_0}(\boldsymbol{r}(\,\boldsymbol{p})))}{J_{t_0}^{t} (\,\boldsymbol{p})}\boldsymbol{A}_{t_0}^{t_0}(\,\boldsymbol{p}). \end{align}
Because  $\boldsymbol {B}_{t_0}^{t_0}(\,\boldsymbol {p})$ =
 $\boldsymbol {0}$, using (A2), we have
 ${}_2\boldsymbol {\varGamma }_{t_0}(\,\boldsymbol {p}) = \boldsymbol {A}_{t_0}^{t_0}(\,\boldsymbol {p})$. Therefore
 ${}_2\boldsymbol {\varGamma }_{t_0}(\,\boldsymbol {p})$ is given by
 \begin{equation} {}_2\boldsymbol{\varGamma}_{t_0}^{t}(\,\boldsymbol{p}) =\frac{J_{t_0}(\,\boldsymbol{p}){\rm det}(\boldsymbol{\nabla} \boldsymbol{F}^t_{t_0}(\boldsymbol{r}(\,\boldsymbol{p})))}{J_{t_0}^{t} (\,\boldsymbol{p})}{}_2\boldsymbol{\varGamma}_{t_0}(\,\boldsymbol{p})+ \boldsymbol{B}_{t_0}^{t}(\,\boldsymbol{p}). \end{equation}
By substituting (B3) into the definition of the Weingarten map (A5), we obtain
 \begin{equation} \boldsymbol{W}_{t_0}^{t}(\,\boldsymbol{p}) = ({}_1 \boldsymbol{\varGamma}_{t_0}^{t}(\,\boldsymbol{p}))^{-1}{}_1 \boldsymbol{\varGamma}_{t_0}(\,\boldsymbol{p}) \frac{J_{t_0}(\,\boldsymbol{p}) {\rm det}(\boldsymbol{\nabla} \boldsymbol{F}^t_{t_0}(\boldsymbol{r}(\,\boldsymbol{p})))}{J_{t_0}^{t} (\,\boldsymbol{p})}\boldsymbol{W}_{t_0}(\,\boldsymbol{p})+({}_1 \boldsymbol{\varGamma}_{t_0}^{t}(\,\boldsymbol{p}))^{-1} \boldsymbol{B}_{t_0}^{t}(\,\boldsymbol{p}). \end{equation}
B.2. Rate of change of the Weingarten map of a material surface
We take the total time derivative  $({\textrm {d}}/{\textrm {d} t})({\cdot }):= \dot {({\cdot })}$ of (B4) and evaluate it at
 $t =t_0$. For clarity, we calculate the time derivatives of each term separately:
 \begin{align} \dot{\overline{\text{det}(\boldsymbol{\nabla}\boldsymbol{F}_{t_0}^{t} (\boldsymbol{r}(\,\boldsymbol{p}))}}\vert_{t_0} &=\boldsymbol{\nabla} \boldsymbol{\cdot}\boldsymbol{f}(\boldsymbol{r}(\,\boldsymbol{p}),t_0), \end{align}
 \begin{align} \dot{\overline{J_{t_0}^{t}(\,\boldsymbol{p})}\vert_{t_0}} &=\frac{1}{J_{t_0}(\,\boldsymbol{p})}(\langle\boldsymbol{r}_{u}, \boldsymbol{S}(\boldsymbol{r}(\,\boldsymbol{p}),t_0)\boldsymbol{r}_{u} \rangle\langle\boldsymbol{r}_{v},\boldsymbol{r}_{v}\rangle+ \langle\boldsymbol{r}_{v},\boldsymbol{S}(\boldsymbol{r}(\,\boldsymbol{p}), t_0)\boldsymbol{r}_{v}\rangle\langle\boldsymbol{r}_{u},\boldsymbol{r}_{u} \rangle,\nonumber\\ &\quad-2\langle\boldsymbol{r}_{u},\boldsymbol{S}(\boldsymbol{r} (\,\boldsymbol{p}),t_0)\boldsymbol{r}_{v}\rangle\langle\boldsymbol{r}_{u}, \boldsymbol{r}_{v}\rangle)\nonumber\\ &= \frac{\alpha_{t_0}}{J_{t_0}(\,\boldsymbol{p})}, \end{align}
where  $\alpha _{t_0} = \langle \boldsymbol {r}_{u},\boldsymbol {S}(\boldsymbol {r}(\,\boldsymbol {p}))\boldsymbol {r}_{u}\rangle \langle \boldsymbol {r}_{v},\boldsymbol {r}_{v}\rangle +\langle \boldsymbol {r}_{v},\boldsymbol {S}(\boldsymbol {r}(\,\boldsymbol {p}),t_0)\boldsymbol {r}_{v}\rangle \langle \boldsymbol {r}_{u},\boldsymbol {r}_{u}\rangle -2\langle \boldsymbol {r}_{u},\boldsymbol {S}(\boldsymbol {r}(\,\boldsymbol {p}),t_0)\boldsymbol {r}_{v}\rangle \langle \boldsymbol {r}_{u},\boldsymbol {r}_{v}\rangle$,
 $$\begin{gather} \dot{\overline{\boldsymbol{C}^t_{t_0}}}\vert_{t_0}= 2\boldsymbol{S}(\boldsymbol{r}(\,\boldsymbol{p}),t_0), \end{gather}$$
 $$\begin{gather}\dot{\overline{\boldsymbol{B}_{t_0}^{t}}}\vert_{t_0} = \begin{pmatrix} \langle\boldsymbol{n}_{t_0},\nabla^2\boldsymbol{f}(\boldsymbol{r} (\,\boldsymbol{p}),t_0)\boldsymbol{r}_{u}\boldsymbol{r}_{u}\rangle & \langle\boldsymbol{n}_{t_0},\nabla^2\boldsymbol{f}(\boldsymbol{r} (\,\boldsymbol{p}),t_0)\boldsymbol{r}_{u}\boldsymbol{r}_{v}\rangle,\\ \langle\boldsymbol{n}_{t_0},\nabla^2\boldsymbol{f}(\boldsymbol{r} (\,\boldsymbol{p}),t_0)\boldsymbol{r}_{v}\boldsymbol{r}_{u}\rangle & \langle\boldsymbol{n}_{t_0},\nabla^2\boldsymbol{f}(\boldsymbol{r} (\,\boldsymbol{p}),t_0)\boldsymbol{r}_{v}\boldsymbol{r}_{v}\rangle \end{pmatrix}, \end{gather}$$
 $$\begin{gather}\dot{\overline{({}_1\boldsymbol{\varGamma}_{t_0}^{t}(\,\boldsymbol{p})^{-1})}} \vert_{t_0} =-\frac{2\alpha_{t_0}}{J_{t_0}^2(\,\boldsymbol{p})}({}_1 \boldsymbol{\varGamma}_{t_0}(\,\boldsymbol{p}))^{-1}+\frac{2}{J_{t_0}^2 (\,\boldsymbol{p})}\boldsymbol{D}(\boldsymbol{p},t_0), \end{gather}$$
 $$\begin{gather}\boldsymbol{D}(\boldsymbol{p}, t_0) = \left(\begin{matrix} \langle\boldsymbol{r}_v,\boldsymbol{S}(\boldsymbol{r}(\,\boldsymbol{p}),t_0) \boldsymbol{r}_v\rangle & -\langle\boldsymbol{r}_u,\boldsymbol{S} (\boldsymbol{r}(\,\boldsymbol{p}),t_0)\boldsymbol{r}_v\rangle\\ -\langle\boldsymbol{r}_u,\boldsymbol{S}(\boldsymbol{r}(\,\boldsymbol{p}), t_0)\boldsymbol{r}_v\rangle & \langle\boldsymbol{r}_u,\boldsymbol{S} (\boldsymbol{r}(\,\boldsymbol{p}),t_0)\boldsymbol{r}_u\rangle \end{matrix}\right). \end{gather}$$
We can rewrite  $\dot {\bar {\boldsymbol {B}}}\vert _{t_0}$ in terms of the gradients of the rate-of-strain tensor and vorticity as
 \begin{equation} {\nabla}^2\boldsymbol{f}(\boldsymbol{r}(\,\boldsymbol{p}),t_0) =\boldsymbol{\nabla}\boldsymbol{S}(\boldsymbol{r}(\,\boldsymbol{p}),t_0)+ \boldsymbol{\nabla}\boldsymbol{\varOmega}(\boldsymbol{r} (\,\boldsymbol{p}),t_0). \end{equation}
 \begin{align} \dot{\overline{\boldsymbol{B}_{t_0}^{t}}}\vert_{t_0} &= \underbrace{\left(\begin{matrix} \langle\boldsymbol{n}_{t_0},\boldsymbol{\nabla}\boldsymbol{S}(\boldsymbol{r}(\,\boldsymbol{p}),t_0)\boldsymbol{r}_{u}\boldsymbol{r}_{u}\rangle & \langle\boldsymbol{n}_{t_0},\boldsymbol{\nabla}\boldsymbol{S}(\boldsymbol{r}(\,\boldsymbol{p}),t_0)\boldsymbol{r}_{u}\boldsymbol{r}_{v}\rangle\\ \langle\boldsymbol{n}_{t_0},\boldsymbol{\nabla}\boldsymbol{S}(\boldsymbol{r}(\,\boldsymbol{p}),t_0)\boldsymbol{r}_{v}\boldsymbol{r}_{u}\rangle & \langle\boldsymbol{n}_{t_0},\boldsymbol{\nabla}\boldsymbol{S}(\boldsymbol{r}(\,\boldsymbol{p}),t_0)\boldsymbol{r}_{v}\boldsymbol{r}_{v}\rangle\end{matrix}\right)}_{\boldsymbol{M}(\boldsymbol{p},t_0)}\nonumber\\ &\quad + \underbrace{\left(\begin{matrix} \langle\boldsymbol{n}_{t_0},\boldsymbol{\nabla}\boldsymbol{\varOmega}(\boldsymbol{r}(\,\boldsymbol{p}),t_0)\boldsymbol{r}_{u}\boldsymbol{r}_{u}\rangle & \langle\boldsymbol{n}_{t_0},\boldsymbol{\nabla}\boldsymbol{\varOmega}(\boldsymbol{r}(\,\boldsymbol{p}),t_0)\boldsymbol{r}_{u}\boldsymbol{r}_{v}\rangle\\ \langle\boldsymbol{n}_{t_0},\boldsymbol{\nabla}\boldsymbol{\varOmega}(\boldsymbol{r}(\,\boldsymbol{p}),t_0)\boldsymbol{r}_{v}\boldsymbol{r}_{u}\rangle & \langle\boldsymbol{n}_{t_0},\boldsymbol{\nabla}\boldsymbol{\varOmega}(\boldsymbol{r}(\,\boldsymbol{p}),t_0)\boldsymbol{r}_{v}\boldsymbol{r}_{v}\rangle\end{matrix}\right)}_{\boldsymbol{N}(\boldsymbol{p},t_0)}. \end{align}
Using (B5)–(B12), we calculate the time derivative of the material evolution of the Weingarten map (B4) at  $t=t_0$, which is given by
 \begin{align} \dot{\boldsymbol{W}}_{t_0}(\,\boldsymbol{p})&= \underbrace{\left[\left( \boldsymbol{\nabla}\boldsymbol{\cdot}\boldsymbol{f}(\boldsymbol{r} (\,\boldsymbol{p}),t_0)-\frac{3\alpha_{t_0}(\,\boldsymbol{p})}{J_{t_0}^2 (\,\boldsymbol{p})}\right)\boldsymbol{I}+\frac{2\boldsymbol{D} (\boldsymbol{p},t_0){}_1\boldsymbol{\varGamma}_{t_0} (\,\boldsymbol{p})}{J_{t_0}^2(\,\boldsymbol{p})}\right] \boldsymbol{W}_{t_0}}_{\dot{\boldsymbol{W}}_{I}}\nonumber\\ &\quad +\underbrace{({}_1\boldsymbol{\varGamma}_{t_0} (\,\boldsymbol{p}))^{-1}\boldsymbol{M}(\boldsymbol{p}, t_0)}_{{\dot{\boldsymbol{W}}_{II}}}+\underbrace{({}_1 \boldsymbol{\varGamma}_{t_0}(\boldsymbol{p }))^{-1}\boldsymbol{N}_{t_0}}_{\dot{\boldsymbol{W}}_{III}}. \end{align}
Appendix C. The value of $\boldsymbol {W}_{t_0}^t(\,\boldsymbol {p})$ is invariant under changes of parametrization and Euclidean coordinate transformations

Here, we show that the folding of a material surface  $\boldsymbol {W}_{t_0}^t(\,\boldsymbol {p})$ (cf. (3.4)) is independent of parametrization, i.e. the choice of
 $\boldsymbol {r}(\,\boldsymbol {p})$ (cf. (3.1)), as well as of Euclidean coordinate changes of the form
 \begin{equation} \tilde{\boldsymbol{x}}=\boldsymbol{Q}(t)\boldsymbol{x}+\boldsymbol{b}(t), \end{equation}
where  $\boldsymbol {Q}(t)\in SO(3)$ and
 $\boldsymbol {b}(t)\in \mathbb {R}^{3}$ are smooth functions of time. The invariance of
 $\boldsymbol {W}_{t_0}^t(\,\boldsymbol {p})$ implies that
 $\tilde{\boldsymbol{W}}_{t_0}^t(\,\boldsymbol {p})=\boldsymbol {W}_{t_0}^t(\,\boldsymbol {p})$, where
 $\widetilde {({\cdot })}$ denotes quantities expressed as a function of the new
 $\tilde {\boldsymbol {x}}-$coordinate, and
 $({\cdot })$ the same quantity expressed in terms of the original
 $\boldsymbol {x}-$coordinate. We note that this is a stronger property than objectivity (Truesdell & Noll Reference Truesdell and Noll2004).
To show this invariance, it suffices to note that  $\boldsymbol {W}_{t_0}^t(\,\boldsymbol {p})$ is the Weingarten map of a surface
 $\mathcal {M}(t)$ parametrized by
 $\hat {\boldsymbol {r}}_{t_0}^t(\,\boldsymbol {p})=\boldsymbol {F}_{t_0}^t[\boldsymbol {r}(\,\boldsymbol {p})]$ ((3.1) and figure 2a), and recall that the Weingarten map is independent of the parametrization
 $\hat {\boldsymbol {r}}_{t_0}^t(\,\boldsymbol {p})$ (Kuhnel & Hunt Reference Kuhnel and Hunt2015). This property still holds in our context where
 $\hat {\boldsymbol {r}}_{t_0}^t(\,\boldsymbol {p})$ is a composition of the parametrization of the initial surface
 $\mathcal {M}(t_0)$ and the action of
 $\boldsymbol {F}_{t_0}^t$, which is affected by (3.10). This completes the proof of Proposition 1.
Appendix D. Lagrangian spiking points and curves
Here, we derive the analytical expressions for the Lagrangian spiking point  $\boldsymbol {r}_{sp} = \boldsymbol {r}(\boldsymbol {p}_{sp})$ and Lagrangian spiking curve
 $\gamma _{sc} = \boldsymbol {r}(\boldsymbol {p}_{sc})$, i.e. where the Lagrangian backbone of separation
 $\mathcal {B}(t_0)$ connects with the wall.
D.1. Compressible flows
Because of the no-slip condition, the wall is invariant, which implies
 \begin{equation} \bar{\boldsymbol{W}}_{t_0}^{t}(\boldsymbol{r_{\eta=0}}(\,\boldsymbol{p})) = \boldsymbol{0}. \end{equation}
Therefore, to identify  $\boldsymbol {p}_{sp}$ and
 $\boldsymbol {p}_{sc}$, we derive the Weingarten map infinitesimally close to the wall
 $\bar {\boldsymbol {W}}_{t_0}^{t}(\boldsymbol {r_{\eta =\delta \eta }}(\,\boldsymbol {p}))$ by Taylor expanding
 $\bar {\boldsymbol {W}}_{t_0}^{t}(\boldsymbol {r_{\eta }}(\,\boldsymbol {p}))$ along
 $\eta$ and using (D1), which gives
 \begin{equation} \bar{\boldsymbol{W}}_{t_0}^{t}(\boldsymbol{r_{\delta\eta}}(\,\boldsymbol{p})) = \underbrace{\partial_{\eta}\bar{\boldsymbol{W}}_{t_0}^{t}(\boldsymbol{r_{\eta}}(\,\boldsymbol{p}))\vert_{\eta=0}}_{\partial_{\eta}\bar{\boldsymbol{W}}_{\eta}(\,\boldsymbol{p})\vert_{\eta=0}}\delta\eta + O(\delta\eta^2). \end{equation}
Using  $\partial _{\eta }\bar {\boldsymbol {W}}_{\eta }(\,\boldsymbol {p})\vert _{\eta =0}$, we calculate eigenvalues and eigenvectors of
 $\bar {\boldsymbol {W}}_{t_0}^{t}(\boldsymbol {r_{\delta \eta }}(\,\boldsymbol {p}))$ to the leading order in
 $\eta$. Therefore, we use (D2) and the criteria described in Proposition 2 to determine
 $\boldsymbol {p}_{sp}$ and
 $\boldsymbol {p}_{sc}$.
To gain further insight into  $\partial _{\eta }\bar {\boldsymbol {W}}_{\eta }(\,\boldsymbol {p})\vert _{\eta =0}$ we express it in terms of the spatial derivatives of Eulerian quantities
 \begin{equation} \partial_{\eta}\bar{\boldsymbol{W}}_{t_0}^{t} (\boldsymbol{r_{\eta}}(\,\boldsymbol{p}))\vert_{\eta=0} = \partial_{\eta}\int_{t_0}^{t} \dot{\bar{\boldsymbol{W}}}_{t_0}^{\tau} (\,\boldsymbol{p})\vert_{\eta=0}\, {\rm d} \tau = \int_{t_0}^{t} \partial_{\eta} \dot{\bar{\boldsymbol{W}}}_{t_0}^{\tau}(\,\boldsymbol{p})\vert_{\eta=0}\, {\rm d} \tau, \end{equation}
where  $\dot {\bar {\boldsymbol {W}}}_{t_0}^{t}(\,\boldsymbol {p})=\dot {\boldsymbol {W}}_{t_0}^{t}(\,\boldsymbol {p})$ (cf. (4.1a,b)) is evaluated along trajectories of (2.1a–d). Because of the no-slip condition on the wall, the convective term in the material derivative of
 $\dot {\bar {\boldsymbol {W}}}_{t_0}^{t}(\,\boldsymbol {p})$ is identically zero at
 $\eta =0$. Assuming a flat no-slip wall and using (D1) we have
 \begin{equation} \boldsymbol{W}_{t_0}^{t}(\boldsymbol{r_{\eta=0}}(\,\boldsymbol{p})) = \boldsymbol{0}. \end{equation}
Since the wall is a flat invariant set,  ${}_{1}\boldsymbol {\varGamma }_{t_0}^{t}(\,\boldsymbol {p})\vert _{\eta =0} = \boldsymbol {I}$. Using (D4) and (B4) we have
 \begin{equation} \boldsymbol{B}_{t_0}^{t}(\,\boldsymbol{p})\vert_{\eta=0} = \boldsymbol{0}. \end{equation}
Using (B4), (D4), (D5), and assuming a flat no-slip wall, we obtain
 \begin{equation}
\partial_{\eta}\bar{\boldsymbol{W}}_{t_0}^{t}(\,\boldsymbol{p})\vert_{\eta=0}
= \left(\begin{matrix} \displaystyle
\int^{t}_{t_0}\partial_{uu\eta}f_3(\boldsymbol{r}_{\eta}(\,\boldsymbol{p}),\tau)\vert_{\eta=0}\,
{\rm d} \tau & \displaystyle
\int^{t}_{t_0}\partial_{vu\eta}f_3(\boldsymbol{r}_{\eta}(\,\boldsymbol{p}),\tau)\vert_{\eta=0}\,
{\rm d} \tau\\
\displaystyle\int^{t}_{t_0}\partial_{uv\eta}f_3(\boldsymbol{r}_{\eta}(\,\boldsymbol{p}),\tau)\vert_{\eta=0}\,
{\rm d} \tau & \displaystyle
\int^{t}_{t_0}\partial_{vv\eta}f_3(\boldsymbol{r}_{\eta}(\,\boldsymbol{p}),\tau)\vert_{\eta=0}\,
{\rm d} \tau \end{matrix}\right).
\end{equation}
A similar expression can be obtained for curved boundaries.
D.2. Incompressible flows
In the case of incompressible flows, by differentiating the continuity equation and using the no-slip condition on the wall, we obtain
 \begin{equation} \partial_{uu}(\partial_u f_1+\partial_v f_2 + \partial_\eta f_3 )\vert_{\eta=0} = 0 \rightarrow \partial_{uu\eta}f_3\vert_{\eta=0} = 0. \end{equation}
Similarly, we can get  $\partial _{uv\eta }\,f_3\vert _{\eta =0} = \partial _{vv\eta }\,f_3\vert _{\eta =0}=0$, therefore we have
 \begin{equation} \partial_{\eta}\bar{\boldsymbol{W}}_{t_0}^{\tau} (\,\boldsymbol{p})\vert_{\eta=0} = \boldsymbol{0}. \end{equation}
Therefore the leading-order contribution in (D2) is  $O(\delta \eta ^2)$, which is given by
 \begin{equation} \bar{\boldsymbol{W}}_{t_0}^{t}(\boldsymbol{r_{\delta\eta}}(\,\boldsymbol{p})) = \underbrace{\partial_{\eta\eta}\bar{\boldsymbol{W}}_{t_0}^{t} (\boldsymbol{r_{\eta}}(\,\boldsymbol{p}))\vert_{\eta=0}}_{\partial_{\eta\eta} \bar{\boldsymbol{W}}_{\eta}(\,\boldsymbol{p})\vert_{\eta=0}} \frac{\delta\eta^2}{2}+ O(\delta\eta^3). \end{equation}
We can use  $\partial _{\eta \eta }\bar {\boldsymbol {W}}_{\eta }(\,\boldsymbol {p})\vert _{\eta =0}$ to compute the eigenvalues and eigenvectors of
 $\bar {\boldsymbol {W}}_{t_0}^{t}(\boldsymbol {r_{\delta \eta }}(\,\boldsymbol {p}))$ to the leading order in
 $\eta$. We express
 $\partial _{\eta \eta }\bar {\boldsymbol {W}}_{\eta }(\,\boldsymbol {p})\vert _{\eta =0}$ in terms of the spatial derivatives of Eulerian quantities as
 \begin{equation} \partial_{\eta\eta}\bar{\boldsymbol{W}}_{t_0}^{t}(\boldsymbol{r_{\eta}} (\,\boldsymbol{p}))\vert_{\eta=0} = \partial_{\eta\eta}\int_{t_0}^{t} \dot{\bar{\boldsymbol{W}}}_{t_0}^{\tau}(\,\boldsymbol{p})\vert_{\eta=0}\, {\rm d} \tau = \int_{t_0}^{t} \partial_{\eta\eta}\dot{\boldsymbol{W}}_{t_0}^{\tau}(\,\boldsymbol{p}) \vert_{\eta=0}\,{\rm d} \tau. \end{equation}
Using the same arguments as in Appendix D, we obtain
 \begin{equation} \partial_{\eta\eta}\bar{\boldsymbol{W}}_{t_0}^{t}(\,\boldsymbol{p})\vert_{\eta=0} = \left(\begin{matrix} \displaystyle\int^{t}_{t_0}\partial_{uu\eta\eta}f_3(\boldsymbol{r}_{\eta}(\,\boldsymbol{p}),\tau)\vert_{\eta=0}\, {\rm d} \tau & \displaystyle \int^{t}_{t_0}\partial_{vu\eta\eta}f_3(\boldsymbol{r}_{\eta}(\,\boldsymbol{p}),\tau)\vert_{\eta=0}\, {\rm d} \tau\\ \displaystyle\int^{t}_{t_0}\partial_{uv\eta\eta}f_3(\boldsymbol{r}_{\eta}(\,\boldsymbol{p}),\tau)\vert_{\eta=0}\, {\rm d} \tau & \displaystyle \int^{t}_{t_0}\partial_{vv\eta\eta}f_3(\boldsymbol{r}_{\eta}(\,\boldsymbol{p}),\tau)\vert_{\eta=0}\, {\rm d} \tau \end{matrix}\right). \end{equation}
Appendix E. Eulerian spiking point and curves
We derive analytical expressions for the Eulerian spiking point and curves similar to their Lagrangian counterparts in Appendix D. The Eulerian spiking point and curve is defined as the point or curve that connects the Eulerian backbone of separation  $\mathcal {B}(t)$ with the wall. Because the wall is an invariant set, we obtain
 \begin{equation} \dot{\boldsymbol{W}}_{t_0}^{t}(\boldsymbol{r_{\delta\eta}}(\,\boldsymbol{p})) = \underbrace{\partial_{\eta}\dot{\boldsymbol{W}}_{t_0}^{t}(\boldsymbol{r_{\eta}}(\,\boldsymbol{p}))\vert_{\eta=0}}_{\partial_{\eta}\dot{\boldsymbol{W}}_{\eta}(\,\boldsymbol{p})\vert_{\eta=0}}\delta\eta + O(\delta\eta^2). \end{equation}
To determine the Eulerian spiking point and curves, similar to Appendix D, we derive analytical expressions for the leading-order terms in  $\eta$ of
 $\dot {\boldsymbol {W}}_{t_0}^{t}(\boldsymbol {r_{\eta }}(\,\boldsymbol {p}))$ at
 $\vert _{\eta =0}$ for compressible and incompressible flows as
 $$\begin{gather} \text{compressible:}\ \partial_{\eta}\dot{\boldsymbol{W}}_{t_0}^{t}(\,\boldsymbol{p})\vert_{\eta=0} = \left(\begin{matrix} \partial_{uu\eta}f_3(\boldsymbol{r}_{\eta}(\,\boldsymbol{p}),t)\vert_{\eta=0} & \partial_{vu\eta}f_3(\boldsymbol{r}_{\eta}(\,\boldsymbol{p}),t)\vert_{\eta=0}\\ \partial_{uv\eta}f_3(\boldsymbol{r}_{\eta}(\,\boldsymbol{p}),t)\vert_{\eta=0} & \partial_{vv\eta}f_3(\boldsymbol{r}_{\eta}(\,\boldsymbol{p}),t)\vert_{\eta=0} \end{matrix}\right), \end{gather}$$
 $$\begin{gather}\text{incompressible:}\ \partial_{\eta\eta}\dot{\boldsymbol{W}}_{t_0}^{t}(\,\boldsymbol{p})\vert_{\eta=0} = \left(\begin{matrix} \partial_{uu\eta\eta}f_3(\boldsymbol{r}_{\eta}(\,\boldsymbol{p}),t)\vert_{\eta=0} & \partial_{vu\eta\eta}f_3(\boldsymbol{r}_{\eta}(\,\boldsymbol{p}),t)\vert_{\eta=0}\\ \partial_{uv\eta\eta}f_3(\boldsymbol{r}_{\eta}(\,\boldsymbol{p}),t)\vert_{\eta=0} & \partial_{vv\eta\eta}f_3(\boldsymbol{r}_{\eta}(\,\boldsymbol{p}),t)\vert_{\eta=0} \end{matrix}\right). \end{gather}$$
Comparing (E3) and (E2) with (D11) and (D6) shows that, for steady flows, the Eulerian spiking point and curve coincide with the Lagrangian spiking point and curve.
Appendix F. Creeping flow around a rotating cylinder
Klonowska-Prosnak & Prosnak (Reference Klonowska-Prosnak and Prosnak2001) derived an analytical solution of a creeping flow around a fixed rotating circular cylinder close to an infinite plane wall moving at a constant velocity (figure 6). If  $u$ and
 $v$ denote the velocity components along and normal to the wall, the solution is given by the following complex function:
 \begin{align} u(\zeta)-iv(\zeta)=&-\frac{U_w}{2\log a}\left[ 2\log\frac{\vert\varphi\vert}{a}+\frac{\mu}{2\varphi}(\zeta^*-\zeta)(\varphi -1)^2\right]\nonumber\\ &\quad +\sigma(\varphi-1)^2\left[ \frac{i\mu\zeta^*}{2}\left(\frac{a}{\varphi^2}+ \frac{1}{a}\right)-\frac{1}{\varphi}\left(a+\frac{1}{a}\right) +\frac{1}{2a}\left(\frac{a^2}{\varphi^2}-1\right)\right]\nonumber\\ &\quad +\sigma\left[ a+\frac{1}{a}+i\left(\frac{a}{\varphi^*} -\frac{\varphi^*}{a}\right)\right], \end{align}
where
 \begin{equation} i=\sqrt{-1},\quad \zeta=x+iy,\quad \varphi=\varphi(\zeta)=\frac{1+i\mu\zeta}{1+\mu\zeta}, \end{equation}
with  $({\cdot })^*$ denoting the complex conjugate operator. The constants
 $a,\mu$ and
 $\sigma$ describe the geometry and the kinematics of the cylinder, and are defined as
 \begin{align} a=\frac{R_c+y_c-\sqrt{y_c^2-R_c^2}}{R_c+y_c+\sqrt{y_c^2-R_c^2}},\enspace \ \mu=\frac{1}{\sqrt{y_c^2-R_c^2}},\quad \sigma=\frac{a}{a^2-1}\left(-\frac{U_w}{2\log a}+\frac{2\varOmega a^2}{\mu(a^2-1)^2}\right). \end{align}
In (F3a–c)  $U_w$ denotes the velocity of the wall and
 $R_c$ the radius of the cylinder initially centred at
 $(0,y_c)$, and rotating about its axis with angular velocity
 $\varOmega$. Following the procedure described in Miron & Vétel (Reference Miron and Vétel2015), by the linearity of Stokes flows, substituting
 $x$ and
 $u$ in (F1) with
 $x-U_wt-\tfrac {\beta }{\omega _c}\cos (\omega _ct)$ and
 $u-U_w$, we obtain the velocity field developing close to a rotating cylinder, whose centre moves parallel to a fixed wall with velocity
 $U_c=U_0+\beta \cos (\omega t)$, where
 $U_0=-U_w$.
Appendix G. Steady flow past a mounted cube
We consider the flow around a cube placed on a wall located at  $x_3=0$, with
 $h=1$ the length of the edge of the cube. The finite difference code Xcompact3d (Laizet & Lamballais Reference Laizet and Lamballais2009; Laizet & Li Reference Laizet and Li2011) was used to solve the incompressible Navier–Stokes equations at a Reynolds number
 $Re = U_{\infty }h/\nu = 200$, based on the free-stream velocity
 $U_{\infty }$,
 $h$ and the kinematic viscosity
 $\nu$. The computational domain is
 $L_{x_1} \times L_{x_2} \times L_{x_3} = 12h \times 3h \times 3h$, where
 $x_1$,
 $x_2$ and
 $x_3$ are the streamwise, spanwise and transverse direction, respectively. The cube is centred on
 $x_1=4.5h$ and
 $x_2=1.5h$. The domain is discretized on a Cartesian grid (stretched in the
 $x_3$-direction) of
 $481\times 129 \times 129$ points, with a sixth-order finite difference compact scheme in space, while the time integration is performed with a 3rd order Adams–Bashforth scheme with a time step
 $\varDelta t = 5 \times 10^{-5}h/U_{\infty }$. A specific immersed boundary method is used to model the solid cube and to impose a no-slip condition on its faces (Gautier, Laizet & Lamballais Reference Gautier, Laizet and Lamballais2014). At the bottom wall, a conventional no-slip condition is imposed, while at the top and lateral walls, a free-slip condition is chosen. A laminar Blasius velocity profile is prescribed at the inlet section, with a boundary layer thickness of
 $h/4$. Finally, at the outlet, a convective equation is solved.
Appendix H. Laminar separation bubble flow
The flat-plate LSB flow is computed using a high-order discontinuous Galerkin spectral element method (Kopriva Reference Kopriva2009; Klose et al. Reference Klose, Jacobs and Kopriva2020a) for the spatial discretization of the compressible Navier–Stokes equations and explicitly advanced in time with a fourth-order Runge–Kutta scheme. The solution is approximated on a seventh-order Legendre–Gauss polynomial basis yielding an 8th order accurate scheme. The computational domain is  $L_{x_1} \times L_{x_2} \times L_{x_3} = 200\delta _{{in}}^* \times 10\delta _{{in}}^* \times 15\delta _{{in}}^*$, discretized with a total of 9600 high-order elements (total of 4 915 200 degrees of freedom per equation). The Reynolds number is
 $Re_{\delta _{{in}}^*} = U_\infty \delta _{{in}}^*/\nu = 500$, based on the free-stream velocity
 $U_\infty$, the height of the inflow boundary layer displacement thickness
 $\delta _{{in}}^*$ and the kinematic viscosity
 $\nu$. The free-stream Mach number is 0.3. At the inlet and outlet, a Blasius profile, corrected for compressible flow, is prescribed and the wall is set to be isothermal. The inflow profile is modified by
 $U_{in} = U_{Blasius}(1 + 0.1\cos {(2{\rm \pi} x_2/L_{x_2})})$ to induce a spanwise modulation of the LSB. To avoid spurious oscillations at the outflow boundary, a spectral filter is applied for elements
 $x_1/\delta _{{in}}^*>160$. A modified free-stream condition is prescribed at the top boundary, with a suction profile for the lateral velocity component
 $S(x_1)/U_\infty =a_s\exp {[-b_s(x_1/\delta _{{in}}^*-c_s)]}$, according to Alam & Sandham (Reference Alam and Sandham2000), and a zero gradient for the streamwise component. The coefficients for the steady case are
 $a_s=1/5$,
 $b_s=1/50$ and
 $c_S=25$. For the unsteady case, the constant coefficient
 $c_s$ is replaced by a time-dependent function
 $c_s(t)=30 + 5 \sin {(2{\rm \pi} f t)}$ with
 $f=1/20$ to induce a periodically oscillating LSB. The Lagrangian fluid particles composing the material sheets are traced at run time with a third-order Adam–Bashforth scheme and the flow field is interpolated onto the particle positions using high-order Lagrange interpolation polynomials. Once the flow map is obtained, a smoothing operation is performed on Lagrangian curvature fields to filter out numerical noise.
Appendix I. Selection of $t_0$ and $T$ for computing the backbone of separation


In general unsteady flows  $\boldsymbol {f}(\boldsymbol {x},t)$, the flow map
 $\boldsymbol {F}_{t_0}^{t_0+T}$ depends on both the initial time
 $t_0$ and on the Lagrangian time interval
 $T$. Even if the final time
 $t_f = t_0+T$ is the same for different combinations of
 $t_0$ and
 $T$, the spike geometry as well as any Lagrangian analysis will be different, reflecting the appropriate features of
 $\boldsymbol {F}_{t_0}^{t_0+T}$. This differs in the case of steady or time-periodic flows. In practice, the selection of
 $t_0$ and
 $T$ depends on technical constraints and, or the separation analysis of interest. We provide two examples in which
 $t_0$ or
 $T$ should be fixed.
I.1. Active flow control in unsteady flows
There are several aerodynamic problems in which flow separation causes drops in performance or even catastrophic consequences. In these cases, unexpected external flow disturbances drive the system away from the desired working condition. Active flow control aims to design a controller that best prevents flow separation, given a set of available sensors and actuators. In this scenario, one would ideally consider a moving  $t_0$ corresponding with the current time,
 $T=0$, and design the controller to prevent the formation of an Eulerian backbone of separation, or minimize it in some metric. This ideal scenario would best prevent the formation of material spikes by continuously reacting to general (hence unsteady) perturbations.
Sensors and actuators, however, invariably introduce delays. These can be due to a minimum observation time required to provide the estimated flow velocity with the desired signal-to-noise ratio, or the minimum time needed for the actuators to provide a control action, etc. Considering these technical limitations and denoting the maximum of these delays by  $T_c$, the best (close to instantaneous) setting for active flow control would be computing the separation backbone over the moving time window [
 $t_0-T_c,t_0$].
I.2. On- and off-wall dynamics near a no-slip boundary
As a second problem, assume one wants to study the on- and off-wall separation dynamics in an unsteady flow near a no-slip boundary. For example, consider the flow generated by a rotating circular cylinder close to an infinite plane wall moving at a constant velocity analysed in § 7.4. By computing the Lagrangian backbone of separation over the time interval [ $t_0,t_0+T$], we observe that for small
 $T$, the separating backbone has a clear connection to the wall (cf. figure 7a–c). By contrast, for larger
 $T$, the motion of the same fluid patch becomes governed by the off-wall dynamics (cf. figure 7d,e), losing its connection to the near-wall backbone. Therefore, by analysing different increasing
 $T$, our theory can identify the transition between on-wall and off-wall separation without a priori assumptions. Here
 $t_0$ is fixed to the start of the experiment corresponding to the time when the cylinder starts moving from rest.