

1. Vibrational spectroscopy and its applications
Vibration spectroscopy is one of the most important tools for the accurate determination of molecular structure. This technique incorporating both infrared (IR) and Raman spectroscopy is the analysis of molecular properties based on vibrations at the molecular level and it is highly selective (Refs Reference Colthup, Daly and Wiberely1, Reference Diem2). Both of these types of spectroscopy have been used to provide complementary information about the molecular structure of different samples for over 70 years. The use of these techniques has increased substantially in the past 20 years because of advances in computational and optical instrumentation technology (Refs Reference Petrich3, Reference Mantsch, Choo-Smith and Shaw4, Reference Thygesen5). IR and Raman spectroscopy provide information on the chemical composition of all materials and can be used in chemical fingerprinting, particularly when they are combined with the Fourier transform (FT) system. A Fourier transform infrared (FT-IR) spectrometer collects an interferogram of a sample signal from an interferometer in order to obtain the IR spectrum of the sample, whereas Fourier transform Raman (FT-Raman) spectroscopy uses a laser beam to illuminate the sample and subsequently records the Raman scattering of the sample (Refs Reference Petrich3, Reference Mantsch, Choo-Smith and Shaw4, Reference Thygesen5, Reference Sathyanarayana6). When such FT instruments are also equipped with a computer system, weak signals can be measured faster and more sensitively than when using older dispersive instruments. A computerised FT instrument may also save the IR or Raman spectrum of a sample for subsequent data processing. Thus, the use of these advanced techniques to investigate the intact structural components of bio-samples is of interest to a wide range of researchers in the fields of biochemistry, biomedicine, biophysics and biomaterials (Refs Reference Gremlich and Yan7, Reference Crupi, Venuti and Majolino8, Reference Krafft9, Reference Lin, Li and Cheng10, Reference Lin11).
Although FT-IR and Raman spectroscopy measure the vibrational energies of molecules, both methods are dependent on different selection rules, i.e. an absorption process and a scattering effect, respectively. In FT-IR spectroscopy, the sample is radiated with IR light. Different chemical bonds absorb different IR wavelengths depending on which atoms are connected, the surrounding molecules and the type of vibration. In Raman spectroscopy, the sample is radiated with monochromatic visible or near-IR light from a laser, which brings the vibrational energy levels in the molecule to a short-lived, high-energy collision state that returns to a lower energy state after the emission of a photon (Refs Reference Colthup, Daly and Wiberely1, Reference Diem2, Reference Lin, Li and Cheng10). The emitted photon has a lower frequency than that of the laser light, and the difference between the frequency of the laser light and that of the scattered photon (called the Raman shift) corresponds to the frequency of the fundamental IR absorbance band of the bond. Thus both vibrational techniques may provide complementary information, because the shapes and positions of both spectral bands on the energy scale are closely located for the specific functional groups of the molecule (Refs Reference Colthup, Daly and Wiberely1, Reference Gremlich and Yan7, Reference Sathyanarayana6, Reference Lin, Li and Cheng10).
Between 1948 and 1952, scientists first reported the initial vibrational spectra of nucleic acids and polypeptides as well as the molecular structure of tissues determined using vibrational spectroscopic techniques (Refs Reference Blout and Fields12, Reference Blout and Mellors13, Reference Elliot and Ambrose14, Reference Woernley15). Vibrational spectroscopy allows the rapid and sensitive characterization of chemical samples and is entirely reliant on the vibrational signatures of the molecular fingerprint information present in bio-samples. More recently, FT-IR and Raman spectroscopy, used in conjunction with microscopes and computer systems, have been shown to be capable of microanalysis of minute samples using a dedicated detector, e.g. mercury cadmium telluride (MCT). These advanced FT-IR or Raman vibrational microspectroscopy techniques can provide further molecular information about samples at the microscopic level and with a high resolution. Microscopic samples can be nondestructively analysed by both types of vibrational microspectroscopy and this is particularly useful in the field of biomedical sciences (Refs Reference Wetzel and LeVine16, Reference Ellis and Goodacre17, Reference Krafft and Sergo18, Reference Walsh19, Reference Singh20).
Both types of vibrational microspectroscopy have significant benefits compared with other diagnostic techniques for noninvasively investigating the chemical components of ultrastructural tissues during various disease states. This is primarily because these microspectroscopic procedures do not require reagents, dyes, or labels to determine spectra (Refs Reference Mantsch, Choo-Smith and Shaw4, Reference Krafft9, Reference Krafft and Sergo18). Compared with conventional histopathologic diagnosis, microspectroscopic techniques have been found to be more objective and rapid. Because these two vibrational microspectroscopic methods can distinguish qualitative and quantitative differences in the spectral characteristics of many molecules, molecular and submolecular spectral profiles can be used to define and differentiate between diseased and healthy human tissues (Refs Reference Crupi, Venuti and Majolino8, Reference Krafft and Sergo18, Reference Singh20, Reference Clark and Hester21, Reference Kalasinsky, Marie Jenkins and Johnson22). In the field of biomedical diagnosis, many previous investigations have focused on discriminating between normal and malignant tissues at different sites such as oral, stomach, cervical, prostate, breast, skin, colon, and brain, using IR and Raman techniques (Refs Reference Mantsch, Choo-Smith and Shaw4, Reference Lin, Li and Cheng10, Reference Wetzel and LeVine16, Reference Ellis and Goodacre17, Reference Singh20, Reference Diem23, Reference Krafft24, Reference Severcan and Haris25, Reference Diem26, Reference Krafft and Bird27). Specifically, mineralised tissues found in vertebrates, whether they developed via normal physiologic or pathologic processes or not, contain an analogue of the naturally occurring mineral hydroxyapatite (HA) or other materials. These components are quite distinct and vibrational spectroscopy can easily be used to identify and study them (Refs Reference Carden and Morris28, Reference Adele and Richard29, Reference Boskey and Mendelsohn30).
2. Pathological calcification and apatite formation
Pathologic calcification is a lesion in which calcium salts are deposited abnormally in soft tissues (Refs Reference Lin, Li and Cheng10, Reference Black and Kanat31, Reference Golub32, Reference Chander and Gordon33, Reference Kirsch34). Ageing is known to be associated with an increased rate of abnormal mineralization (Refs Reference O'Flaherty35, Reference Tousimis and Schatten36, Reference Chen37). With age, the human body loses its ability to regulate calcium balance and subsequently undergoes systemic calcification. During this process, calcified deposits tend to accumulate in soft tissues throughout the body. Physiological mineralization usually occurs within hard tissues, whereas pathological calcification occurs in soft tissues. Pathological calcification is therefore recognised as a passive process resulting from injury, disease or old age (Refs Reference Orimo38, Reference Bazin39, Reference Bazin40). Many chronic diseases have been shown to be associated with calcification, including arterial stiffening, kidney/bladder/prostate stones, arthritis, cataracts, aortic valve stenosis, bone fractures, skin calcinosis and coronary atherosclerosis (Refs Reference Kart, Metress and Metress41, Reference Atzeni, Sarzi-Puttini and Bevilacqua42).
Calcium salt deposits in soft tissues other than bones and teeth gradually grow and aggregate into clusters, causing loss of flexibility and pliability of soft tissues, subsequently leading to sclerosis, thickening and/or deterioration (Refs Reference Kirsch43, Reference Peacock44). Abnormal calcification within soft tissues is an important structural or functional factor that causes many chronic diseases because of the induction of inflammation by mineral crystals (Refs Reference Golub32, Reference Kart, Metress and Metress41, Reference Atzeni, Sarzi-Puttini and Bevilacqua42, Reference Kirsch43, Reference Peacock44, Reference Masuda45). Calcification becomes a problem when its location, shape or size interferes with organ function. Almost all tissues, including those of the brain, eyes, dental pulp, salivary glands, heart, breast, liver, cholecysts, vessels, urinary system, skin, muscles, joints, and other parts of the body, are easily calcified. Of these, the skin, kidney, tendons and cardiovascular tissues appear to be particularly prone to mineralization (Refs Reference Lin11, Reference Golub32, Reference Giachelli46, Reference Bonucci47, Reference Kawasaki, Buchanan and Weiss48).
Calcium phosphates are the principal inorganic constituent of both normal and pathological calcifications in biological systems. Almost all hard tissues in the human body are made of phosphate minerals, and among these, HA predominates. HA is a naturally occurring mineral form of calcium apatite with the formula Ca10(PO4)6(OH)2. The OH− ion can be replaced by fluoride, chloride, or carbonate (Refs Reference Dorozhkin49, Reference Dorozhkin50). These biological apatites are not usually pure HA, but are calcium-deficient apatites with magnesium and carbonate as minor but important substituents (Ref. Reference Sader51). The apatite structure allows cationic (for Ca2+) and anionic (for PO43− and/or OH− groups) substitutions. Such substitutions affect the crystallography (crystal size, lattice parameters), physicochemical properties (e.g. solubility), and cell and tissue response (Ref. Reference Pan and Darvell52).
Magnesium (Mg2+) and carbonate (CO32−) are two minor but important elements associated with biological apatites (Ref. Reference Elliott and Elliott53); however, the extent of magnesium incorporation within the apatite lattice is very limited (Refs Reference LeGeros54, Reference Ren55). The incorporation of carbonate into apatite structure can influence the structure as well as the morphology of the apatite and is thought to alter the biological reactivity of the bone mineral (Ref. Reference Xu, Aksay and Groves56). The effect of CO32− substitution on the apatite lattice may be directly related to the dissolution-precipitation cycles that occur during bone tissue regeneration (Refs Reference Porter57, Reference Dorozhkin58). Biological apatite is usually referred to as carbonate apatite (Ref. Reference De Aza, De Aza and De Aza59). Carbonate can be incorporated into the apatite lattice (Ca10[PO4]6[OH]2) in the following ways: type A carbonate apatite, in which the OH− group is substituted by CO32−; type B carbonate apatite, in which the PO43− group is substituted by CO32−; and type L (labile) carbonate apatite, in which the carbonate is located within the surface hydration layer of the apatite crystals (Refs Reference Elliott, Holcomb and Young60, Reference LeGeros61, Reference Wopenka and Pasteris62, Reference Peroos, Du and De Leeuw63, Reference Kannan64). The incorporation of CO32− in the apatite lattice has been reported to cause a decrease in the crystal shape, resulting in significant differences in the specific area which contributed to the release of Ca2+ in the dissolution kinetics (Ref. Reference Sader51). In addition, carbonate apatites present higher solubility when compared to carbonate-free apatite because Ca-PO4 bonds are stronger than Ca-CO3 bonds, making the carbonate apatite more susceptible to acid dissolution (Ref. Reference Wopenka and Pasteris62). Typically, the carbonate content of mineral bone is dependent on age. The value of the type A:type B ratio in carbonate apatite is reported to increase with age in humans. Type A carbonate apatite is mostly found in old tissue, whereas type B is found in young tissue. Type B carbonate apatite is the most abundant apatite species in human bone (Refs Reference Rey65, Reference Landi66).
3. Calcinosis cutis
Calcinosis cutis (CC) is a term used to describe a group of disorders in which calcium deposits form on the skin and subcutaneous tissue (Refs Reference Walsh and Fairley67, Reference Fernandez-Flores68, Reference Reiter69). CC can be categorised into five major types based on the aetiology: dystrophic, metastatic, idiopathic, iatrogenic calcification and calciphylaxis (Fig. 1) (Ref. Reference Reiter69). Dystrophic calcification is the result of local tissue injury and/or a persisting local abnormality but with normal serum calcium and phosphate levels. Metastatic calcification is characterised by abnormal calcium and/or phosphate metabolism that leads to the precipitation of calcium within the cutaneous and subcutaneous tissues. Idiopathic CC is cutaneous calcification of unknown cause without any underlying tissue damage or metabolic disorder. Medical intervention can cause tissue damage or disturbances in calcium and phosphate metabolism which leads to iatrogenic calcification.
Classification of calcinosis cutis.

Calciphylaxis occurs because of the accumulation of small calcium deposits on the dermis and subcutaneous fatty tissue vessel walls. It is a rare fatal condition which is often associated with end-stage kidney disease and may also be variably classified as dystrophic or idiopathic CC (Refs Reference Fernandez-Flores68, Reference Bhambri and Del Rosso70).
Clinical diagnosis of CC is usually achieved via time-consuming histopathologic or immunohistochemical evaluation using several complex processes; however, it can only be empirically identified by experienced practitioners. The von Kossa stain is a well-known and widely used method to quantify mineralization in cell cultures and tissue sections (Refs Reference Meloan and Puchtler71, Reference Rungby72). In von Kossa staining, a water-soluble silver salt is added to the specimen to form silver phosphate, which is then photochemically reduced to silver metal, the characteristic black colour of which indicates the presence of bone mineral. However, von Kossa staining is not specific to detecting apatitic minerals and is subject to interference from any residual buffer phosphate or halide (e.g. chloride, fluoride) present in a specimen (Refs Reference Bonewald73, Reference Morris and Finney74). The interference problems are especially severe in cell cultures, where small, or even large, amounts of inorganic phosphates may be misidentified by staining (Ref. Reference Stewart75). However, FT-IR and Raman spectroscopy easily overcome these problems evidenced by many research articles (Refs Reference Lin, Li and Cheng10, Reference Lin11, Reference Ellis and Goodacre17, Reference Singh20, Reference Diem23, Reference Krafft24, Reference Severcan and Haris25, Reference Diem26, Reference Krafft and Bird27, Reference Eikje, Aizawa and Ozaki76, Reference Chiou77, Reference Kendall78, Reference Severcan79, Reference Tosi80).
4. Spectral diagnosis of CC by vibrational (micro)spectroscopy
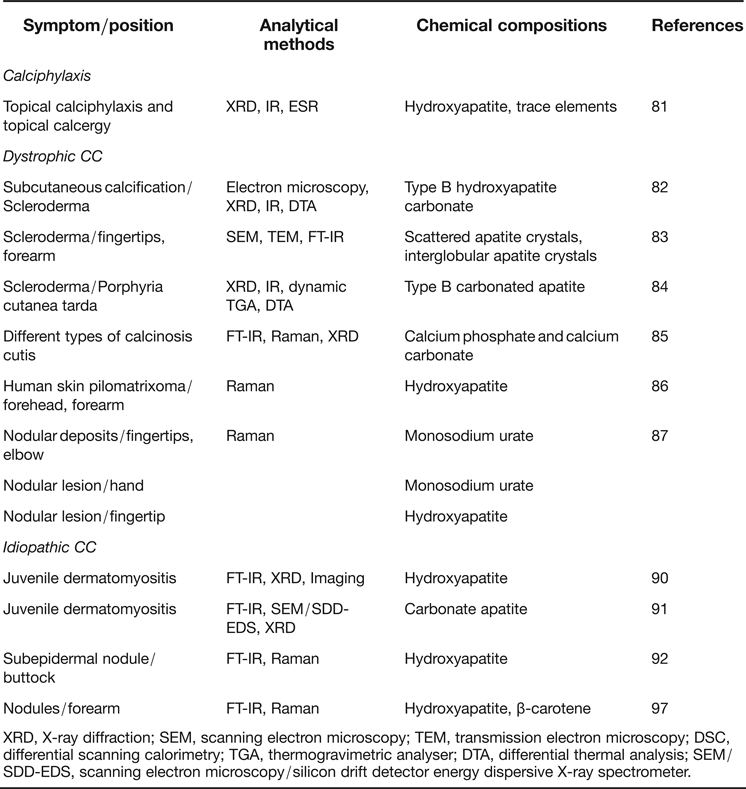
Since FT-IR and Raman spectroscopy are considered to be complementary techniques, in some cases that the combined application of both techniques has proved to be an invaluable method in the investigation of the exact information of molecular structural fingerprints of the calcified samples. In addition, Table 1 lists the chemical compositions of various skin calcified deposits detected by vibrational spectroscopy. Here, the applications of both advanced spectroscopic techniques to directly identify and diagnose the chemical composition of the calcified deposits in rats or the skin of patients with different subtypes are reviewed.
Examples of skin calcified deposits detected by vibrational spectroscopy

XRD, X-ray diffraction; SEM, scanning electron microscopy; TEM, transmission electron microscopy; DSC, differential scanning calorimetry; TGA, thermogravimetric analyser; DTA, differential thermal analysis; SEM/SDD-EDS, scanning electron microscopy/silicon drift detector energy dispersive X-ray spectrometer.
4.1 Calciphylaxis
Tochon-Danguy et al. (Ref. Reference Tochon-Danguy81) reported the mineral substances during the development of two experimental cutaneous calcifications in rats by topical calciphylaxis and topical calcergy. Using X-ray diffraction (XRD), IR spectrometry and electron spin resonance (ESR), they found that calcium phosphate deposits gradually transformed to HA during the first 20 days of calcinosis but there were no important modifications even at the later stages of the process. They also observed that the concentration of trace elements of Mg2+ and Fe2+ was higher in cutaneous calcinoses than in bone tissue.
4.2 Dystrophic calcification
Baldet et al. (Ref. Reference Baldet82) investigated the subcutaneous calcification in a human case of CRST syndrome using electron microscopy, XRD and IR spectroscopy. The results of XRD, IR spectroscopy and differential thermal analysis (DTA) showed that the deposits consisted of type B carbonate apatite. Upon electron microscopy, the calcifications were shown to comprise straight, needle-like crystals, 100–600 nm in length and 30–100 nm wide, characteristic of apatites. On the other hand, Daculsi et al. (Ref. Reference Daculsi, Faure and Kerebel83) used SEM and TEM microanalysis and IR spectroscopy to investigate a subcutaneous heterotopic calcification from a patient with Thibierge–Weissenbach's syndrome. It was demonstrated that these calcified materials were highly heterogeneous and appeared in a nonstoichiometric, carbonated, calcium ion-deficient apatitic solid phase. Three typical IR spectral peaks at 870, 1430 and 1455 cm−1, corresponding to a type B carbonate apatite, were defined. Dynamic thermogravimetry, XRD, IR spectroscopy and chemical analyses had also been carried out on the cutaneous calcifications found in a case of porphyria cutanea tarda (Ref. Reference Bettoli84). Bettoli et al. found that the IR absorption bands at 870 and 1455–1430 cm−1 in this patient were observed in the IR spectra of these deposits, suggesting that a partial substitution of CO32− for PO43− ions in the crystal lattice of HA had occurred (type B carbonate apatite).
Konno et al. (Ref. Reference Konno85) analysed the calcified materials from ten human cases of CC. All of the calcified materials were identified as HA by XRD examination. However, FT-IR and Raman spectral analyses of these specimens showed that each CC contained calcium phosphate and calcium carbonate, a finding that was confirmed by total carbon analysis. Thus, they concluded that the components of these calcified materials were mainly crystalline HA and amorphous calcium carbonate, rather than HA alone. This reveals that vibrational spectroscopy may have more benefits than XRD in the determination of the composition of samples, particularly the combined application of both techniques.
Cheng et al. (Ref. Reference Cheng86) used Raman microspectroscopy to analyse changes in the structural conformation and chemical composition of human skin pilomatrixoma (PMX) masses. Samples were taken from two patients diagnosed with typical PMX, in which one specimen was a soft mass and the other was a hard mass with somewhat calcified deposits (Fig. 2a and b). The differences between Raman peak intensity in the normal skin dermis and soft or hard PMX masses were obvious at 1622 to 1558, 1400 to 1230, 1128, 1000 to 850, 749, and 509 cm−1, as shown in Fig. 2c. The peak at 1665 cm−1 corresponding to the amide I band was shifted to 1655 cm−1 and the peak at 1246 cm−1 corresponding to the amide III band was reduced in its intensity in the hard PMX mass. The peak intensities of the Raman spectrum at 1622, 1588, 1398, 1339, 1309, 1128, 960, 749, and 509 cm−1 were stronger for soft or hard PMX mass. The higher content of tryptophan (749 cm−1) in the soft PMX mass and higher S–S disulfide formation (509 cm−1) in the hard PMX mass stood out. In particular, two weak peaks at 1081 and 960 cm−1 assigned to the stretching vibration of the PO43− in HA also appeared in the Raman spectra of both soft and hard PMX masses, suggesting the occurrence of cutaneous calcification of HA in the PMX tissue, particularly in the hard PMX mass. These results indicate that micro-Raman spectroscopy may provide a highly sensitive and specific method for identifying the normal skin dermis and how it differs in chemical composition from different PMX tissues.
Photographs of the excised soft mass (a) and hard mass (b) of PMX from two patients and their Raman spectra (c) as compared with normal skin dermis and HA after normalizing the peak intensity within the region of 1460–1448 cm−1 (modified from Ref. Reference Cheng86).
Gniadecka et al. (Ref. Reference Gniadecka87) used non-invasive Raman spectroscopy instead of the XRD method and routine histology to examine skin calcinosis in the intradermal nodules of three patients. They detected several new Raman spectral peaks at 1445 and 1420 cm−1 (C = N stretching), 1205 and 1060 cm−1 (C–O stretch and O–H bending), and 1010 cm−1 (ring vibration) in the Raman spectra of the nodular deposits in all fingertips of a patient with progressive kidney failure and in the nodular lesions and on the back of the hands of another patient who had undergone renal transplantation. These unique Raman peaks at 1445, 1420, 1205, 1060 and 1010 cm−1 were consistent with the Raman spectra of needle aspirate from these patients, attributed to the characteristic peaks of monosodium urate, as shown in Fig. 3a–d. On the other hand, an in vivo Raman spectrum obtained from the nodular lesions of the fingertips of a third patient was dominated by a peak at 960 cm−1, indicating a phosphate group in the HA deposit (Fig. 3e). In vitro examination of material expressed from the finger lesion showed an identical Raman pattern (Fig. 3f).
Raman spectra of the nodular lesions detected from patients 1–3 (a, b and e) and healthy skin from patient 2 (g). Spectra were also performed on a needle aspirate in patient 1 (c), a skin biopsy in patient 2 (d) and a calcified deposit in patient 3 (f) (modified from Ref. Reference Gniadecka87).
4.3 Idiopathic calcification
Juvenile dermatomyositis (JDM) is a systemic, autoimmune inflammatory muscle disorder and vasculopathy that affects younger children. JDM is often associated with CC, cutaneous ulcerations and vasculopathy characterised by intimal proliferation of small blood vessels and infarctions (Ref. Reference Rider and Miller88). JDM is sometimes called childhood idiopathic dermatomyositis. The cause of the disease is unknown and it appears to begin spontaneously (Ref. Reference Feldman89). The crystal structure and mineral content of the calcific deposits from five children with JDM (two boys and three girls) were examined by Pachman et al. (Ref. Reference Pachman90) using XRD, FT-IR spectroscopy and imaging. They found that the collagen crosslinking ratio of 1660 cm−1/1690 cm−1 (an indicator of collagen maturity) was slightly higher in the deposit than in bone and the maximum values were observed in the centre of the deposit rather than on the periphery. Additionally, the area ratio of carbonate (840–890 cm−1):phosphate (916–1180 cm−1) (an index of carbonate substitution) in the deposit mineral was comparable to that of bone. These results indicate that chronic cutaneous inflammation in children with JDM might contribute to the formation of HA. Eidelman et al. also found that the density of minerals present in the calcified skin deposits of JDM patients was most similar to that of enamel, but was clearly different to that of bone. Calcium and phosphate presented in diseased tissues might have been precipitated as carbonate apatite determined by FT-IR spectroscopy with reflectance mode (Ref. Reference Eidelman91). The apatite was much more crystallised than bone and dentin and its calcium:phosphate ratio was closer to that of stoichiometric HA. The deposit also contained magnesium and sodium.
Liu et al. (Ref. Reference Liu92) used both FT-IR and Raman microspectroscopic analyses to detect the chemical composition of a skin calcified deposit (SCD) excised from a protruding subepidermal calcified nodule on the left buttock (Fig. 4a) of a female patient. The result indicated that the whole SCD in the skin lesion was a well-developed, mature and hard mass (Fig. 4b). Several FT-IR absorption bands at 873 (870), 961 and 1031 cm−1 (the stretching modes of carbonate and phosphate in HA), and 1547 and 1658 cm−1 (the amide II and II bands of collagen) were detected in the IR spectrum of SCD (Fig. 4c). Although the Raman spectral bands at 1665 and 1450 cm−1 (collagen); 1519 and 1156 cm−1 (β-carotene); and 1450, 1072 and 958 cm−1 (HA) were also obtained (Fig. 4d). Information gained via both techniques may be used to elucidate all of the components of the SCD deposit in this patient.
Photographs of a protruding subepidermal calcified nodule on left buttock (a) and the isolated hard mass of a skin calcified deposit (b) of a female patient as well as the FT-IR (c) and Raman (d) spectra of this calcified deposit (modified from Ref. Reference Liu92).
In the process of biological mineralization, two IR spectral regions concerning the ν 1 and ν 3 phosphates (900–1200 cm−1), and the ν 2 carbonate (860–890 cm−1) of mineralised materials were observed from FT-IR spectroscopic examination. The predominate absorption bands at 961 and 1031 cm−1 corresponded to the ν 1 and ν 3 stretching modes of phosphate. It has been reported that a peak near 1020 cm−1 is attributed to the ν 3 vibration of PO43− in nonstoichiometric apatites but a peak at 1030 cm−1 is indicative of the ν 3 vibration of PO43− in stoichiometric apatites (Ref. Reference Penel93). The relative area ratio of 1020/1030 might provide a measure of mineral crystallinity and maturity (Ref. Reference Paschalis94). As shown in Fig. 4c, the appearance of a 1031 cm−1 peak in the IR spectrum of SCD might explain the mature, stoichiometric and crystalline properties of HA in the SCD sample.
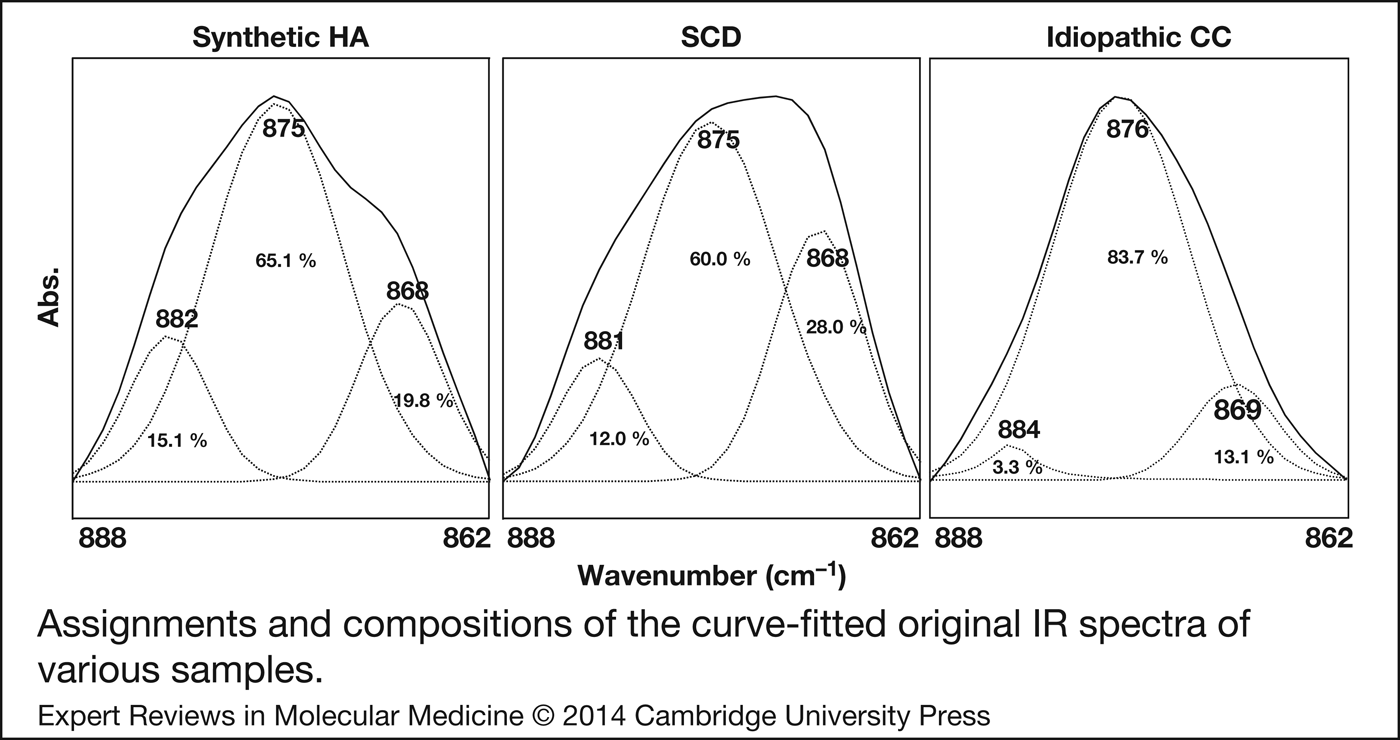
Additionally, it has been reported that the IR spectra of the carbonate apatite exhibited three components of the carbonate bands in the spectral region of 860–890 cm−1: 878 cm−1, type A carbonate apatite; 871 cm−1, type B carbonate apatite; and 866 cm−1, an unstable carbonate apatite, respectively (Refs Reference Rey65, Reference Rey95, Reference Fleet96). Liu et al. (Ref. Reference Liu92) also used a curve-fitting technique to investigate the carbonate substitutions within the HA structure. As shown in Fig. 5, three compositions in the IR spectrum of the synthetic HA reference sample were deduced using a curve-fitting analysis: 882 (15.1%), 875 (65.1%) and 868 (19.8%) cm−1. However, three compositions at 881 (12.0%), 875 (60.0%) and 868 (28.0%) cm−1 were obtained for the curve-fitted IR spectrum of SCD. Obviously, the strong peak at 875 cm−1 with a higher composition for the curve-fitted IR spectrum of SCD suggests that type B carbonate apatite was a predominant mature component in this SCD. However, a composition of about 28.0% for the peak at 868 cm−1, higher than that of 19.8% detected for the synthetic HA reference sample, was also observed. It has been reported that the peak at 869 cm−1 may be attributable to surface carbonate ions in an amorphous state that might reduce its intensity or content during the maturation of apatites. The higher content of this peak implies an incomplete process of calcification in this SCD.
Assignments and compositions of the curve-fitted original IR spectra of synthetic HA reference sample, and calcified deposits from excised from a protruding subepidermal calcified nodule of SCD patient and from nodules on the forearm of an idiopathic patient (modified from Refs Reference Liu92, Reference Niu97).
Niu et al. (Ref. Reference Niu97) found a rare idiopathic CC in a healthy five-year-old girl with multiple nodules on her forearm, as clearly shown in Fig. 6. In addition, the histopathological results also evidence that H&E staining demonstrated deep blue-purple aggregates and Von Kossa stain gave a black area for calcium in mass deposits, indicating that calcium deposits were interspersed within the region of brown and pink colour of non-calcified tissue.
Photographs of three hard nodules with plaques from the forearm of a child and the histopathological examinations with H&E and Von Kossa steins (modified from Ref. Reference Niu97).
They also used both FT-IR and Raman microscopic techniques to detect and identify the components of the calcified deposits. The FT-IR spectral results indicated several unique absorption bands at 876, 961, 1033, 1240, 1453, 1549, 1656, 1746, 2853 and 2925 cm−1 in the IR spectrum of the idiopathic calcified deposit (Fig. 7a). Here, the peaks at 876, 961 and 1033 cm−1 were probably because of the carbonate and phosphate stretching modes of HA, but the IR peaks at 1240, 1453, 1549, 1656, 1746, 2853 and 2925 cm−1 are because of the stretching vibrations of lipids and proteins similar to the IR spectrum of non-calcified tissue (Refs Reference Haris and Chapman98, Reference Jackson and Mantsch99). Moreover, it is evident that the IR peak at 1033 cm−1 assigned to the phosphate of HA was clearly found in the FT-IR spectrum of the calcified deposit, suggesting that the FT-IR spectrum of the calcified deposit was the superimposed IR spectrum of noncalcified tissue and HA. This strongly suggests that the apatite particles interspersing subcutaneous tissue were the predominant component of the calcified deposit in this patient with idiopathic CC.
FT-IR (a) and Raman (b) spectra of noncalcified tissue and calcified deposit of idiopathic patient, synthetic HA and β-carotene (modified from Ref. Reference Niu97).
On the other hand, the Raman spectrum of this calcified deposit of idiopathic CC was more clearly manifested by the presence of β-carotene, except in presence of HA (Fig. 7b). Two unique peaks at 961 and 587 cm−1 were found in the Raman spectrum of the calcified deposit, which were mainly because of ν 1 phosphate stretching of HA. Two strong peaks at 1516 (1523) and 1157 (1158) cm−1 corresponded to C = C and C-C stretching vibrations and a shoulder at 1009 (1006) cm−1, corresponding to the rocking motion of the methyl groups, was observed in both the Raman spectra of β-carotene and the calcified deposit (Refs Reference Ermakov100, Reference Hammond and Wooten101). This suggests that β-carotene was also contained in the calcified deposits of idiopathic CC. From the vibrational spectroscopic results, it is evident that the calcified deposit of idiopathic CC consisted of type B carbonate apatite, β-carotene and non-calcified tissue. In particular, the combination of FT-IR and Raman microscopic techniques was more useful than other methods for the simultaneous assessment of the intact components of the calcified deposits in idiopathic CC.
Furthermore, three components of the IR spectra of the calcified deposit of idiopathic CC were also quantitatively estimated using a curve-fitting analysis: 884 (3.3%), 876 (83.7%) and 869 (13.1%) cm−1 (Fig. 5). As compared with the results of synthetic HA and dystrophic CC, it is evident that the calcified deposit of idiopathic CC consisted of a relatively high proportion of type B carbonate apatite and lower proportion of type A carbonate apatite compared with the calcified deposits analysed in dystrophic CC. Since type B carbonate apatites with low crystalline order and small crystal size have been reported to be relatively soluble at an acidic pH and easy production near room temperature, the characteristics of type B carbonate apatite might provide a superior calcification process in idiopathic CC (Ref. Reference Frankenburg102).
5. Conclusions and future perspectives
This review summarises recent advances in vibrational spectroscopy and their impact on the diagnosis of calcified skin deposits in various skin diseases. Because both the FT-IR and Raman spectra of the mineral components are quite distinct, both vibrational techniques have been used as structural probes to study all of these mineralised tissues, providing information on the nature of the mineral phases, quantitative information on the changes in mineral and matrix composition during mineralisation, and the nature and amounts of substituents in the mineral (Refs Reference Carden and Morris28, Reference Adele and Richard29, Reference Boskey and Mendelsohn30). The recent advent of the use of vibrational imaging to investigate mineralised tissues is particularly exciting. This new method holds great promise for generating high-definition chemical-state images that may prove invaluable in the study of mineralised tissue physiology and even in clinical diagnostics (Refs Reference Carden and Morris28, Reference Li103, Reference Bhargava104).
Methods of coupling both types of vibrational microspectroscopy with modern fiberoptic probes have recently designed to directly reach less accessible organs and measure in vivo the spectra of various cells, tissues and organs in their most natural state in just a few seconds. This technique precludes the need for biopsy and can be easily used (Refs Reference Bindig105, Reference Motz106). Another new design for vibrational spectroscopic techniques is a combination of FT-IR and the Raman system. This FT-IR/Raman combination microprobe system enables simultaneous examination of one fixed sample area using both techniques, without the need for any sample positioning or instrument adjustment. This is a single microscope simultaneously coupled to an IR interferometer and a Raman spectrograph, in which the IR beams and laser are coincident on the sample and provide spectral information on the same material site (Refs Reference Adar107, Reference Krishna108). The increased popularity of these diagnostic tools over the last few years is a clear indication that FT-IR and Raman vibrational microspectroscopic techniques will soon become important clinical tools that complement the standard techniques currently used in various fields of clinical diagnosis (Refs Reference Singh20, Reference Krafft24, Reference Lasch and Knwipp109, Reference Srinivasan110). Furthermore, a newly developed Raman spectroscopy to probing deep areas of tissue both in vitro and in vivo facilitated by spatially offset Raman spectroscopy (SORS) and transmission Raman spectroscopy has also recently paved the way for deep non-invasive medical diagnosis (Refs Reference Surmacki, Musial, Kordek and Abramczyk111, Reference Matousek and Stone112, Reference Pelletier113, Reference Sharma114). It is optimistic that many other applications will be developed in the coming years.
Acknowledgements
The author would like to thank Drs. Liu MT, Liu HN, Niu DM, Pan CC, Yang DM, and Lin CC for their supporting the human samples and kindly comments. I would also like to thank Misses Cheng WT and Li MJ for their technical assistances in sample preparation and data collection. The spectral studies have been partly supported by the National Science Council, Taipei, Taiwan, Republic of China.
Financial support
This research received no specific grant from any funding agency, commercial or not-for-profit sectors.
Conflict of interest
None.