

Introduction
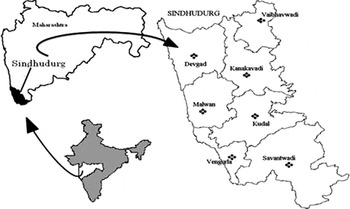
India possesses 21 recognized breeds of goats, which constitute 30 percent of the total goat population and the remaining 70 percent are non-descript with mixed features. These goat populations are distributed in different agro-climatic zones of the country. The diversity of goats in India is reflected by the fact that they have evolved and adapted under varied agro-climatic conditions, ranging from cold arctic (with −40 °C) to hot-humid tropical climate of coastal regions and dry-hot climate of Rajasthan (with 45 °C). The breeds are also diverse and specific in their performance traits such as production of the finest quality fibre by Pashmina goat, high prolificacy and quality meat in Black Bengal and the milk production of Jamunapari, Jakhrana, Barbari and Beetal goats. Among the non-descript goat populations Konkan Kanyal is one which is found in the Kudal, Sawantwadi, Dodamarg, Malvan and Vengurle Talukas of Sindhudurg district of Konkan region of Maharashtra state (Figure 1). About 11 800 goats exhibiting the Konkan Kanyal phenotype have been reported from Sindhudurg district. The flock size varied from 2 to over 100 but the proportion of Konkan Kanyal goats ranged from 14 to 68 percent (Verma et al., Reference Verma, Aggarwal, Dixit, Kawitkar, Dangi, Mishra and Joshi2011b). In a flock of Konkan Kanyal goats, the male–female ratio was 1:10. Natural service is practised to propagate the population. In the absence of true-type Konkan Kanyal buck, the mating takes place with the other type of buck. Since, Konkan Kanyal goats appeared phenotypically distinct from the Sangamneri and Osmanabadi goat breeds of Maharashtra, the characterization of these goats at phenotypic and genetic level is required. The Konkan Kanyal goats have been phenotypically characterized (Verma et al., Reference Verma, Aggarwal, Dixit, Kavitkar, Dangi, Kaur, Mishra and Joshi2010) but no information is available on its genetic aspects. The present study was carried out to assess the genetic variability of Konkan Kanyal goats of Maharashtra.
Breeding tract of Konkan Kanyal goats.

Materials and methods
DNA isolation
Blood samples of 50 animals belonging to 24 different flocks of Konkan Kanyal goat population were collected randomly from the breeding tract (Figure 1). Genomic DNA was isolated from these samples using a standard phenol-chloroform extraction method of Sambrook, Fritsch and Maniatis (Reference Sambrook, Fritsch and Maniatis1989). After testing the quality and quantity of the isolated DNA, the samples were used for amplification of microsatellite loci by the PCR method.
Microsatellite loci and PCR amplification
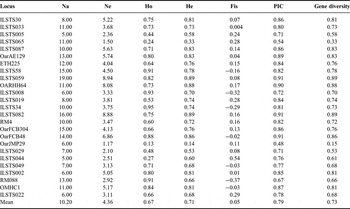
A battery of 25 microsatellite markers used to estimate different genetic parameters is given in Table 1. The panel of microsatellite markers used in this study has already been tested for genetic diversity estimation of Sirohi (Verma et al., Reference Verma, Dixit, Aggarwal, Chander, Kumar and Ahlawat2007), Changthangi (Priyanka et al., Reference Priyanka, Verma, Aggarwal and Dixit2010), Sangamneri (Verma et al., Reference Verma, Dixit, Aggarwal, Dangi and Joshi2011a), Kannaiadu (Dixit et al., Reference Dixit, Verma, Aggarwal, Vyas, Rana, Sharma and Chander2011) and Mehsana (Aggarwal et al., Reference Aggarwal, Dixit, Verma, Ahlawat, Kumar, Kumar, Chander and Singh2007). Amplifications for the loci were performed in a 10 µl final reaction volume containing 50 ng of genomic DNA, 10 pm of each primer, 10 mM dNTPs, 0.5 U Taq polymerase and 10 × buffer. The amplification was carried out for 35 cycles with initial denaturation at 95 °C for 10 min, second denaturation at 95 °C for 30 s, annealing with different temperatures for 1 min, extension for 45 s at 72 °C and final extension for 7 min at 72 °C. All the amplified products were separated by electrophoresis on 2 percent agarose gel. After ensuring the amplification on 2 percent agarose gel the PCR products were subjected to genotyping on automated DNA sequencer.
Genetic diversity and heterozygosity deficit in microsatellite loci.

Na = observed number of alleles; Ne = effective number of alleles; He = expected heterozygosity; Ho = observed heterozygosity; PIC = polymorphic information content; Fis = within population inbreeding.
Statistical analysis
Microsatellite data on genotyping were analysed to estimate the observed number of alleles, the expected number of alleles, observed heterozygosity and expected heterozygosity using POPGEN 32 diversity analysis software. The test of the departure from Hardy–Weinberg proportions was performed using exact probability tests provided in GENEPOP. Within population inbreeding estimates (Fst) at microsatellite loci were estimated using F-STAT (version 2.9.3). Neighbour-Joining diagrams were constructed on genetic distances within individuals using the Nei's distance (Saitou and Nei, Reference Saitou and Nei1987) by the PHYLIP package.
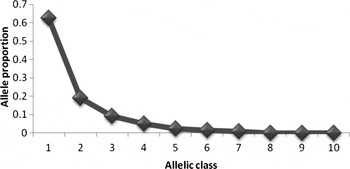
To evaluate whether the Konkan Kanyal goat has experienced a recent bottleneck, different approaches were followed. In the first approach three different tests: sign test, standardized differences test and Wilcoxon sign-rank test were employed under infinite allele model (IAM), stepwise mutation model (SMM) and two-phase model (TPM). These were used for the test of departure from mutation drift equilibrium based on heterozygosity excess or deficiency. The second approach was used to visualize the allele frequency spectra. The microsatellite alleles were classified into 10 frequency classes, which allow checking whether the distribution followed the normal L-shaped curve, where the alleles with low frequencies (0.01–0.1) are the most abundant.
Result and discussion
Phenotypic attributes
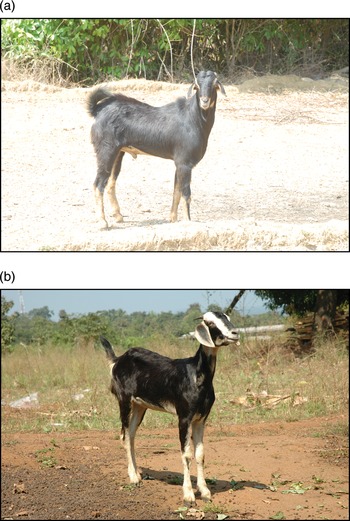
Konkan Kanyal goats are predominantly black in colour with white markings in a specific pattern. The white markings are on the collar, lower jaw and/or ventral surface (Figure 2). The head bears bilateral strips extending from the ears to the base of the nostrils. The muzzle is white crescent type. The ears are black with white margins, flat, long, drooping. The legs are long, laterally black, and medially white from the knee to the fetlock joint. These goats are regular breeders and breed round the year. The mean body weights range from 30 kg in adult females to 35 kg in males. The age at first kidding, kidding interval and twinning of these goats is 546 days, 240 days and 35 percent respectively. The average daily milk yield and lactation yield was found to be 0.6 and 69 kg respectively (Verma et al., Reference Verma, Aggarwal, Dixit, Kawitkar, Dangi, Mishra and Joshi2011b).
Konkan Kanyal male (A) and female (B).

Genetic variability
The genetic variability estimates in terms of the observed number of allele (Na), effective number of allele (Ne) and polymorphic information content (PIC), heterozygosities, within population inbreeding (Fis) and gene diversity are presented in Table 1. The effective number of alleles was less than the observed values across all the loci. The observed number of alleles varied from 5 (ILSTS08, ILSTS044) to 19 (ILSTS059) and a total of 255 alleles were observed with a mean of 10.2 alleles/locus which is higher than the Kannaiadu goat, Sangamneri and Osmanabadi goat breeds studied by Dixit et al. (Reference Dixit, Verma, Aggarwal, Vyas, Rana, Sharma, Tyagi, Arya and Ulmek2010), and than that of Sangamneri goat studied by Verma et al. (Reference Verma, Dixit, Aggarwal, Dangi and Joshi2011a). The effective number of alleles varied from 1.17 (OarJMP29) to 8.94 (ILSTS059) with a mean value of 4.36 which is higher than the Kannaiadu (4.22), Osmanabadi (3.25) and Sangamneri (3.30) studied by Dixit et al. (Reference Dixit, Verma, Aggarwal, Vyas, Rana, Sharma, Tyagi, Arya and Ulmek2010) and from Sangamneri (4.04) by Verma et al. (Reference Verma, Dixit, Aggarwal, Dangi and Joshi2011a). The mean polymorphism content was 0.79.
The mean observed and expected heterozygosities were found to be 0.67 and 0.71, respectively. The lowest observed heterozygosity value was 0.13 (OarJMP29) and the highest was 0.95 (ILSTS034). The expected heterozygosity ranged from 0.14 (OarJMP29) to 0.89 (ILSTS082 and ILSTS 059).
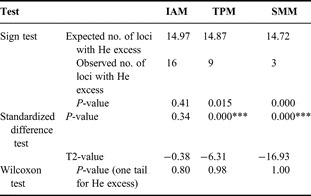
We utilized three tests viz: sign test (non-parametric), standardized differences test (parametric) and Wilcoxon test to test whether the Konkan Kanyal population is in mutation drift equilibrium. The estimated values obtained from these tests are given in Table 2. The sign test expected numbers of loci with heterozygosity excess were 14.97, 14.87 and 14.72 respectively whereas the observed numbers of loci with heterozygosity excess were 16, 9 and 3 for IAM (Kimura and Crow, Reference Kimura and Crow1964), TPM (Di Rienzo et al., Reference Di Rienzo, Peterson, Garza, Valdes, Slatkin and Freimer1994) and SMM (Ohta and Kimura, Reference Ohta and Kimura1973) respectively.
Different tests for null hypothesis for mutation drift equilibrium.

*** = P < 0.001
The difference between the expected and the observed heterozygosity excess was not significant in IAM and TPM, whereas this was significant for the heterozygote deficiency in SMM showing lack of severe reduction in effective population size. The standardized difference test (statistic T2) is equal to −0.38, −6.31 and −16.93 respectively for the IAM, TPM and SMM models in these goats. The values of TPM and SMM are less than 1.645 (value from table of normal distribution) and thus accept the null hypothesis of mutation-drift equilibrium. Similar results were obtained in the Wilcoxon sign rank test. The Mode Shift test allows to check whether the distribution followed the normal L-shaped curve depicted in the graph given below (Figure 3). Qualitative graphical methods based on the allele frequency spectra detected no shift in the frequency distribution of the alleles, where the alleles with the lowest frequencies (0.01–0.1) were found to be most abundant. This reflects that the population had not undergone bottleneck in recent past.
Mode shift analysis of Konkan Kanyal goat population.

The study indicated the genetic variability using molecular markers in Konkan Kanyal goat population of Maharashtra state. The different measures of genetic variation such as Na, Ne and PIC showed that all of the studied loci were highly informative, indicating high polymorphism across the loci, thus suggesting suitability of these markers for the study of genetic diversity in goats. Suitability of these markers was further supported by the fact that the number of alleles for each marker was higher than the minimum number of alleles (four) recommended for microsatellite markers to be used in the estimation of genetic distance in order to reduce the standard error. The F-statistics were applied to know the extent of inbreeding and outbreeding in the population (Table 1). The Fis value provides the non-random union of gametes in the population, i.e. the mating among the individuals in the population which is related more than average relationship. More the Fis value, more the inbreeding. The negative values of Fis point towards outbreeding, i.e. mating of individuals who are less related than the average relationship of the population. The mean number of alleles observed over a range of loci in different populations is considered to be a reasonable indicator of genetic variation within the population. This population of goat showed low effective number of alleles than the observed number. This is due to very low frequency of most of the alleles at each locus and very few alleles might have contributed to the major part of the allelic frequency at each locus. Another appropriate measure of genetic variation within a population is gene diversity (Table 1). The overall mean of gene diversity (0.73) was higher than the value reported in Gohilwadi (0.68) goats for the same panel of microsatellite markers (Kumar et al., Reference Kumar, Dixit, Verma, Singh, Pande, Kumar, Chander and Singh2009) and in Swiss goat breeds (0.58) for 20 microsatellite loci (Saitbekova et al., Reference Saitbekova, Gaillard, Obexer-Ruff and Dolf1999). The Konkan Kanyal goat population exhibited higher mean observed heterozygosity than Gohilwadi (Kumar et al., Reference Kumar, Dixit, Verma, Singh, Pande, Kumar, Chander and Singh2009), Kutchi (Dixit et al., Reference Dixit, Verma, Ahlawat, Aggarwal, Kumar and Singh2008) and many other Asian goats but lower than that of Kanniadu breed of goat (Thilagam et al., Reference Thilagam, Ramamoorthi, Sivaselvam, Karthickeyan and Thangaraju2006). The genetic variation observed in the goats under study might be due to immigration of new gene, intermixing of different population and low selection pressure. The three tests (Sign test, Standardized difference test and Wilcoxon test) under the three models (IAM, TPM and SMM) for heterozygosity excess can detect the bottleneck for only a short duration of time after a bottleneck has been initiated. These are the quantitative tests that can detect bottleneck up to 50–250 generations. As discussed above, the null hypothesis of mutation-drift equilibrium was accepted, overall there was no serious recent genetic bottleneck in Konkan Kanyal goat population.
Conclusion
There was substantial genetic variation and polymorphism across the studied loci in the Konkan Kanyal goats. This population was not in Hardy–Weinberg equilibrium at most of the studied loci. There may be receiving of new genetic material through unplanned mating. The fact that the Konkan Kanyal goat population has not undergone a genetic bottleneck is important for goat breeders and conservationists, as it suggests that any unique alleles present in this breed may not have been lost. Therefore, within breed diversity is actively maintained to enable these extensively managed stocks to adapt to future demands and conditions and there is ample scope for further improvement in its productivity through appropriate breeding strategies.