Introduction
The sex ratio at birth, defined as the number of male births per 100 female births, has been investigated for centuries in human populations (Süssmilch, Reference Süssmilch1761; Geissler, Reference Geissler1889; Gini, Reference Gini1951; Edwards, Reference Edwards1958; Garenne, Reference Garenne2009; Fellman, Reference Fellman2015). It averages about 105.5 in European populations, with variations from about 104 to 107 even in the same country over time, and presents larger variations in other populations, from 100 or below to 110 and above (Ciocco, Reference Ciocco1938; Aubenque, Reference Aubenque1989). The highest value recorded in vital registration statistics of national populations (113) seems to be that of Korea in the 1920s (Visaria, Reference Visaria1967). Lowest values are found in African populations, and in particular in southern Africa (James, Reference James1984; Garenne, Reference Garenne2002, Reference Garenne2004).
Many factors could explain variations in sex ratios among populations. Firstly, genetic factors have been identified, in particular among African populations. African-Americans living in the USA or in the UK have lower sex ratios than Europeans living in the same country, and this seems to be due to genetic characteristics of the males, since offspring of mixed couples have the characteristics of the father, and not those of the mother (lower sex ratio if father is African, higher if he is European) (Khoury et al., Reference Khoury, Erickson and James1984). Numerous environmental factors affecting the sex ratio have been identified, such as age of mother, birth order, socioeconomic status, stress and exposure to chemicals and occupational hazards (Teitelbaum, Reference Teitelbaum1970; James, Reference James1987, Reference James2000, Reference James2009; Chahnazarian, Reference Chahnazarian1988; Fukuda et al., Reference Fukuda, Fukuda, Shimizu and Møller1998; Graffelman & Hoekstra, Reference Graffelman and Hoekstra2000; Ansari-Lari & Saadat, Reference Ansari-Lari and Saadat2002; Zorn et al., Reference Zorn, Sucur, Stare and Meden-Vrtovec2002; Saadat & Ansari-Lari, Reference Saadat and Ansari-Lari2004; Catalano et al., Reference Catalano, Bruckner, Gould, Eskenazi and Anderson2005, Reference Catalano, Bruckner, Marks and Eskenazi2006; Mackenzie et al., Reference Mackenzie, Lockridge and Keith2005; Polasek et al., Reference Polasek, Kolcic and Rudan2005; Polasek, Reference Polasek2006; Saadat, Reference Saadat2006). Of particular interest for this study is the controversial issue of nutritional status. Very low fat mass of father and mother seems to have an effect on the sex ratio of the offspring.
In a review of survey data from sub-Saharan Africa, sex ratios at birth have been found to vary from close to, or below, 100 in southern Africa, to about 102 in East Africa, and about 104 in West Africa, with local variations. However, one country stood out with outstandingly high sex ratios: Ethiopia (Garenne, Reference Garenne2002). Ethiopia is characterized by a complex genetic make-up, resulting from a mixing of populations of Middle Eastern and East African origin (Pagani et al., Reference Pagani, Kivisild, Tarekegn, Ekong, Plaster and Gallego-Romero2012). The country is host to some 100 ethnic groups, identified primarily by their corresponding languages, belonging to four different families (Semitic, Cushitic, Omotic, Nilotic), revealing a complex history of peopling of the area. Ethiopia is also characterized by extreme poverty, and had one of the lowest GDPs per capita in the world in the year 2000, resulting from decades of poor economic management and political instability. The economy took off only recently, since 2004, after three decades of stagnation, and following new and successful economic policies. The country was prone to political instability for about a century: several coup d’etat, colonial and post-colonial wars, local rebellion, ethnic strife, a difficult communist period (1974–1991) and the secession of Eritrea. The eastern and northern parts of the country (currently Tigray, Affar and Somali provinces) were the most affected by wars and civil unrest. In addition, the country, and especially the eastern part, is prone to frequent periods of food shortage, and was affected by a severe famine in 1984–1985. As a result, the nutritional status of adults is one of the lowest in the world. According to the DHS Program website (DHS Program, no date), Ethiopia, together with Eritrea, has the lowest body mass index (BMI, kg/m²) among women aged 15–49 in Africa (20.1), even below that of Madagascar and Chad, and way below the African average (22.4), not counting that of the wealthier countries of southern Africa (about 25). In addition, Ethiopia has a moderate level of fertility, but a large proportion of women marry very early, so that a significant proportion of births occur among adolescent women. These early births tend to have a higher sex ratio (Garenne, Reference Garenne2008).
The aim of this study was to analyse sex ratios at birth in Ethiopia, and to try to explain why they are much higher than elsewhere in Africa. In particular two hypotheses were explored: whether high sex ratios were due to genetic factors or to nutritional status. Since no reliable vital registration is available in Ethiopia, census data were used to investigate sex ratios at birth and their potential risk factors. They were supplemented with Demographic and Health Survey (DHS) data, which are assumed to be of better quality, but limited because of their small sample size.
Methods
National census data
The main sources of data for this study were the three population censuses conducted in 1984, 1994 and 2007, available Open Access in the IPUMS (Integrated Public Use Microdata Series) database (IPUMS, no date). Each census contains a question on children ever-born, by sex, asked of women age 10 and above, which provides a large sample of live births and therefore allows the computation of sex ratios with narrow confidence intervals.
Potential genetic factors were approached by ethnicity and place of residence, since many ethnic groups live in specific areas of the country. The borders of Ethiopia have changed over the years, as well as the political situation and administrative structure. Firstly, Eritrea, annexed to Ethiopia in 1950, became independent in 1993 after a long (1961–1991) and bloody war. Secondly, the north-eastern parts of the country (currently Tigray and Affar) were for a long time unsafe, so that the 1984 census could not be conducted in these areas. Thirdly, a deep administrative reform was conducted in 1995, and the borders and names of provinces were totally changed. As a consequence, the 1984 census was stratified into two metropolitan districts and thirteen provinces (excluding Eritrea), of which one was not enumerated (Tigray), and four were only partly enumerated (Bale, Gondar, Hararghe, Wello), all located in the eastern and northern parts of the country. The 1994 and 2007 censuses are presented with the new administrative structure, comprising nine provinces and two metropolitan districts. Ethnicity, defined by the language spoken at home or by the mother tongue, has also changed over the years. Some 81 languages were available in the 1984 census, and some 92 languages in the 1994 and 2007 censuses. Of those, 60 could be matched by names, most of them larger groups, but not the smaller ethnic groups.
Potential socioeconomic factors, used here as proxies for nutritional status, were studied with three variables available in the census: area of residence (urban/rural), mother’s level of education (defined by number of years of schooling) and household wealth. Sex ratios were studied according to socioeconomic status using univariate and multivariate analysis. A wealth index was calculated from a list of thirteen goods, services and amenities available in the household. This list was the same in the three censuses, although with some minor differences in the coding of each item. The Absolute Wealth Index (AWI) was calculated as the sum of the thirteen dummy variables associated with each item, each dummy variable being coded ‘1’ for modern goods or amenities, and ‘0’ otherwise. The main advantage of the AWI was its replicability in time and space, since items were the same. It measures the amount of modern wealth available in the household, ranging from 0 (none) to 13 (all items). The AWI was used in a number of different situations, and was shown to be powerful for identifying socioeconomic differentials for a variety of demographic and health outcomes (fertility, mortality, education, anthropometry) (Garenne & Hohmann, Reference Garenne and Hohmann2003; Hohmann & Garenne, Reference Hohmann and Garenne2010, Reference Hohmann and Garenne2011; Garenne, Reference Garenne2015).
Confirmation of values of the sex ratio at birth from questions on children ever-born was searched for by analysing the sex ratio of surviving children at the time of the census: that is, the sex ratio of the population aged 0–9 years. Reverse survival allows estimation of the sex ratio at birth from the sex ratio of the surviving population, the ratio of the two quantities being the relative risk of survival of males compared with females. In census data, this relative risk was 0.968 for the country as a whole, and somewhat higher in rural areas (0.970) than in urban areas (0.952). This relative risk was confirmed by proper survival analysis based on DHS surveys. Summing the three DHS surveys available, the relative risk of survival of males aged 0–9 years compared with females was 0.969 – basically identical to that found in the censuses.
In the censuses, two population groups were found to be problematic: the Affar and the Somali groups. Firstly, they were poorly represented in the first and second census (0.8% and 1.6% of the total population, respectively) whereas they accounted for 8.0% of the population in the third census. Secondly, their mortality (30% of total) and fertility (85% of total) were abnormally low in the third census compared with the other population groups. Thirdly, their sex ratio at birth was abnormally high in the second (124.7) and in the third census (144.0), indicating serious data problems. As a result, these two groups were excluded from the final analysis.
The three census files provided a large database of some 8.2 million births, after excluding the Affar and Somali groups. Each census sample was based on a 10% fraction of the whole enumerated population. However, it should be noted that the questions on children ever-born were asked to only about a quarter of the women enumerated (eligible for the ‘long form’) in the 2007 census, which explains why the number of births was smaller than in the other censuses. Also note that due to sampling and selection of long forms, the samples studied could be somewhat biased compared with the whole population.
DHS data
Since the quality of Ethiopian censuses may not be optimal, as seen in particular with the erratic age distributions, a confirmation was searched in the Demographic and Health Surveys. Three DHS surveys conducted in 2000, 2005 and 2011 in Ethiopia are available Open Access via the DHS Program website. These surveys contain the same information as the censuses with respect to births by sex (women age 15–49), socioeconomic status, place of residence and ethnicity. The information on sex ratio was obtained from full maternity histories, and not only from the question on children ever-born as done in the census, and it is considered therefore more reliable. In addition, DHS surveys contain anthropometric information for women, in particular their body mass index (BMI), a good indicator of severe undernutrition and low fat mass. The main limitation of the DHS surveys is their sample size (about 15,000 women and 45,000 births per survey), which hampers any statistical analysis of the sex ratio at birth. A proper estimation requires approximately one million births to have a precision of ±0.4 for a sex ratio of 105.5.
Results
Sex ratio at birth from census and DHS data
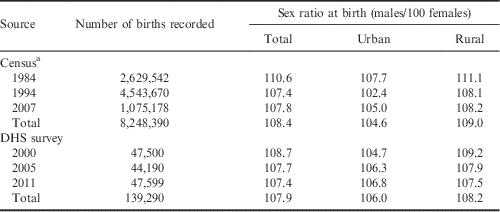
The sex ratios of the births recorded in the censuses were consistently and outstandingly high by any world standard (105), and even more by African standards (103): 110.6 (95% CI=110.4–110.9) in 1984, 107.4 in 1994 (95% CI=107.2–107.5) and 107.8 (95% CI=107.4–108.2) in 2004. When combined together the average sex ratio in the three censuses was 108.44, with a narrow confidence interval (95% CI=108.30–108.59). Note that the sex ratios in each of the three censuses were significantly different from the average (p<10−10, p<10−10 and p<10−3, respectively), which indicates some heterogeneity, possibly due to the sampling procedure or to data imprecision (Table 1).
Sex ratio of live births recorded in national censuses and DHS surveys, Ethiopia
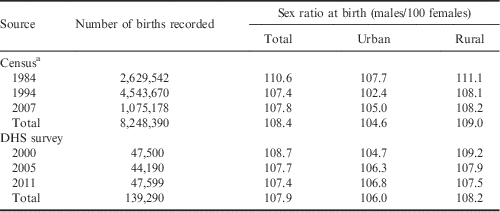
a The Affar and Somali groups were excluded because of deficient data.
The high value of the sex ratios in the censuses (108.4) was confirmed by the corresponding high value in the three DHS surveys combined: 107.9 (95% CI=106.8–109.1). The difference between the three censuses and the three DHS surveys was not statistically significant (p=0.375).
Sex ratio at birth by urban/rural residence
The sex ratio at birth was systematically lower in urban than in rural areas in all datasets. The differences between urban and rural areas were highly significant in each of the three censuses (p<10−10 in each case), and of the same order of magnitude (3–6% lower sex ratio in urban areas). In the DHS surveys, none of the difference between urban and rural areas was significant (because of small sample size), but they were all in the same direction, although somewhat smaller order in magnitude (1–4% lower sex ratio in urban areas).
Confirmation of sex ratio at birth with surviving children
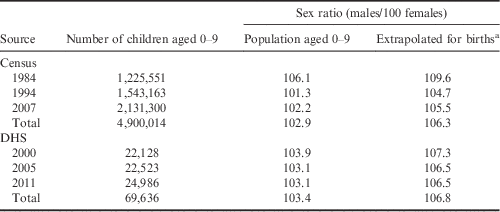
High values of the sex ratio at birth were confirmed by high values of the sex ratio of the surviving population of children aged 0–9 years. For the three censuses combined, the sex ratio of the surviving population was 102.9, which implies a sex ratio at birth of 106.3. Similarly, in the three DHSs combined, the sex ratio of the surviving children was 103.4, which implies a sex ratio at birth of 106.8. Even though somewhat lower than the sex ratio of the recorded live births, these are values way above the classic 103 usually accepted for African populations. In addition, the gradient of variations between urban and rural areas was similar to that found among the recorded live births. For the three censuses combined, the sex ratio of the surviving children was 99.8 in urban and 103.2 in rural areas, corresponding to 104.8 and 106.4 for live births – a differential similar to that found among the children ever-born (Table 2).
Sex ratio of surviving population aged 0–9 in censuses and DHSs, and extrapolation to sex ratio at birth, Ethiopia
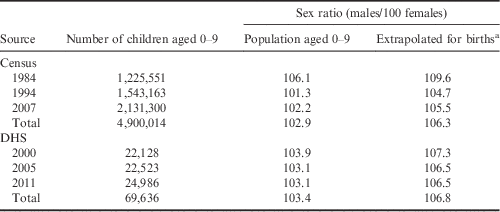
a Sex ratio of births obtained by retro-projection of sex-specific survival.
Socioeconomic differentials in sex ratios
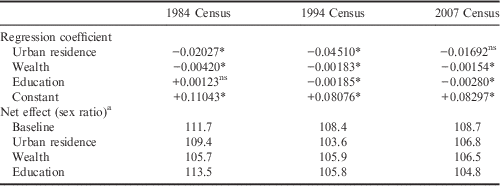
The socioeconomic factors area of residence, wealth and education, were used as proxies for nutritional status. In the univariate analysis they were all found to be highly significant, with lower sex ratios being associated with higher socioeconomic status (urban residence, greater wealth and higher level of education). Since these variables are correlated they were studied using multivariate analysis. The results confirm those of the univariate analysis: a negative relationship of the sex ratio with socioeconomic status. Of the three variables, wealth had the largest and most consistent effect, always being significantly negative in the three censuses. In terms of net effect, the impact of maximum wealth (AWI=13) was to reduce the sex ratio from 111.7 to 105.7 in 1984, from 108.4 to 105.9 in 1994 and from 108.7 to 106.5 in 2004. These values (−3.5% reduction in the sex ratio on average) are larger than those obtained from urban residence (−2.9%) or from level of education (−1.6%). These findings could explain the high values of the sex ratio in the country and the urban/rural differences: the large majority of the Ethiopian population live in extreme poverty and have a very low nutritional status, and more so in rural areas, which therefore tend to have high sex ratios (Table 3).
Multivariate analysis of the effects of socioeconomic factors on the sex ratio at birth, Ethiopian censuses
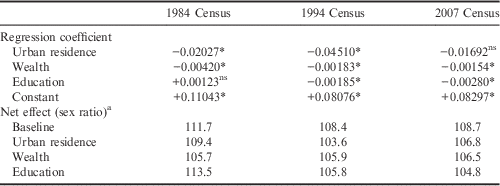
a Net effect calculated from regression coefficients, with maximum values for wealth (thirteen items) and education (thirteen years of schooling).
*p<0.05; ns, not significant.
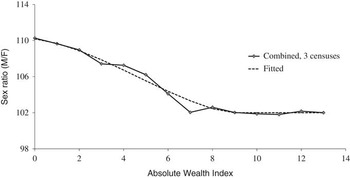
Since the regression coefficients for wealth were similar in the censuses, the three samples could be combined in a single analysis: that is, summing male and female births tabulated by level of wealth. The results are displayed in Fig. 1. Because the sample size was large (some 8.4 million births), random fluctuations were largely smoothed out, and the pattern emerged clearly. For the poorest strata of the population (AWI=0), the sex ratio at birth was about 110, then it declined steadily with increasing wealth, reaching a plateau of about 102 for wealthier people (AWI≥8), and steady thereafter. In conclusion, most variations in the sex ratio could be explained by wealth, and wealthier groups appeared to have a sex ratio comparable to nearby populations, such as in Kenya (Fig. 1).
Sex ratio at birth in Ethiopia by household wealth, three censuses combined.

Ethnic differentials in sex ratios
As mentioned above, two ethnic groups stood out as having outstandingly high sex ratios (Affar and Somali), but this was most likely due to data inconsistencies. Once these two groups were excluded, no single ethnic group was significantly different from the average after controlling for socioeconomic status.
However, when grouped by language family, one family appeared as having higher sex ratios than the others: the Nilotic group, which includes a variety of small groups living in the southern and western parts of the country. The Nilotic family had higher sex ratios than the Semitic, Cuchitic and Omotic families in each of the three censuses, in both univariate and multivariate analysis, after controlling for urban residence, wealth and education. On average, the sex ratio at birth was about 3% higher than among the other groups (110 versus 107), and even more in the 1984 census (Table 4).
Estimated sex ratio at birth among the ethno-linguistic groups in Ethiopia, after controlling for socioeconomic status, Ethiopian censuses

Sex ratio estimated by linear-logistic regression; controls were urban residence, wealth and education.
*p<0.05 (significant difference from the other groups).
Anthropometry using DHS data
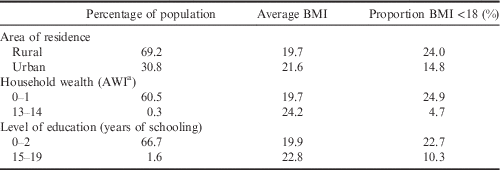
The analysis of sex ratios using data from DHS surveys was hampered by small sample size, as found in an earlier study (Stein et al., Reference Stein, Barnett and Sellen2004). Most of the differences shown in the censuses were not significant in the DHS surveys due to small sample size. For instance, the gradient of sex ratios according to women’s nutritional status, measured by BMI, was not significant, although in the expected direction (109.1 for BMI<16, 108.1 for BMI 16–19 and 106.6 for BMI 20–24 kg/m²). The only additional information that could be brought from the DHS surveys was the correlation between anthropometry and socioeconomic status. In particular, the gradient of BMI variations was stronger with household wealth (measured by the Absolute Wealth Index, AWI) than with mother’s level of education (Years of Schooling, YRS) or with urban residence. The average BMI increased from 19.7 among the poorest households (AWI<2) to 24.2 among the wealthiest households (AWI≥13), and the corresponding proportions of women with a BMI lower than 18.0 decreased from 24.9% to 4.7%. The average BMI increased from 19.9 among women with the lowest level of education (YRS<3) to 22.8 for women with the highest level of education (YRS≥15), and the corresponding proportions of women with a BMI lower than 18.0 decreased from 22.7% to 10.3%. In contrast, the average BMI varied only from 19.7 in rural areas to 21.6 in urban areas, and the corresponding proportions of women with a BMI lower than 18.0 from 24.0% to 14.8%. The correlation between BMI and wealth (ρ=0.986) was also larger than that with level of education (ρ=0.758). Note that a large proportion of the population fell into the lowest categories of wealth (60.5%), and of education (66.7%), and lived in rural areas. However, one could live in urban areas with some education and still be poor and have a low nutritional status, which explains why the correlation with the BMI was more marked with household wealth, and why household wealth was a better indicator of nutritional status (Table 5).
Distribution of BMI by socioeconomic status, women aged 15–49, Ethiopian DHS
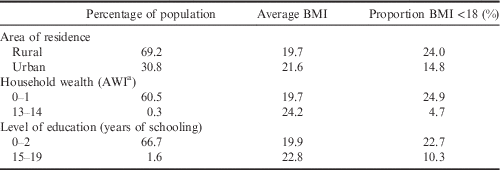
a AWI: Absolute Wealth Index. Selection of high and low values of socioeconomic status.
Discussion
This study confirmed the reality of the outstanding values of the sex ratio at birth in Ethiopia documented elsewhere (Garenne, Reference Garenne2002, Reference Garenne2004). One could always question the quality of data from censuses and surveys. However, the consistency between censuses, the consistency between DHS surveys, and the consistency between both sources are serious arguments in favour of reliable data. When data quality is erratic, some sources show one effect while others show the opposite, which was not the case in this study. In addition, if data quality were the issue, most likely the correlation with education would be stronger than that with wealth, whereas the opposite was found. Furthermore, the gradient of fertility and mortality by socioeconomic status was as expected (lower fertility and mortality with higher socioeconomic status): this would not have happened if lower socioeconomic status had been associated with more omission of births and deaths.
Census data also clearly indicated that the high values of the sex ratio at birth were associated primarily with household wealth, and not with genetic factors, which could have been an alternative hypothesis. When the three censuses were combined, the gradient of sex ratios by wealth was very marked and steady, which indicated first the importance of this factor, and second the quality of data, since such patterns cannot emerge with erratic errors in data. In turn, household wealth could explain the high values of sex ratios in Ethiopia: if households were all wealthy, they would have a sex ratio comparable to that of populations of nearby African countries.
Household wealth is viewed here not as a simple socioeconomic correlate, but as a proxy for nutritional status, with which it is highly correlated. The effect of famine and severe food shortage on increasing sex ratios has been documented in several instances: in Saxony in 1834–1854, in the Netherlands in 1941–1942 and in Ukraine in 1933–1936 (Adamets, Reference Adamets2002; James, Reference James2009). During the civil war in Tajikistan (1991–1997) sex ratios were found to increase, and this was interpreted as the effect of severe food shortage (Hohmann et al., Reference Hohmann, Roche and Garenne2010). Perhaps the most striking case of a large impact of very low nutritional status on sex ratio at birth is that found in Korea in the 1920s (Visaria, Reference Visaria1967). These outstanding values were associated with a severe and long-lasting man-made food shortage. When the Japanese invaded Korea around 1910, they took control of agricultural land, about half the total by 1930, and obliged farmers to give them half of their crops. Since the farmers were already very poor, many ended up near starvation between 1920 and 1930, and later moved to cities in order to survive (Seth, Reference Seth2010). This should have had an effect on their nutritional status, and could probably explain the very high sex ratio at birth during this period.
Whether the effect of nutritional status on the sex ratio at birth is due to the nutritional status of the father or that of the mother needs to be further studied. Available data tend to focus on young men. In fact, men have a lower fat mass on average, and are more vulnerable to food shortage and famines than women (MacIntyre, Reference MacIntyre2002). In contrast, maternal depletion is usually associated with lower sex ratios, probably because of increased intrauterine mortality (Andersson & Bergstrom, Reference Andersson and Bergström1998). In addition, men usually play a bigger role in sex ratio variations than women. Unfortunately, there were no data on men’s nutritional status that could be correlated with sex ratios of their offspring in Ethiopia.
Despite the strong effect of socioeconomic factors in Ethiopia, there may be some additional genetic factors playing a role. The fact that the Nilotic groups were found to have higher sex ratios even after controlling for socioeconomic status deserves further investigation. These groups are close ethnically, and probably genetically, to the groups living in southern Sudan. In the 2008 census of southern Sudan, the sex ratio at birth was even higher (112.3) for some 372,000 births (95% CI=111.6–113.0). The sex ratio of the age 0–9 years population was also very high (106.2), which implies a sex ratio at birth of about 110.
Census data from Ethiopia and Sudan contrast markedly with census data from other African countries. According to IPUMS databases, covering some eighteen countries, the average sex ratio among children ever-born in Ethiopia, Sudan and southern Sudan combined was 112.0 – much higher than the low value of 101.4 found among the fifteen other African countries. This geographical clustering indicates a pattern that could be due to a variety of factors, and in particular to a combination, or an interaction, between genetic and nutritional factors, which remains to be further explored. It is plausible that a low-energy diet, combined with a genetic make-up conducive to low BMI, as found repeatedly in this area, has a large positive effect on sex ratios at birth.
This study used census data to investigate sex ratio at birth in an African population. This was necessary since vital registration is very incomplete in Ethiopia, as in most African countries. The advantages of using census data is firstly to avoid biases associated with incomplete declaration in vital registration, and secondly to allow in-depth analysis by socioeconomic status. More research on sex ratios could be conducted using the census files available in the IPUMS database.
Acknowledgments
The author thanks the IPUMS-International project and the DHS programme for making available the individual data of the censuses and DHS surveys of Ethiopia.