Claims of bias against female candidates abound in American politics. Voters, then-U.S. Representative Michele Bachmann said in February 2014, “aren’t ready” for a female president. Footnote 1 Journalists, too, are considered a major impediment to gender equity on the campaign trail. “Widespread sexism in the media is one of the top problems facing women,” reports the political advocacy group “Name It. Change It.” Footnote 2 Hillary Clinton, the front-runner for the 2016 Democratic presidential nomination, has joined in, noting in April 2014 that because women in public life are held to higher standards, they need to “grow a skin as thick as the hide of a rhinoceros.” Footnote 3
These oft-heard assertions are no surprise given the scholarly literature. Although overt media bias and explicit voter discrimination are rare, political scientists have generally argued that female candidates are treated differently—and often worse—than male candidates in the press and by the public. While these patterns don’t doom female candidates to electoral failure—indeed, women do just as well as men when they run—they raise a formidable series of obstacles that often complicate women’s path to elective office. Footnote 4
These obstacles are important because decades of research in both American and comparative politics suggests that women’s presence in political institutions bears directly on issues of substantive and symbolic representation. Electing more women not only reduces the possibility that politicians will overlook gender-salient issues, Footnote 5 but can also infuse into the political system a style of leadership that values congeniality and cooperation. Footnote 6 Moreover, women in politics bring to the government a greater sense of political legitimacy. As Jane Mansbridge explains, “easier communication with one’s representative, awareness that one’s interests are being represented with sensitivity, and knowledge that certain features of one’s identity do not mark one as less able to govern all contribute to making one feel more included in the polity. This feeling of inclusion in turn makes the polity democratically more legitimate in one’s eyes.” Footnote 7 If the campaign environment women navigate is more onerous than men’s, then that threatens both public policy and democratic legitimacy.
A small body of work, however, has begun to raise questions about whether women who run for office in the United States today must overcome barriers that men need not surmount. Recent experimental and observational data suggest that women and men are treated similarly on the campaign trail. Footnote 8 These studies do not imply that candidate sex is irrelevant to journalists and voters. But the findings are consonant with two broad changes in the electoral environment that plausibly have reduced the salience and influence of sex as a political consideration. As more women have entered politics over the last three decades, the novelty of female candidates has waned, and public opinion surveys now routinely reveal high levels of support for women at all levels of office. Moreover, in an atmosphere of increased party polarization, there may be less room for gender to exert an independent influence on media coverage or voters’ attitudes. Footnote 9 These developments suggest that the campaign environment may be more similar for male and female candidates than it once was. If that is true, then it augurs favorably for current and future generations of women running for office in the United States.
Here, we provide an updated, comprehensive assessment of whether women experience—at least as far as news coverage and voter evaluations are concerned—a more hostile campaign environment in U.S. politics than do men. We examine data from nearly 350 U.S. House campaigns during the 2010 midterms. In doing so, we improve on the existing literature in several ways. First, in an effort to determine how the information that voters encounter during campaigns shapes their attitudes, we link media coverage to public opinion data. Second, we examine the influence of candidate gender amid the cacophony of real-world campaigns, where party, ideology, and incumbency also influence the way candidates are covered and evaluated. Third, we expand the empirical foundation of the existing literature by focusing not on statewide or presidential contests—the site of most work—but on House elections. This not only dramatically increases the number of female candidates we can study, but it also allows us to examine gender dynamics in the contests where most women run for federal office. As a result, we offer a much-needed update to a literature whose most frequently-cited studies are based on data collected a decade or more ago.
We begin by reviewing the conflicting findings in the literature about whether the sex of a candidate affects media coverage and voter attitudes. Given women’s increasing presence on the campaign trail, coupled with the heightened importance of party identification as an electoral consideration, we argue that there is little reason to expect that candidate sex will affect journalists’ coverage of, or voters’ attitudes toward, the women and men running for office in their districts. We then explain the empirical difficulties involved in operationalizing our central hypotheses and develop an approach to overcome the limitations of much of the existing research.
We then turn to our detailed analysis of 4,748 local newspaper stories and survey data from the Cooperative Congressional Election Study (CCES). First, we present the results of our content analysis, which uncovers no significant gender differences in the volume of coverage candidates receive, references to their sex, or the traits and issues with which they are associated. The next section presents results from our analysis of the CCES, which are similar: candidate sex does not influence voters’ assessments of candidates on a wide variety of trait dimensions. In connecting media coverage to individuals’ evaluations of candidates in their districts, we do find that news coverage often affects voters’ assessments. But reporters’ portrayals and citizens’ evaluations of candidates stem primarily from partisanship, ideology, and incumbency, not the sex of the candidate. Our findings suggest that male and female House candidates today face a very similar electoral landscape.
In our concluding section, we suggest that although our results differ from much of the existing literature, the study of gender dynamics on the campaign trail is not moribund. To the contrary, we regard the questions that our analysis cannot answer as promising opportunities for renewed attention to a number of critical issues that are central to understanding women’s path to electoral office and the prospects for gender parity. Additional work on the mechanisms—institutional and behavioral—that produce the level playing field we document; new approaches to measuring gender-relevant attitudes; and assessments of cross-national variation in campaign dynamics could all produce significant new insights into the challenges that women do and do not face when they throw (or think about throwing) their hats into the political arena. Ultimately, our results provide a valuable point of departure for answering enduring and pressing questions about gender, candidate emergence, and representation in contemporary politics, both in an American and comparative context.
Candidate Sex, Media Coverage, and Public Opinion: Conflicting Findings
Why do so few women occupy elective office? This question guides much of the research on gender and elections. For decades, gender politics scholars—in the United States and throughout the world—have produced a large body of literature that provides a series of answers. Institutional barriers, such as the incumbency advantage, can hamper the emergence of female candidates. Footnote 10 Opposition to electoral rules, like gender quotas or a proportional party list system, can impede women’s numeric representation. Footnote 11 Structural impediments, including women’s historic exclusion from the professions that tend to lead to political careers, can slow the pace at which women acquire the credentials most candidates possess. Footnote 12 And deeply embedded patterns of traditional gender socialization—even among educated, well-credentialed professionals—can often depress women’s political ambition. Footnote 13
Even though overt discrimination has fallen out of favor as an explanation for women’s under-representation, scholars are reluctant to conclude that sexism and gender bias do not impede women’s electoral fortunes, if even only indirectly. This is particularly true in the United States. After all, the United States ranks first worldwide in educational equity, and in the top 10 countries for women’s economic participation. Footnote 14 Women have swiftly moved into the professions that produce the most candidates. Yet women’s representation in Congress remains at just 19 percent, and 99 nations now surpass the United States in the share of women serving in the national legislature. Footnote 15 Political scientists have, for the last 20 years, tried to reconcile this paradox by arguing that female candidates are often treated worse than male candidates in the press and by the electorate. This differential treatment makes running for office more complex and complicated for women than men, even if it does not ultimately preclude their electoral success.
The evidence for this argument seems substantial. Many studies, nearly all of which focus on presidential, senatorial, and gubernatorial candidates, find not only that women receive less overall and less prominent campaign coverage than men, but also that gender differences emerge in the content of the coverage they do receive. Footnote 16 Press coverage of female candidates is more likely to focus on the horse race and a lack of viability. Footnote 17 Further, the news tends to emphasize women’s appearance, personality, family roles, “feminine traits”—such as compassion and honesty—and advocacy for “women’s issues.” Men, on the other hand, are more likely than women to garner attention that focuses on their professional backgrounds, credentials, office-holding experience, “masculine” attributes—such as leadership and experience—and strengths in the areas of foreign policy, defense, and the economy. Footnote 18
These portrayals in the media are consistent with—and are assumed to reinforce—voters’ perceptions of gender differences among politicians. Empirical analyses reveal that women and men who enter politics are perceived by citizens differently in terms of their ideologies, traits, and policy expertise. Female candidates and office-holders, for example, are generally viewed as more liberal than male candidates of the same party. Footnote 19 Voters tend to assess men as assertive, active, and self-confident, whereas they identify women as compassionate, willing to compromise, and people-oriented. Footnote 20 And male candidates are perceived as more competent than women in the areas of military crises, crime, and the economy; women are viewed as more competent when the issues at hand are gender equity, education, health care, and poverty. Footnote 21
These patterns, argued to arise from social stereotypes of men and women, are relevant not only because they demonstrate the degree to which traditional gender roles and expectations permeate contemporary politics, but also because they can affect voters’ support for candidates. Citizens tend to pay relatively little attention to the details of politics and policy. Footnote 22 So when making judgments about candidates, individuals invoke myriad heuristics, of which gender serves as one of the most straightforward. Footnote 23 “Women’s issues” and women’s “outsider” status can undoubtedly advantage female candidates in some election years. Footnote 24 But for the most part, the traits and issue expertise accorded to male politicians are viewed as more important for politics Footnote 25 and leadership more generally. Footnote 26 As Sarah Fulton summarizes, “There is a growing consensus that voters hold preferences for male officeholders and rely on gender stereotypes to infer candidate traits, issue competencies, and ideologies.” Footnote 27
But this characterization, while intuitively appealing, is at odds with an emerging body of research that suggests that gender stereotypes may not put women at a disadvantage. Danny Hayes, for example, offers a detailed content analysis of newspaper coverage in the 2006 U.S. Senate elections. Footnote 28 He then uses those results to predict voters’ attitudes toward the candidates. The data suggest that assessments of candidate attributes can be affected by news coverage, but that gender stereotyping is limited by voters’ reliance on party stereotypes. Kathleen Dolan’s assessment of public opinion from the 2010 House elections produces similar results; voters’ evaluations of congressional candidates—male or female—are driven largely by party affiliation, not gender. Footnote 29 And Deborah Jordan Brooks, analyzing a series of experiments, finds that women who act tough, get angry, or even cry on the campaign trail are not viewed any differently than men who do the same thing. Footnote 30
This is to not say that gender stereotyping has not existed in the past, that sex is irrelevant when considering the electoral playing field candidates traverse, or that high-profile examples of sexism never rear their heads. But the newer research suggests that the prevailing understanding of the campaign environment that women navigate in twenty-first century American politics may need updating. More specifically, it might not fully account for two broad changes to the U.S. political landscape that may reduce the likelihood that systematic gender differences in news coverage or public opinion will emerge in contemporary congressional elections.
First, both elite and mass attitudes toward women in politics have changed. Through the 1970s, electoral gatekeepers all but prohibited women from running for office. And the female candidates who did emerge often faced sexism and a hostile environment. Footnote 31 Individual accounts of women who face blatant gender discrimination once they enter the public arena, however, have become increasingly uncommon. Footnote 32 The public’s attitudes toward women in politics have also evolved. Seventy-five percent of Americans no longer believe that men are better suited emotionally for politics than are women. Footnote 33 When asked about the “major reasons” for women’s under-representation, only 14 percent of citizens agree that “women aren’t tough enough for politics” and only 16 percent contend that “women don’t make as good leaders as men.” Michele Bachmann’s claims aside, 95 percent of survey respondents express a willingness to support a qualified, female party nominee for president. Footnote 34 Although some portion of the population still questions women’s suitability as leaders, discriminatory attitudes are on the decline. Indeed, many of the studies that uncover gender disparities in news coverage acknowledge that the magnitude of these differences has become far more subtle over the years. Footnote 35 Yet most of this research still focuses on contests from the 1990s and early 2000s. Given the public’s increasing receptivity of women in politics, contemporary congressional elections would likely see even less gender stereotyping.
Second, sex is only one piece of information voters have about candidates, and its influence may be diminished in an increasingly partisan and polarized political environment. Party has long served as a powerful shortcut for voters, Footnote 36 but the growth of ideological polarization at the elite level has increased the salience of partisanship, Footnote 37 leading to a rise in party-line voting. Footnote 38 As David King and Richard Matland note, “candidates are partisan creatures, born of party primaries, vying for jobs in intensely partisan institutions. Even more important, voters see candidates first and foremost as partisans.” Footnote 39 Moreover, the information that voters encounter has come to reflect these divisions, as the news media cover partisan conflict as a central aspect of contemporary campaigns. Footnote 40 To the extent that partisanship has become a stronger predictor of a host of political outcomes, there is less space for candidate sex to exert an independent influence. Footnote 41 None of this is to suggest that gender is not evident to the media and voters. But if they view it as less relevant to their particular decision tasks—portraying candidates in news stories or choosing among them in elections—then partisanship and ideology are likely to play a much stronger role than candidate sex in shaping news coverage and voter attitudes. Footnote 42
An Improved Approach to Studying Gender Differences on the Campaign Trail
For a series of research design and methodological reasons, studies are often limited in the light they can shed not only on the prevalence of gendered media coverage or voter attitudes, but also on their electoral effects. This complicates our ability to reconcile the competing findings in the literature. But it also provides guidance for developing an improved approach to understanding the way journalists treat and voters evaluate women running for office.
First, it is imperative to consider both the information environment that voters navigate as well as the attitudes they form about candidates. Footnote 43 Most of what voters know about politics comes from the media, making news coverage a critical source of information in the vast majority of American political campaigns. Footnote 44 This is not to say that the news media are the only source of information during campaigns. Television advertising, direct mail, and a host of information shortcuts can also shape the way that voters evaluate candidates. Footnote 45 But especially in the relatively low-profile campaigns that characterize most American elections, a disproportionate share of what voters know about their electoral choices comes from the local news media.
Although most research acknowledges the importance of the media to voter decision-making, many studies focus either on the media or the voters and then assume transmission of information from the former to the latter. Few directly investigate the link. Linda Fowler and Jennifer Lawless, for example, offer a detailed content analysis of 1,365 newspaper articles for 27 gubernatorial contests involving a female candidate. Footnote 46 They then use the media content variables to predict election outcomes. But with no public opinion or individual-level data, they are left to assume that news coverage shapes voters’ propensities to stereotype and that those stereotypes then affect candidate choice. Footnote 47 Studies of gender stereotyping among voters, on the other hand, tend not to gauge the information environment that transmits cues to voters about the politicians they are asked to evaluate. Often, this research either lacks measures of media coverage, occurs in an experimental setting, or focuses on hypothetical candidates so that there is no “real” information environment to take into account. Footnote 48 This is a significant limitation because news coverage could exacerbate or mitigate voters’ propensity to evaluate candidates in gendered terms. Footnote 49 Only by directly measuring the information environment and incorporating it into our analyses can we explore the plausible sources—gender-related or otherwise—of voters’ attitudes about candidates.
Second, if we are to understand the role of candidate sex in media coverage and voter evaluations, then we must be able disentangle gender and party effects. Experimental designs have provided significant leverage to scholars attempting to measure citizens’ use of gender stereotypes, but many studies cannot account for the extent to which partisanship is a competing heuristic in a real campaign environment. Kira Sanbonmatsu and Kathleen Dolan, for instance, ask respondents to consider the capability of “a Democrat who is a man” or “a Democrat who is a woman” to handle various issues. (They ask the same questions about Republican men and women.) Footnote 50 They find that voters of both parties give an advantage to women when the issue at hand is education, a domain in which women are ostensibly perceived as capable. Leonie Huddy and Theresa Capelos’s experimental results are consistent; candidate sex influences voters’ perceptions of how well candidates would address “women’s issues.” Footnote 51 In both studies, however, gender differences emerged in a context in which sex was primed, which presumably encouraged subjects to base their responses on candidate sex. In fact, on most other issues, Huddy and Capelos find that a candidate’s party trumps sex as a predictor of vote choice, suggesting that when gender is not cued, party predominates. While experimental designs have many advantages over observational research, examining media coverage and public opinion during actual campaigns allows us to observe how journalists and voters behave when many pieces of information about candidates, including both sex and party, are available.
Third, a comprehensive analysis of gender stereotyping must expand the empirical foundation of previous research. The vast majority of the literature has focused on statewide races or female presidential and vice presidential candidates’ campaigns. As a consequence, scholars have drawn inferences about the relationships among gender, media coverage, and public opinion largely from studies of relatively few (and perhaps unusual) female politicians. Johanna Dunaway and her colleagues’ detailed content analysis of nearly 10,000 newspaper articles covering 30 Senate and gubernatorial elections in 2006 and 2008, for example, includes just eight female candidates, only two of whom are Republican. Footnote 52 Hayes’ investigation of gender stereotyping in the 2006 U.S. Senate election also has a small-N problem; only 12 women ran for Senate that year. Footnote 53 Even Kim Fridkin Kahn’s pioneering work on media coverage of U.S. Senate and gubernatorial campaigns—among the most comprehensive in the field—is based on just 22 female candidates. Footnote 54 While these studies speak to what happens when women run in the highest-profile contests, these elections—and the candidates who compete in them—are hardly representative of the environment faced by the vast majority of female politicians. Focusing on U.S. House races would allow scholars to study the federal elections where most women (and men) run, and in doing so, dramatically increase the number of unique campaigns available for analysis. By expanding the scope of previous work and examining an understudied context, we have an opportunity to improve our understanding of the way journalists treat and voters evaluate female candidates. That effort should provide new insight into the current and future prospects for increasing women’s numeric representation in the United States.
Candidate Sex and Media Coverage in U.S. House Campaigns
By relying on a research design that allows us to measure both media content and public opinion during an election cycle, we offer the first nuanced, large-scale assessment of the extent to which candidate sex affects news coverage and voter attitudes. We begin with an analysis of media coverage of the 2010 U.S. House campaigns. In each of 380 congressional districts for which we have survey data from the Cooperative Congressional Election Study (which we will discuss later), we identified the largest circulation local newspaper that we could access through one of several electronic databases or the newspaper’s online archives.
We focus on local newspapers because most of the information available to voters during congressional election campaigns comes from local print media. Footnote 55 In addition, local print coverage, but not television, has been found to affect voter attitudes toward members of Congress. Footnote 56 We do not analyze national newspapers, cable television, blogs, and social media because there is very little coverage of individual congressional campaigns in outlets like the New York Times and Fox News, and the audiences for political information in many newer venues remain very small. For instance, blog readers constitute just a fraction of the public, Footnote 57 fewer than one in five Americans are on Twitter, Footnote 58 and just 9 percent of consumers in 2010—the election year on which we focus—said they regularly got news from a social networking site. Footnote 59 Although Facebook and Twitter are growing in importance for both candidates and news consumers, they do not yet constitute a significant source of political information for most Americans. Despite changes to the media environment, local newspaper coverage remains the most thorough and influential political news source during House campaigns.
We collected every newspaper article that mentioned at least one of the two major-party candidates for the House seat and analyzed the content of the coverage they received in the month leading up to Election Day (October 2–November 2, 2010), the period during which voters are most likely to pay attention. Footnote 60 We recorded the number of instances a candidate’s sex was mentioned (which includes references to family roles, appearance, and the like), references to more than 100 character traits, and mentions of more than 150 issues associated with a candidate. In all, we coded 4,748 news stories, editorials, and op-ed columns. In the 342 districts for which we located at least one story about the congressional race, 108 candidates were women, and 555 were men. The distribution of candidates by sex, party, and incumbency status appears in table A1. The average number of stories about each contest was 14. Footnote 61
In contrast to many studies of campaign media coverage that conduct the analysis at the story or paragraph level, we carried out our coding at the level of the individual reference. In other words, we account for every time a particular attribute or issue was mentioned. Compared to previous work, the detail and depth of our coding and the large number female candidates in our data set significantly improve the precision and generalizability of our analysis. The Appendix provides a detailed description of the content analysis project and coding procedures, including data on the newspapers, the volume of coverage in these races, and the traits and issues we measured (refer to tables A2–A4).
We first test four central propositions from the existing literature: that news coverage of female candidates, relative to coverage of men, is (1) less plentiful, (2) more likely to include references to their sex, (3) more focused on personal traits, and (4) less focused on issues. The data set is well-suited to examine these questions because more than 90 percent of candidates received at least some media coverage, more than 80 percent received issue coverage, more than 50 percent received trait coverage, and 32 percent received at least one sex/gender mention. Thus, even though trait coverage and sex mentions are relatively infrequent, there are a sufficient number of candidates who received this type of coverage for us to assess whether candidate sex played a role in generating it. Footnote 62
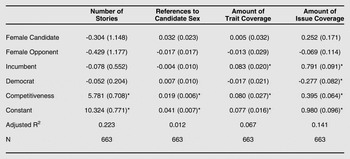
The second column of table 1 displays the results of a regression analysis predicting the number of news stories about a race. In addition to candidate sex, we include measures of several factors that could plausibly influence media coverage: whether the candidate is an incumbent, the candidate’s party affiliation, and the competitiveness of the race, Footnote 63 which we base on the Cook Political Report’s classification as of October 5, 2010. We also include a variable indicating whether the candidate’s opponent is a woman, a test of whether even the presence of a female candidate in the race may affect coverage. Footnote 64
Candidate sex and news coverage in the 2010 U.S. House elections

Notes: The dependent variables in the final three columns—References to Candidate Sex, Amount of Trait Coverage, and Amount of Issue Coverage—are scaled by the number of stories in a district. Cell entries are unstandardized OLS regression coefficients with robust standard errors in parentheses.
Level of significance: * p < .05.
The results indicate that neither a candidate’s sex, nor the sex of his/her opponent, has anything to do with how much attention journalists devote to a contest. The same story emerges when we examine the number of references to a candidate’s sex, as well as the number of references to his/her personal traits and policy issues (refer to table 1, columns 3–5). Footnote 65 In short, we find no evidence that candidate sex is related to the volume or content of media coverage candidates receive. Footnote 66 Instead, the news responds most strongly to competitiveness—the more hotly contested the race, the more likely the media are to cover the candidates across all dimensions. Footnote 67
Of course, the volume and emphasis of coverage does not eliminate the possibility that news organizations cover men and women differently. A common assertion is that the media give more attention to female candidates’ “feminine” traits, such as empathy and integrity, than they do to men’s. Footnote 68 Likewise, male candidates’ “masculine” traits, such as competence and leadership, receive disproportionate coverage. Since voters value competence and leadership, disparate levels of coverage of these traits could encourage voters to question female candidates’ ability to get the job done.
Our coding scheme identified every news reference to a candidate’s traits, allowing us to quantify with unusual precision the attributes most frequently used to describe female and male candidates. We then classified each trait as belonging to one of the four dimensions that previous research has identified as salient for voters: competence, leadership, integrity, and empathy. Footnote 69 We also coded whether, based on the context in which it appeared in the article, the trait reference was positive (e.g., competent) or negative (e.g., incompetent). Overall, 51 percent of the candidates received at least one mention of their competence, leadership, integrity, or empathy. Positive mentions were somewhat more common than negative references; 38 percent of candidates were associated with at least one positive trait, and 32 percent were associated with at least one negative attribute.
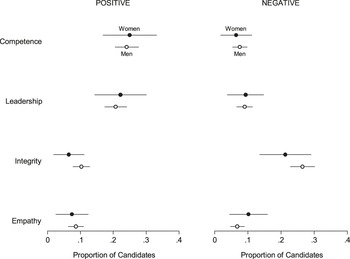
In figure 1, we present the proportion of candidates, by sex, for whom we found at least one story that made reference to the candidate’s competence, leadership, integrity, and empathy. Male and female candidates were equally likely to be described as possessing these traits; none of the comparisons between men and women is statistically significant (p < .05). We also found no differences on any of the eight dimensions of trait coverage when we compared male Democrats to female Democrats, male Republicans to female Republicans, male incumbents to female incumbents, male challengers to female challengers, or men in competitive races to women in competitive races (analyses not shown).
Trait mentions in news coverage, by sex of the candidate—2010 U.S. House elections
Note: Dots indicate the proportion of candidates (with 95 percent confidence intervals) who received at least one mention of each trait in the overall amount of news coverage analyzed. For women, N = 108; for men, N = 555.

We can provide a more refined test by taking advantage of the exhaustive nature of our coding scheme. While newspapers may have published similar numbers of stories that mentioned male and female candidates’ traits, perhaps the frequency with which these attributes appeared in the news differed. The proportions in figure 1 could mask the fact that women and men might receive heavy amounts of attention to different traits within a given story. Moreover, the descriptive analysis does not control for incumbency, party, the competitiveness of the race, or the presence of a female opponent.
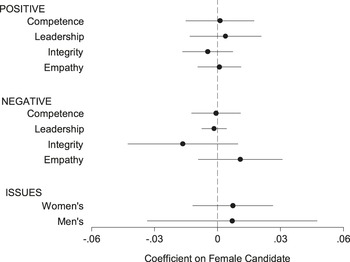
We conducted a series of regression analyses that include these controls. The dependent variable in each model is the number of news references to a candidate’s attributes on the eight trait dimensions. Footnote 70 Once again, we find no evidence that candidate sex affects media coverage. The top portion of figure 2 presents the regression coefficients (and 95 percent confidence intervals) for female candidate in each equation. In no case is the effect of sex statistically distinguishable from zero. Whereas heightened levels of competitiveness and the presence of a sitting representative in the race affect how journalists cover a campaign, the sex of the candidates does not. Footnote 71 (Refer to table A5 for the full regression equations.)
The impact of candidate sex on trait and issue mentions in news coverage—2010 U.S. House elections
Note: Dots represent unstandardized OLS regression coefficients with 95 percent confidence intervals. Refer to tables A5 and A6 for the full regression equations.

The same finding emerges when we turn to the issues mentioned in connection with a candidate. We identified every issue mentioned in each newspaper article and then classified each as a “women’s issue,” “men’s issue,” or neither. We assigned “women’s” and “men’s” status only to issues for which the literature has reached a consensus and the classification is intuitive. Even with this conservative coding scheme, issue coverage in each of these two categories was prevalent; nearly 43 percent of the candidates were connected to at least one “men’s issue,” such as crime, national security, or war, and roughly 16 percent received coverage of at least one “women’s issue,” including abortion, domestic violence, or pay equity. As the coefficients at the bottom of figure 2 show, though, male and female candidates were equally likely to be associated with “men’s issues” and “women’s issues” (refer to table A6 for the complete regression results). Footnote 72
In sum, the results—which emerge from more than 4,000 articles, and hundreds of local newspapers, House races, and candidates—could hardly be more clear: Sex bears no relationship to newspaper coverage of the 2010 House elections. If women face significant or additional hurdles when navigating the campaign trail, it does not appear that those impediments are raised by the media. These findings are consistent with broad understandings of the norms that shape the practice of mainstream journalism in the United States. News outlets are unlikely to devote excessive coverage to the sex of a politician or engage in rampant gender stereotyping. Doing so risks violating professional and social expectations about what constitutes appropriate topics of coverage, as well as the balance and “two-sidedness” that characterize mainstream news. Footnote 73
Candidate Sex and Voter Attitudes in U.S. House Campaigns
Our content analysis demonstrates that the media cover very similarly the men and women who run for the House, suggesting that candidate sex may not be particularly salient in the information environment. But that does not eliminate the possibility that voters are inclined to assess candidates in gendered ways that could pose challenges for women pursuing elective office. This, of course, has been a central finding in the existing literature.
To examine voter attitudes toward male and female House candidates, we designed a module within the 2010 Cooperative Congressional Election Study. Footnote 74 A nationally representative sample of 1,000 U.S. residents was asked a series of questions to gauge the extent to which they evaluate congressional candidates in ways that reflect traditional gender stereotypes. Specifically, respondents were asked to rate both the Democratic and Republican House candidates in their districts on two ostensibly “feminine” traits—“really cares about people like me” (which, following convention, we henceforth refer to as empathy) and “trustworthy”—and one “masculine” trait—“provides strong leadership.” We focused on traits, as opposed to issues, because trait inferences have been found to be the source of issue stereotypes. Footnote 75 For instance, because female politicians are likely to be seen as possessing feminine traits, they are then stereotyped as adept at handling “compassion” issues. Male politicians, on the other hand, are often seen as stronger leaders. This masculine trait then carries over into voters’ evaluations and leads them to perceive men as better able to handle foreign policy, defense, and crime. Thus, examining traits allows us to home in on the foundations of potentially gendered attitudes.
Following the wording of the National Election Studies trait measures and those in previous work, Footnote 76 the questions were asked this way: “Think about Julie Lassa, the Democratic candidate for U.S. House of Representatives. In your opinion, how well does the phrase ‘provides strong leadership’ describe Julie Lassa?” Respondents could answer “extremely well,” “quite well,” “not too well,” or “not well at all.” Responses were assigned a numerical value, with 1 representing “not well at all” and 4 representing “extremely well.”
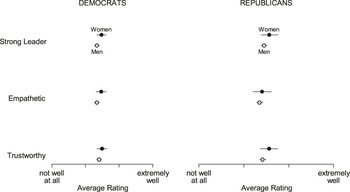
Figure 3 presents the mean trait ratings, broken down by candidate sex. Because Democratic and Republican candidates tend to “own” certain traits, Footnote 77 we control for this potential confound by separating the data by party. The results indicate that for all three traits—across party—the mean evaluation for each candidate fell in between “not too well” and “quite well.” More important for our purposes, however, are the lack of statistically significant differences in each comparison. Put simply, we find no systematic evidence whatsoever of differential evaluations of male and female candidates.
Leadership, empathy, and trustworthiness, by candidate party and sex—evaluations of 2010 U.S. House candidates
Note: Dots indicate the mean rating on a 1 – 4 scale (with 95 percent confidence intervals). For female Democratic candidates, N = 202; for male Democratic candidates, N = 674; for female Republican candidates, N = 91; and for male Republican candidates, N = 805. N varies slightly across traits, as some respondents did not answer all three questions. Refer to table A7.

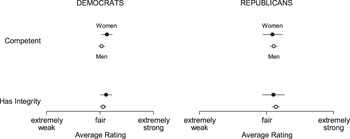
Beyond the three trait questions designed specifically to be included in our survey, two additional trait measures were administered as part of the larger “Common Content” battery in the CCES. All CCES respondents, including those from our module, were asked to assess the “competence” (a masculine trait) and “personal integrity” (a feminine trait) of their Democratic and Republican House candidates on a 7-point scale that ranged from “extremely weak” to “extremely strong.” Footnote 78 These trait ratings further undermine the idea that voters judge candidates in gendered terms. Just as with the ratings of House candidates’ leadership, empathy, and trustworthiness, the data presented in figure 4 reveal no statistically significant gender differences in candidates’ competence and integrity ratings. (Refer to table A7 for details.)
Competence and integrity, by candidate party and sex—evaluations of 2010 U.S. House candidates
Note: Dots indicate the mean rating on a 1 – 7 scale (with 95 percent confidence intervals). For female Democratic candidates, N = 154; for male Democratic candidates, N = 496; for female Republican candidates, N = 64; and for male Republican candidates, N = 589. N varies slightly across traits, as some respondents did not answer both questions. Refer to table A7.

Regression analyses confirm the descriptive findings. We ran a series of models that predict respondents’ evaluations of Democratic and Republican House candidates’ leadership, empathy, trustworthiness, competence, and integrity. In addition to the sex of the candidate, we include in the ten equations three sets of variables that could influence a respondent’s evaluations of the House candidates in her district. First, we control for the respondent’s party identification, ideology, interest in the news, and socio-demographic variables. We also include indicators of the candidate’s incumbency status and vote share, so as to account for a respondent’s likely exposure to the candidates running in the district. Footnote 79 Finally, we leverage our content analysis to determine the extent to which the information the media provide to voters affects trait evaluations. Footnote 80 Specifically, each model includes measures of the total number of positive trait, negative trait, “women’s issues,” and “men’s issues” mentions the candidate received. In addition, we include a measure of the total number of news references to the candidate’s sex, which we interact with the sex of the candidate so as to capture any gender differences in effect. Footnote 81
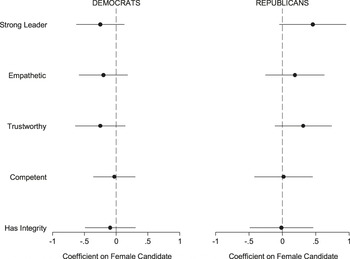
The most striking finding to emerge from the analysis is that candidate sex consistently fails to achieve conventional levels of statistical significance. Figure 5 presents the coefficient and 95 percent confidence interval on the female candidate variable from the ten equations (refer to tables A8 and A9 for the full regression results). In no case does the sex of the candidate influence respondents’ evaluations of candidate traits. Footnote 82
The impact of candidate sex on evaluations of 2010 U.S. House candidates
Note: Dots for “Strong Leader,” “Empathetic,” and “Trustworthy” are ordered logistic regression coefficients with 95 percent confidence intervals. Dots for “Competent” and “Has Integrity” are OLS regression coefficients with 95 percent confidence intervals. Refer to tables A8 and A9 for the full regression equations.

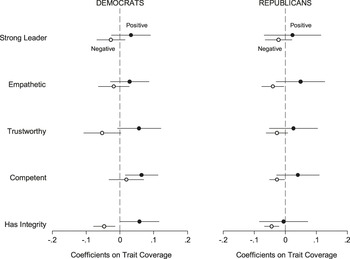
A candidate’s sex might be apparent to voters, but it does not override what are clearly more political salient considerations. Partisanship and the information environment play a more influential role in shaping evaluations of candidates. Consistent with Dolan’s findings, the strongest and most reliable predictors of voter opinion are whether the candidate shares the respondent’s partisan and ideological orientation; Footnote 83 party and self-reported ideology are significant in all ten models. In addition, in five of the ten models, at least one indicator of positive or negative trait coverage is statistically significant. Footnote 84 The regression coefficients and confidence intervals presented in figure 6 are, once again, taken from the regression equations predicting respondents’ assessments of Democratic and Republican candidates on the five traits. Positive trait mentions are associated with higher competence evaluations for Democratic candidates. By contrast, negative trait mentions depress respondents’ evaluations of Democratic and Republican candidates’ integrity, as well as GOP candidates’ empathy and competence. The news does not always shape candidate evaluations, and the traits it affects vary across party. But the data indicate that, at least in some cases, media portrayals can influence voters’ attitudes. Because gender differences were not evident in the news coverage of these traits, however, these media effects do not promote gendered assessments.
The impact of trait coverage on evaluations of 2010 U.S. House candidates
Note: Dots for “Strong Leader,” “Empathetic,” and “Trustworthy” are ordered logistic regression coefficients with 95 percent confidence intervals. Dots for “Competent” and “Has Integrity” are OLS regression coefficients with 95 percent confidence intervals. Refer to tables A8 and A9 for the full regression equations.

The results provide compelling evidence that voters evaluate male and female House candidates in similar ways. For none of the five traits we examine does the sex of the candidate affect respondents’ assessments of either Democrats or Republicans. Moreover, the media coverage on which voters rely—while influential—does not foster gendered evaluations, but does underscore the importance of specifying models to take into account these effects. Overall, the findings suggest that perhaps voters are just as willing to elect women as men because they evaluate them similarly on a range of trait dimensions.
The Electoral Context of the 2010 Midterm Elections: Generalizability of the Findings
Because our analysis focuses on one level of office in a single election year, it is reasonable to wonder whether our findings are a product of the electoral environment of House races in 2010. Although it is important to attend to the possibility that there might be different gender dynamics at play depending on the level of office sought or the cycle in which candidates compete, our research design and findings suggest that the conclusions we draw are portable.
One potential issue concerns the emergence in 2010 of the Tea Party and some of its very conservative female candidates. Republican Vicky Hartzler, for example, challenged (and defeated) longtime Democratic incumbent Ike Skelton in Missouri’s 4th congressional district. Hartzler’s positions could hardly be more conservative. She opposes hate crime legislation, supports repealing the Affordable Care Act, backed a bill that would have allowed prosecutors to charge women who obtained late-term abortions with murder, and co-sponsored legislation that restricts the Department of Labor from regulating farm labor by children under the age of 18. Footnote 85 The absence of gender differences in media coverage and voter evaluations could perhaps be accounted for by the fact that women like Hartzler ran campaigns that look very different from those of a typical female candidate. Although conducting in-depth analyses at the district level is prohibited by sample size, the fact that our results are virtually identical for Democratic and Republican candidates casts strong doubt on this possibility (e.g., figure 5). If unusual Tea Party female candidates were driving our results, then it is highly unlikely that we would see very similar findings for both parties.
A second concern could arise from the issue environment of 2010. If the issues that occupied the most attention in the campaign served to diminish disadvantages for women, then our results might be confined to contexts with a favorable issue environment for female candidates. But 2010 seems not to fit the bill. For one, “men’s” issues made more frequent appearances in news coverage than did “women’s” issues. In addition, the economy, often considered the domain of male candidates, was the most prominent issue in the campaign, receiving news coverage in 80 percent of House districts. The overall environment then, appears to have carried ample opportunities for women to be put at a disadvantage. The fact that we found no gender differences suggests that our results are not a product of an unusually female-friendly electoral context in 2010.
Moreover, our findings are consistent with the only other analysis of this type. Hayes’s assessment of gender stereotyping in the 2006 U.S. Senate elections, while more limited in scope, finds that journalists tend not to cover candidates in gendered ways, and that candidate sex is much less powerful than candidate party affiliation in shaping voters’ perceptions. Footnote 86 Given that 2006 was a wave election that the Democrats rode into power, whereas 2010 swept the GOP back into control, it seems unlikely that our findings are the product of electoral idiosyncrasies or a particular political context. Of course, the only way to be sure is for future work to apply our methodology to other election cycles. While labor-intensive, we think the payoff of this kind of detailed analysis is substantial. Footnote 87
Our findings likely generalize not only to House races beyond the 2010 election cycle, but also to other levels of office. Indeed, one of the major reasons we focus on House elections is that low-information races are where gender stereotyping would be the most likely to occur. Voters are more inclined to rely on information shortcuts—such as sex or party identification—when they lack more substantive knowledge about candidates. Because House races tend to be low-information affairs, our research design allows us to offer an unusually thorough assessment of gender stereotyping in a venue where it might be particularly likely. And our null results withstand conditions that facilitate the use of heuristics. Given that the United States has more than 500,000 elective offices, and all but 537 are situated at the state or local level, the overwhelming majority of these contests are also low-salience races where voters know little about the candidates except their party identification and sex. This is not much different from the typical House race. Accordingly, the extent to which the media and voters engage in—or refrain from—gender stereotyping in U.S. House races likely applies to lower level races that garner even less attention.
For the purposes of understanding gender dynamics, our focus on House elections also does not prevent us from extrapolating, with caution, to statewide contests. To be sure, the volume of news coverage, the incumbency advantage, and the role of party identification in vote choice can vary significantly between House and statewide elections. Footnote 88 But for all their important differences, it is not clear why we would expect House races and statewide contests to differ fundamentally in the level of gender stereotyping they encourage. In terms of news coverage, for example, 90 percent of the races in our data set garnered media attention, and the typical newspaper ran a story every other day from October 2–November 2. Regardless of whether the number of stories in our data set is large in absolute terms, the coverage is indeed influential. In five of our ten models, at least one indicator of positive or negative trait coverage is a statistically significant predictor of candidate assessments. As for incumbency rates, which are higher in House than statewide races, we find that the incumbency advantage does not explain the lack of gender differences; candidate sex does not predict media coverage or voters’ assessments even when we restrict the analysis to open-seat contests. And party identification seems now to be as salient a cue in statewide races, where voters are well sorted ideologically. Our media results, of course, are restricted to local newspaper coverage, so it is quite possible that statewide races, many of which exist in a more diverse information environment, will see different patterns in different types of media. The newspaper coverage they receive, however, will likely be similar.
This point is particularly important as we consider Hillary Clinton’s potential bid for the White House in 2016. A wide body of research about Clinton’s 2008 campaign details a series of barriers she confronted from the media and the voters on the campaign trail. In fact, a 2009 issue of Politics & Gender was devoted almost entirely to the gender dynamics involved in Clinton’s experiences. The contributors provide examples of outright misogyny and conventional gender stereotyping, as well as a discussion of whether Clinton’s candidacy activated gender consciousness and group solidarity among the electorate. Footnote 90 Other work chronicles instances in which references to Clinton’s appearance and family background sought to undermine her credibility. Footnote 91 And in a book-length treatment of the 2008 Democratic primary, Regina Lawrence and Melody Rose argue that gender stereotypes, journalistic norms, and the candidate and her competitors shaped—and will continue to affect—the prospects of female presidential candidates for the foreseeable future. Footnote 92 Although none of this work focuses specifically on local newspaper coverage, it does make clear that female candidates competing in the highest-profile contests might find themselves battling sexism or stereotyping in venues apart from local newspapers. From reporters to pundits to political elites to voters, presidential campaigns in particular may provide more opportunities for gender biases and stereotyping to rear their heads. Footnote 93
Conclusion
Our examination of media coverage and voters’ evaluations of candidates for the U.S. House of Representatives reveals no systematic gender differences. The detailed content analysis of newspaper coverage during the 2010 midterms found not only that news outlets devoted a comparable number of stories to men and women running for office, but also that those articles looked the same. Male and female candidates were equally likely to receive mentions of their gender and they were associated with the same traits and issues. Our analysis of Cooperative Congressional Election Study data indicates that voters were just as unlikely as journalists to assess candidates in traditionally gendered terms. Instead, partisanship, ideology, incumbency, and news coverage—long identified as important forces in congressional elections—shaped voters’ evaluations. Candidate sex did not. These conclusions emerged from a study of unusual depth and scope, encompassing media and survey data from nearly 350 House districts involving more than 100 female and 500 male candidates. In contrast to much of the existing literature, as well as much popular commentary, women did not appear to be treated differently than their male counterparts.
At the same time, there are a number of critical questions that our analysis cannot answer. We view these as promising opportunities for the reinvigorated study of the political environment that female candidates navigate in contemporary American politics and beyond. Footnote 94 We see three potentially fruitful lines of inquiry (although there are undoubtedly more):
-
Campaign behavior and candidate quality: One explanation for our findings—that women and men are not treated differently on the campaign trail—is that journalists and voters simply no longer find candidate sex relevant. But it is also possible that strategic campaign behavior by female candidates helps “pre-empt” the damage that stereotypical attitudes could do to their bids for office. In other words, journalists and voters could hold biases that would indeed harm female candidates. But knowing this, women portray themselves in ways designed to attenuate the potentially negative effects, thereby evading bias only by strategically running counter-stereotypical campaigns. Footnote 95 Alternatively, it could be that the equality we report stems from the fact women are, on average, better candidates than men. Footnote 96 In that case, our findings could partly reflect the fact that women begin at a “default” disadvantage but overcome that deficit with greater skill as campaigners. Footnote 97 More work that directly ties the content of candidate communications to news coverage and voter attitudes would help to illuminate these potential mechanisms. In addition, studies over multiple election cycles, as well as at the primary stage of the electoral process, could leverage longitudinal variation to determine whether the prevalence of gender differences in news coverage or public opinion varies with changes in female candidates’ quality and campaign strategies.
-
Measurement: Like most other work, our analysis measures gendered attitudes explicitly, examining whether they emerge (at least among voters) from responses to closed-ended survey questions. But social desirability bias may confound our ability to divine people’s true feelings about female candidates, especially if changing social norms have rendered the expression of gender stereotypes less acceptable than it once was. While we do not think alternative measures would fundamentally change our results—and they could not affect our media analyses—further research may benefit from using open-ended questions to complement traditional survey measures. Footnote 98 In addition, although measures of implicit attitudes have not been widely used in the women and politics literature, they have been valuable to scholars studying racial attitudes. Footnote 99 Measures such as the Implicit Association Test Footnote 100 may offer innovative ways to uncover underlying attitudes relevant to voters’ judgments of female candidates. Neither of these approaches is likely to reveal widespread bias among the electorate, but they may help scholars overcome some of the limitations of traditional survey techniques.
-
Variation in women’s representation globally: In nations where the rules of the electoral game include quotas, legislatures see substantial increases in women’s political representation and the diffusion of public policies that benefit women. Footnote 101 Moreover, Eileen McDonagh argues that, at least in part because of quotas, many democracies are more likely than the United States to view women as well-suited to govern. Footnote 102 Does media coverage of, or voters’ attitudes toward, female candidates vary systematically with exposure to women in high-level office? Are the most important traits and issues associated with candidates contingent on the extent to which a nation prioritizes public policies that benefit women? Although our analysis cannot speak to these questions, the fact that media coverage affects voters’ attitudes (albeit it in a non-gendered way) raises opportunities for far-reaching cross-national analyses.
Ultimately, we would highlight two takeaways from our study. Based on our extensive analysis, it is quite possible that the electoral landscape is far more favorable to women than it was even just two decades ago, when the study of gender stereotyping was in its heyday. In this sense, the story is hopeful for those concerned about the small number of women holding elective office in the United States today. The media and voters may not be the obstacles for female candidates that they once were. In fact, reduced media and voter bias have likely contributed to the small increases in women’s numeric representation that have occurred in the last decade.
But because women’s under-representation remains pronounced, our results also make it very clear that women’s absence from elite-level politics originates from sources far deeper than the contemporary electoral landscape. From this perspective, prospects for women’s fuller political inclusion are less rosy. Indeed, perceptions of gender differences on the campaign trail—regardless of empirical reality—may foster and perpetuate women’s reluctance to run for office. Jennifer Lawless and Richard Fox’s national surveys of potential candidates reveal that a majority of women do not believe that women who run for office perform as well as men. Moreover, most think that female candidates are subjected to sexist media coverage and gender discrimination from voters. Footnote 103 To the extent that gender bias on the campaign trail is considerably less pervasive than much popular commentary suggests, or that candidates’ experiences in non-presidential contests are fundamentally different, disseminating that information could begin to close the gender gap in political ambition. Footnote 104
Until scholars, the media, and practitioners concerned about women’s under-representation begin to share the results of studies like ours, deeply embedded patterns of traditional gender socialization will continue to make it far less likely for women than men to emerge as candidates. And there is no reason to expect that this pattern will not hold for the next generation. Footnote 105 As long as women continue to represent only a fraction of federal candidates, their numeric gains in political institutions across the country—and throughout the world—are limited. Continuing to study the reasons that women are less likely than men to emerge as candidates in the first place, therefore, will likely pay the highest dividends for developing a better understanding of the factors that contribute to women’s numeric under-representation and the substantive and symbolic benefits that their presence often confers.
Supplementary Materials
-
• Tables A1–A11
-
A1. Candidates Included in Media Analysis, by Incumbency, Party, and Sex
-
A2. Summary Statistics on Newspaper Sample and News Stories
-
A3. Specific Trait References Coded from News Coverage
-
A4. Specific Issue References Coded from News Coverage
-
A5. The Impact of Candidate Sex on Trait Mentions in 2010 U.S. House Campaign News Coverage
-
A6. The Impact of Candidate Sex on Issue Mentions in 2010 U.S. House Campaign News Coverage
-
A7. Evaluations of 2010 U.S. House Candidates’ Traits, by Candidate Party and Sex
-
A8. The Impact of Candidate Sex on Evaluations of Democratic U.S. House Candidates, 2010
-
A9. The Impact of Candidate Sex on Evaluations of Republican U.S. House Candidates, 2010
-
A10. Evaluations of 2010 U.S. House Candidates’ Competence and Integrity, by Candidate Party and Sex
-
A11. Newspapers Included in the Media Content Analysis, by Congressional District
-
• Description of Newspaper Coding
-
• Coding of Media Coverage Variables
-
• Replication Data
-
• Explanatory File