

Although all governments are endowed with policymaking powers to redistribute income to powerful interests in society, some governments exhibit greater concern for aggregate welfare than others. Government behavior may itself be endogenously determined by a number of economic, political, and institutional factors. For instance, in the presence of a weak system of checks and balances or a low level of political competition, it may be easier for governments to redistribute resources toward those special interests they favor. It is the goal of this article to study quantitatively the relative welfare-mindedness of governments in a large sample of countries and to try and understand the differences in government behavior across countries using economic, political, and institutional factors.
We proceed in two steps. The first step is to quantify the extent to which governments are concerned with aggregate welfare relative to any other private interests. This requires data in which the redistributive powers of governments are inherent, and which reflect the particular tradeoff between aggregate and private interest. In our analysis, we use trade policy determination as the context in which government behavior is evaluated. There are at least two reasons for this. First, it is well established in theory and in empirical work that trade policy, like many other government policies, is redistributive and is used by governments to favor certain constituents over others.Footnote 1 Second, the recent theoretical literature in this area (following the work of Grossman and HelpmanFootnote 2) offers a parsimonious and empirically amenable structural platform that is suitable for estimating the primary parameter of interest: the relative preference of a governments for aggregate welfare over private rents, that is, the welfare-mindedness of governments. This relative weight is known in the literature (detailed below) as the parameter a.Footnote 3
The results from the first step, using data from more than fifty countries, show substantial variance across countries in the weight that their governments place on aggregate social welfare versus their private interests (the a parameter). For instance, the estimates for countries such as Nepal, Bangladesh, Ethiopia, and Malawi are many-fold lower than for Hong Kong, Singapore, Japan, and the United States.
Although the parameter a is taken to be primitive in the Grossman-Helpman model, the wide variation in a across countries hints at more fundamental factors underpinning a. We therefore view the results from the first step as coming from a model where the determinants of a are a “black box.” In the second step we unpack the box. Doing so requires a continuity between the model that produced the first-step estimates of a, and the models admitting details about what might determine these a's. We specifically consider models in which trade policy is determined as the outcome of electoral competition and legislative bargaining. They suit our purpose well, and we use them to advance new hypotheses about associations between political, institutional, and economic variables on the one hand, and the preferences of policymakers on the other. Differences in the electoral setups or legislative decision process make some governments more inclined to maximize social welfare when making trade policy decisions and other governments less inclined to do so. This theory-based empirical analysis distinguishes our study from other cross-country studies about the associations between institutions and policy outcomes.
Empirically, we report a number of new findings. The greater the proportion of the population that is informed, the larger is government's concern for welfare. The less ideologically beholden the public is to the parties in the legislature, the more welfare-maximizing is their government. The more productive is media advertising, the greater is the demand by politicians for special interest money (in order to sway uninformed voters while contesting elections), and the lower is the government's concern for welfare. Executive checks and balances on the powers of the legislature increase the weight on welfare, while electoral competition for the executive lowers it since candidates for the executive rely on special interest money to sway uninformed voters.
The rest of the paper is organized as follows. In the first section, we derive the Grossman-Helpman prediction of endogenous trade policy determination that enables estimation of the welfare-mindedness of governments. Industry-level data from fifty-four countries are used in the estimation exercises. These data and the resulting estimates are described in the second section. The third section derives hypotheses from electoral competition and legislative bargaining models of trade policy formation. A number of hypotheses about the relationship between specific institutional variables and the welfare-mindedness of governments are stated. These hypotheses are then taken to the data in the fourth section. The variables are described and the results are empirically analyzed. The final section concludes.
What Governments Maximize: Theory
This section presents the Grossman-Helpman (henceforth GH94) model. It provides the theoretical basis for our estimates of the extent of government concern for welfare relative to private gain. The presentation in this section is formal, because we wish to emphasize that our empirics are tightly linked to theory. Readers less interested in the technical derivation may skip to the second section directly after reading up through equation (1). It will be beneficial, however, to intuitively understand equation (5) since it provides the link between the first and second steps in this article. The GH94 model is a simple general equilibrium political economy model that features a (unitary) government of a small open economy that values both its population's welfare as well as money contributions by import-competing producers who gain from increased profits. Since trade policy may be used by government to increase domestic prices over world prices, import-competing producers organize politically into lobbies and pay the government in order to distort prices using tariffs on imports. The equilibrium tariffs are the result of governments maximizing their objective and lobbies doing similarly. Intuitively, this is based on the following calculus.
We mentioned that the government is interested not only in lobbying money but is also concerned about the collective welfare of its public. Suppose it weighs a dollar of its public's welfare and a dollar of lobbying contributions equally. Then the government will require lobbies to pay up to the extent of the welfare loss that the tariff, which benefits the lobbies, inflicts on the public.Footnote 4 If government's relative weight on public welfare is ten times larger than on money contributions, for example, then it will require lobbies to pay ten times as much as the welfare loss from the price distortions. If the government is willing to sell out its public cheaply then it will require less in contributions from lobbies than the amount of the welfare loss.
The extent of the welfare loss, in turn, depends importantly on the elasticity of import demand. Lobbies, on the other hand, calculate their optimal money contributions on the basis of the rents they expect to receive from the tariffs. These, in turn, depend (positively) on the output-to-import ratio. Thus, the tariffs set in political-economic equilibrium depend on import demand elasticities and output-to-import ratios in each sector. The main advantage of the GH94 model is that it provides an explicit relationship between tariffs and these measurable variables that may be used to estimate the relative weight that a government places on welfare versus contributions. This relationship appears in equation (8).
The purpose of the rest of this section is to derive equation (8) formally. Our notation here borrows from GH94 and Goldberg and Maggi.Footnote 5 Consider a small open economy with n + 1 tradable sectors. Individuals in this economy are assumed to have identical preferences over consumption of these goods represented by the utility function:

where good 0 is the numeraire good whose price is normalized to one. The additive separability of the utility functions eliminates cross-effects among goods. Consumer surplus from the consumption of good i, s i, as a function of its price, p i, is given by s i(p i) = u(d(p i)) − p id(p i), where d(p i) is the demand function for good i. The indirect utility function for individual k is given by v k = y k + ∑i=1ns ik(p i), where y k is the income of individual k.
On the production side, the numeraire good is produced using labor only under constant returns to scale, which fixes the wage at one. The other n goods are produced with constant returns to scale technology, each using labor and a sector-specific input. The specific input is in limited supply and earns rents. The price of good i determines the returns to the specific factor i, denoted π(p i). The supply function of good i is given by y i(p i) = π′(p i). Since rents to owners of a specific input increase with the price of the good that uses the specific input, owners of that specific input have a motive for influencing government policy in a manner that raises the good's price.
Government uses trade policy, specifically tariffs, that protect producers of import-competing goods and raise their domestic price. The world price of each good is taken as given. For good i the government chooses a specific (per unit) import tariff, t is, to drive a wedge between the world price, p i0, and the domestic price, p i, p i = p i0 + t is. The tariff revenue is distributed equally across the population in a lump-sum manner.
Summing indirect utility across all individuals yields aggregate welfare W. Aggregate income is the sum of labor income (denoted l), the returns to specific factors, and tariff revenue. Therefore aggregate welfare (as a function of domestic prices) is given by:

where imports M i = d i − y i.
We also assume that the proportion of the population of a country that is represented by organized lobbies is negligible.Footnote 6 This allows us to ignore the incentives to lobby for lower tariffs on goods that are consumed, but not produced by owners of specific factors, as well as the incentives to lobby for higher tariffs on goods that are neither consumed nor produced, but that generate tariff revenue. While this assumption is imposed on the theoretical model, it is based on relatively solid empirical grounds, as consumer (and taxation) lobbies are uncommon relative to producer lobbies. In other words, in our setup, lobbies only care about the rents to their specific factor. More formally, the welfare of lobby i is simply given by:

The objective function of the government reflects the trade-off between social welfare and lobbyists' political contributions. These contributions may be used for personal gain, or to finance re-election campaigns, or a variety of other self-interested expenditures that may buy the government favor with its constituents. Thus, the government's objective function is a weighted sum of campaign contributions, C, and the welfare of its constituents, W:

where the parameter a is the weight government puts on a dollar of welfare relative to a dollar of lobbying contributions. Lobby i makes contribution C i to the government and therefore maximizes an objective function given by W i − C i.
We presume that the equilibrium tariffs arise from a Nash bargaining game between the government and lobbies. Goldberg and Maggi show that this leads to the same solution as does the use of the menu auction model employed in Grossman and Helpman. The Nash bargaining solution maximizes the joint surplus of the government and lobbies given by the sum of the government's welfare, G, and the welfare of each lobby net of its contributions. The joint surplus becomes
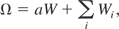
Note that (5) implicitly assumes that all sectors are politically organized.Footnote 7 This is true of manufacturing sectors in most advanced countries, where political action committees (United States) or industry associations (Europe) lobby their governments. Such industry coalitions are prevalent in developing countries as well. Other than in the United States, rules and regulations requiring lobbying activity to be reported are blatantly absent. We take this lack of transparency as proof of the pervasiveness of lobbying activity. Since our analysis is conducted at the aggregation level of twenty-eight International Standard Industrial Classification (ISIC) three-digit level industries, the assumption that all industries are organized is an empirically reasonable one.Footnote 8
Under the two assumptions that all sectors are organized and a negligible proportion of the population is organized into lobbies, the joint surplus takes the simple form:

The first order conditions are:

Solving, we get the tariff on each good that maximizes the joint surplus:

In equation (8) t i = (p i − p i0)/p i0 is the ad valorem tariff for good i, where p i is the domestic price for good i at home and p i0 is its world price. X i /M i is the equilibrium ratio of output to imports and e i = −M i′·p i /M i is the absolute elasticity of import demand. Thus, producers of good i are able to “buy” protection (t i > 0). Industry output, X i, captures the size of rents from protection. Imports determine the extent of welfare losses from protection, so the smaller are the imports the higher is the tariff. The well known rule about taxation according inverse-elasticity is in evidence here: the lower is the absolute elasticity, e i, the greater is the price distortion, and conversely. Known as the Ramsey-pricing rule in the economics literature, it is the least inefficient way to distort prices, since it creates the smallest welfare loss.
What Governments Maximize: Comparative Estimates of a
Equation (8) suggests a simple way of estimating the trade-off parameter a. Rewrite (8) as

We use a stochastic version of this equation to estimate the parameter a. The data, described below, are across industries and time for each of fifty-four countries. Indexing the time series by t, the econometric model we use to estimate the a's is

where the error term εit is identically independently normally distributed across observations for any specific country, with homoscedastic variance σ2. The variance is allowed to vary across countries. The coefficient β0 = 1/a. Taking the output-to-import ratio and the import elasticity to the left-hand side (lhs) of the equation mutes issues concerning endogeneity to tariffs of output, imports, and the elasticity of import demand.
Model 10 is estimated for a set of fifty-four high, middle, and low-income countries.Footnote 9 For these countries we have tariff data (incompletely) across twenty-eight three-digit ISIC industries over the 1988–2000 period.Footnote 10
Industry level output and trade data are from the World Bank's Trade and Production database constructed by Nicita and Olarreaga.Footnote 11 We use the import demand elasticities estimated for each country at the six-digit Harmonized System (HS) level by Kee, Nicita, and Olarreaga.Footnote 12 Since the standard errors of the elasticity estimates are known, they are treated as variables with measurement error and adjusted using a Fuller-correction.Footnote 13 The import demand elasticities are missing for four countries—Ecuador, Nepal, Pakistan, and Taiwan. For them we use the industry averages of the elasticity estimates taken across all other countries.
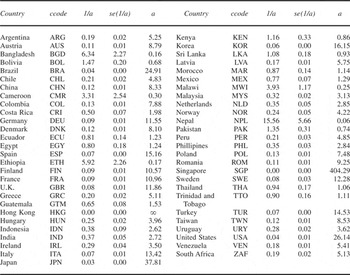
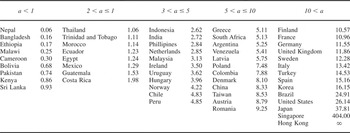
Estimates of the coefficient β0 in equation (10), denoted 1/a, and its standard error are displayed in Table 1 for the fifty-four countries. Inverting these coefficients yield estimates of the parameter a. They appear in the last column of Table 1. Several interesting and surprising features of these estimates are evident in Table 2, where countries are sorted by their a estimates. In general, richer countries have higher values of a than poorer countries. That is, governments of richer countries are revealed by their trade data to place a much greater weight on a dollar of welfare relative to a dollar of private gain (contributions). The last two columns indicate that countries with a > 10 have per capita incomes at the level of Organization for Economic Cooperation and Development (OECD) countries (with the exception of Brazil and Turkey). Middle income countries have fairly high values of a. All South American economies in our sample, with the exception of Bolivia (0.68), fall within this group. Other notable liberalizers come from Asia: India (2.72), Indonesia (2.62), Malaysia (3.13), Philippines (2.84). The lowest a's belong to the poor Asian nations of Nepal (0.06), Bangladesh (0.16), Pakistan (0.74), and Sri Lanka (0.93), and the African nations of Ethiopia (0.17), Malawi (0.25), Cameroon (0.30), and Kenya (0.84).
Estimates of a

Notes: Hong Kong has zero tariffs. In the runs with fifty-four observations (full sample) Hong Kong's a is set to 10,000.
Countries ranked by their estimates of a

Notes: China, Ethiopia, Hong Kong, and Taiwan are excluded from the remainder of analysis. Only democracies during 1988–96 are included.
An important feature of our results is that, in contrast with previous examinations of the Grossman-Helpman model,Footnote 14 our estimates of a are reasonable, both qualitatively (poorer countries have smaller a's than richer countries) and quantitatively (only extremely low-tariff or zero-tariff countries like Hong Kong and Singapore have a's greater than 50, while this was routinely found for Turkey, Australia, and the United States in the studies referenced above). We find the cross-country variation in a to be striking and intuitively pleasing. Countries with low a's accord with the widely accepted view that governments in those countries are also among the most corrupt in the world. Indeed the Spearman rank correlation between the Transparency International Corruption Perception Index for the year 2005 and our measure of government willingness to trade off social welfare for political rents is 0.67, and we can statistically reject the assumption that the two series are uncorrelated. In 2005 the Transparency International Corruption Perception index rank of the two countries at the bottom of our a rankings (Nepal and Bangladesh) were 121 and 156 out of 157 countries, respectively. Similarly, the Transparency International Corruption index rank of the two countries at the top of our a rankings (Singapore and Taiwan) were 5 and 15, respectively.
Some results we find to be surprising are (1) the low a for Mexico, despite its membership in the North American Free Trade Agreement (NAFTA), (2) the lower than expected a for the OECD countries of Norway, Ireland, and the Netherlands (in the 3 < a ≤ 5 group), (3) the relatively high a's for the socialist countries in transition, including Poland, Hungary, and Romania, (4) the relatively high a's for Japan and China, both of whom have been criticized for being mercantilistic—protectionist and export-oriented.
These unexpected results emphasize the fact that the theoretical model does not base its prediction simply on openness (low or high tariffs), but also on the import-penetration ratio, and import demand elasticities, as well as their covariance with tariffs, and each other. The incidence of tariffs in industries with high import demand elasticities reveals the willingness on the part of governments to (relatively) easily trade public welfare for private gain,Footnote 15 since in welfare-oriented countries the most price-sensitive goods should be distorted the least. The incidence of tariffs in industries with high import-to-output ratios also reveals the willingness on the part of those governments to trade public welfare for private gain since distorting prices in high-import sectors creates large deadweight losses. Empirically, this is not only revealed by the surprising estimates discussed above, but also by the relatively low correlation between our estimates of a, and average tariffs, which is estimated at 0.33, and compares badly with the correlation with the index of perceived corruption. Thus, the estimates underscore the need to consider more than simplistic measures of openness in order to make inferences about the terms at which different governments trade public welfare for private gain. The Grossman-Helpman measure is not only theoretically more appropriate, but also empirically appears to be quite distinct from simpler measures.
We are ultimately interested in the deeper question of why governments behave as they do. What explains the variation in the estimates of a across countries? Why do some countries have low a's and others high a's? Are polities in poorer countries content to let their governments cheaply trade their welfare away? If so, why? And why in richer countries do we observe the opposite? These are the questions to which we devote the remainder of the article.
Explaining the Variation in a: Theory
To explain why a varies across countries we delve into institutional foundations of policymaking. In this, we can take one of two routes. One is a data-driven approach that involves choosing a set of variables that adequately describe institutional details of the policy process in different countries, and use them to econometrically explain the cross-country variation in a. Such a method would shed light on those institutions that motivate governments to behave as they do in setting trade policy. The second is to seek structural explanations of how institutions might explain the variation in a across countries. We opt for the latter in this article, since it continues in the tradition of the GH94 model that delivered our estimates for a.Footnote 16
Positive theories that model policy outcomes based on institutional details of the policy process fall into three broad categories.Footnote 17 Electoral competition models focus on the process by which parties are represented in the legislature, and feature details about the structure of voter characteristics (informed versus uninformed) and voter preferences. Lobbying models focus on lobbying process and feature details about the lobbying game. Legislative bargaining models feature specific legislative decision making processes that may emphasize, for example, agenda-setting and the allocation of policy jurisdictions (for example, ministers, committee chairs). In the first part of this paper, we used the GH94 lobbying model to estimate the weight put on social welfare from trade policies of governments. But the determinants of these weights were a “black box.” The objective of this section is to unravel the determinants of a as viewed from the theoretical lens of electoral competition and legislative bargaining models.
Electoral Competition and Lobbying
Integrating lobbying and electoral competition has been done in three important models, respectively, by Austen-Smith, Baron, and Grossman and Helpman.Footnote 18 They model policies as outcomes from the interaction of two parties and special interest groups that make lobbying contributions to them. They differ in the motives of the lobbyists. Lobbyists are purely interested in altering electoral outcomes in Austen-Smith and Baron. In Grossman and Helpman, lobbyists are also able to influence policy outcomes by altering party platforms via lobbying. We will abstract from the electoral motive and focus on this influence-seeking motive in order to connect the a parameter with more primitive institutional details. To this end, we describe the 1996 Grossman-Helpman (henceforth GH96) model.
Two parties, A and B, contest an election for seats in the legislature. Each party advances a slate of candidates, and the country votes as a single constituency. Once elections are over, and the votes counted, both parties occupy seats in legislature in proportion to the popular vote count (more on the distinction between this proportional system and a pluralitarian system below).
There are two classes of voters, informed and uninformed. The former have immovable preferences based on (1) the policy position of each party and (2) other characteristics of the party (liberal, conservative). Uninformed voters, on the other hand, may be induced to move from their current position via campaign expenditures on slogans, advertising, and other informational devices designed to impress them. The difference in campaign spending by the two parties crucially determines how many uninformed voters they will be able to move to their side. For this reason, politicians representing each party demand contributions. Lobbies form to supply contributions.
On the lobbying side we consider the case, as in the GH94 model, where each sector is represented by a single lobby, but the fraction of the organized population represents a negligible proportion of the total population. Each lobby is interested only in protecting its own sector, and there is no competition or conflict among lobbies.Footnote 19 Each party thus receives contributions from multiple lobbies, with each lobby's interest being a single element of the vector p. The game comprises of two stages. In the first stage, lobbies announce their contribution schedules (as a function of the tariff afforded to their sector), one to each of the two parties (party A and party B). In the second stage, the two parties choose their vector of tariffs (their policy platforms) in order to maximize the representation of their party in the legislature. The lobbies then pay their promised contributions, the parties wage their campaigns, and the legislature/congress that assumes office implements one of the party's tariff vector (legislative processes are a black box in electoral competition models—we unpack this box below).
A political microfoundation for a is found in the structural analog of the expression for the joint surplus in equation (5), which may be written separately for each lobby i as:

In the GH94 unitary government case, the politically optimal tariffs in each sector i is set by the government in a way that maximizes the weighted sum of the aggregate welfare of lobby i and the aggregate welfare of the country's citizens. The government is induced by lobby i to weight the lobby's interest by (1 + a), which is greater than the weight of a it places on the public's aggregate interest. We will observe a parallel between equation (11) and the joint surplus in the electoral competition game, and we use it to pin down the determinants of a from the parameters of the electoral competition game.
Grossman and Helpman (Reference Grossman and Helpman1996, p. 274 eq. (4)) show that the joint surplus in the electoral competition game involving parties A and B and one (say, sector i) lobby is

As in equation (11), W i(t i) is the (net of contributions) welfare of lobby i. In equation (12), W(t i) is the aggregate welfare of informed voters. There are four parameters to consider. α is the fraction of voters who are uninformed. If α = 0, then W(t i) becomes the welfare of the average voter, just as in equation (11). We will see below that buying the support of uninformed voters makes special interests groups important to political candidates, and α determines the magnitude of the importance of special interest contributions. f > 0 quantifies the diversity of views about the two parties among voters in terms of all fundamental characteristics (for example, liberal-conservative) except their policy positions about the tariff t i. The closer is f to zero the greater is the diversity of views; the larger is f the closer are the two parties perceived to be. This parameter is relevant because the more important these divergences among the parties are to voters—the more committed they are to a particular party for ideological reasons, for example—the less likely they are to be swayed by trade policy. h > 0 quantifies the ability of campaign spending to move the position of an uninformed voter. The greater is h, the more productive is a dollar of campaign spending in influencing the uninformed voter. Since money becomes a useful instrument with which to sway the uninformed voter, the sources of this money—special interest groups—become useful to the political candidates. Finally, φK is the probability that, once elections are over, the legislature actually adopts party K's trade policy platform (sector i tariff promised by party K before the election). With two parties, φA + φB = 1. We will see below the relevance of this key parameter in formulating testable hypotheses.
The parallel with equation (11) is clear. Equation (12) shows that each party is induced by lobby i to maximize a weighted sum of the aggregate interest of informed voters and the aggregate interest of members of organized interest groups. The aggregate interest of informed voters (interest groups) receives a weight that increases (decreases) with the share of informed voters in the population (1 − α), decreases (increases) with the diversity of their views about the parties' ideological positions, and decreases (increases) with how easily uninformed voters are swayed by campaign spending. We will use these and other observations to make empirically testable predictions.
Predictions
Proportional vs. Pluralitarian Systems
In a proportional system seats in the legislature are allocated to the two parties according to the proportion of the popular vote. With just two parties, and the country voting as a single constituency, the objective of maximizing the number of seats in legislature is equivalent to maximizing plurality. That is, the outcome is exactly the same as if the system of representation were majoritarian. The GH96 model is such a two-party one-constituency model. The real world is different in two important respects.
First, a country typically votes not as a single constituency, but as several geographically distinct constituencies. In a typical majoritarian system each district elects a single representative to the legislature. In a typical proportional system each district is represented by multiple candidates so that a district's seats are divided between the two parties in proportion to the popular vote. If districts are heterogeneous, say, with respect to the composition of specific factors, then it is possible for a majoritarian system to favor special interests more than a proportional system. This is demonstrated theoretically in Grossman and Helpman.Footnote 20 They advance a two-party three-good, three-district model in which the districts are heterogeneous in the composition of (three) specific factors. There are no lobbies, however, each legislator seeks to represent the interests of their average constituent. Grossman and Helpman show that if both parties seek a majorityFootnote 21 in the legislature then, because the election of legislators is tied to particular geographic or economic interests, there is greater protection than if legislators' interests were more closely tied to the national, not regional, interests.
Consider the two-party three-district example under a system of proportional representation in which candidates from both parties compete for multiple seats within the same district. EvansFootnote 22 shows that it is more likely in the case of proportional representation that one party sweeps the election, that is, wins a majority in all three districts, than under a majoritarian system (in which the single seat per district is determined by majority vote in each district). If one party sweeps the election, the policy it chooses reflects national, not regional, interests, that is, free trade.Footnote 23 Thus, a majoritarian system of representation leads to greater protection than proportional one.Footnote 24
This result does not require the presence of lobbies because the model is devoid of uninformed voters. If lobbies were admitted, what does this result imply about the distribution of a across the two systems of political representation? We surmise that since a majoritarian system is predisposed to being protectionist (it has a lower probability of sweeping the states than a proportional one), lobbies will ensure their interests are weighed more heavily in equation (12) in majoritarian systems than in proportional ones. That is, all else constant, a's are lower in proportional than in majoritarian systems. A formal demonstration of this requires extending the GH96 single-district electoral competition model with uninformed voters (whose presence motivates the existence of lobbies) to n districts.Footnote 25 We state our first hypothesis as:
H1:
A majoritarian system favors special interests more than does a proportional system. Majoritarian systems are therefore associated with low a's.
It is possible that the three-district example exaggerates the predisposition of proportional systems to be less protectionist than majoritarian ones, so that as the number of districts increases, the probability of sweeping the districts becomes more remote and the distinction between the two systems disappears. A rejection of hypothesis (1) would then indicate that the world is well-approximated by the GH96 two-party single-district model in which proportional representation is equivalent to plurality.
The second difference between the GH96 construct and the real world is that democracies typically have more than two parties. In the data section we attempt to reconcile the two-party theoretical model with multiparty governments that we find in the data.
Uninformed Voters
Consider the fraction α of uninformed voters. A comparison of the weights on W in equations (11) and (12) indicates that, all else held constant, a → 0 as α → 1. The intuition for this result is this. In the absence of lobbying, parties will choose their platform to attract the maximum number of informed voters. Denote this tariff as t i*. To persuade party A to adopt a tariff t i, lobby i must contribute an amount that delivers at least as many uninformed votes as would t i*.Footnote 26 The larger is the proportion of uninformed voters α, the more pivotal the uninformed voter becomes. Since the resources for launching a campaign to sway uninformed voters are provided by lobby i, the lobby's welfare (here profits) gets greater weight in equation (12). This leads to our second prediction:
H2:
The larger is the proportion of uninformed voters in the population, the lower is a, and conversely.
Given the cross-country distribution of a, testing this hypothesis amounts to testing the validity of the uninformed voter construct itself. The existence of uninformed voters is central to the GH96 model since it motivates the existence of lobbies. It is also central to a number of models that feature Baron's idea of the uninformed voter.
Party Ideology
Consider the ideological divide between the two parties given by parameter f. The larger is f, the smaller is the diversity of views among voters over the fundamental characteristics of the two parties. A comparison of the weights on W in equations (11) and (12) indicates that, all else held constant, a → 0 as f → 0. The reason why the weight put on social welfare increases as f increases is this. With little diversity of views among voters, a tariff that deviates from that favored by the average voter does great damage electorally. When there is great diversity of views and the two parties are considered to be very dissimilar, the parties can afford to set (district i's) tariffs different from t i* and still retain the favor of voters who were inclined to vote for them on the basis of, say, ideology. In contrast, if voters are indifferent between the two parties' basic characteristics, a policy that deviates from t i* risks losing many voters to the other party. This leads to our third prediction:
H3:
The greater is the perceived difference in the fundamental characteristics of the two parties in the eyes of voters, the lower is a, and conversely.
In sum, if voters are clearly predisposed to one party or the other on the basis of attributes other than their policy platforms, then both parties are more cheaply able to impose welfare costs on the public. The parties will calculate that they gain more uninformed voters than lose the votes of their supporters.
Susceptibility of the Uninformed Voter
Finally, consider the productivity of campaign spending parameter h. A comparison of the weights on W in equations (11) and (12) indicates that, all else held constant, a → 0 as h → ∞. With greater power of the dollar to influence uninformed voters, it is less costly to deviate from t i*. Hence, as h increases, both parties are induced to place greater weight on the interest of lobby i than on the interest of the informed public. This leads to our fourth and last prediction from the electoral competition model:
H4:
The greater is the ability of a dollar of campaign spending to influence uninformed voters, the lower is a, and conversely.
We now turn to the interactions among legislators and the process by which decisions are made within legislatures.
Legislative Bargaining and Lobbying
The Baron-Ferejohn modelFootnote 27 is the proven workhorse in the area of legislative bargaining. Models of legislative decision making have had to struggle with Arrow'sFootnote 28 result that it is not possible to select the best action from a set of alternatives according to some voting rule (for example, majority wins). The breakthrough has been the introduction of an agenda setter who is granted institutional power to champion a specific alternative and who attempts to guide voting in the direction of that agenda. Regardless of whether that agenda is selected over the status quo, a voting equilibrium exists.
We adapt Persson's legislative bargaining modelFootnote 29 of public goods provision with lobbying to search for more hypotheses about the determinants of a. An attractive feature of the legislative bargaining model is that it allows us to link a with asymmetric powers of legislators. Specifically, it motivates the role of checks and balances on those powers, without which there would be extreme redistribution.
To make our point simply, consider legislation of a slate of tariffs {t i,i = 1,…, n}. Assume that sectors are regionally concentrated—in each of the n districts is located one sector. Every district sends one representative to the legislature. However, there is an exogenous institutional constraint on the amount of protection: the welfare loss from the set of tariffs/subsidies may not exceed a prespecified amount. This constraint may be satisfied by limiting the number of sectors that receive protection, or limiting the level of tariffs/subsidies, or both. The existence of such a constraint is motivated below. Each legislator maximizes an objective function that is the sum of the welfare of the constituents in her district and the rents obtained from tariff policy.Footnote 30 That is, a legislator cares specially about the rents from the tariff to her sector, over and above other components of welfare. There are two reasons for this assumption. One is that it is consistent with the existence of lobbies that pay the legislators for producing these rents. The other is votes: the electoral competition model in which the money is used to get uninformed voters to vote for the legislator may be embedded here.
First, consider how the legislature sets the tariff vector when there are no lobbies. The legislative bargaining game follows a typical sequence of events: (1) a legislator is chosen to be an agenda setter S; (2) she makes a policy proposal for adopting the vector {t iS}; (3) the legislature votes on the proposal, and if it gets simple majority {t iS} is implemented. Otherwise, the status quo outcome, say {t io}, is implemented. The agenda setter is obviously interested in using her powers to benefit her district, but must obtain a majority that goes along with her tariff agenda {t iS}. She must therefore guarantee at least the same payoff to the legislators she courts as they would receive under the status quo.Footnote 31 Persson shows that the agenda setter will set an agenda that forms a minimum winning coalition composed of a simple majority such that (1) legislators (sectors) outside of the winning coalition get no tariffs/subsidy even though they bear part of the welfare loss, (2) the members of the winning coalition get just enough protection/subsidy that they are not worse off than in the status quo.
The logic behind this stark, rather pessimistic, result is that intense competition among legislators to be part of the winning coalition enables the agenda setter to dictate terms. This competition drives down the “price” (or weakens the terms) a legislator can charge the agenda setter. The agenda setter uses her powers to provide the highest rents possible to her district, since the competition among legislators endows her with bargaining power.
The same logic drives the results when we introduce lobbying into the game. Suppose every sector (district) has an organized lobby that makes contributions to their legislator. Their fierce desire to have their legislator be part of the winning coalition cedes any bargaining ability they may have to the agenda setter. Their contributions are unable to move the agenda in their favor. An interesting result in the lobbying game is that since no sector outside the district of the agenda setter receives any protection/subsidy, they contribute close to zero.Footnote 32
Checks and Balances
Checks against the agenda setter's powers may be placed by an individual with influence over policy at the national level, say, a president. His policy platform consists of a specific limit on welfare losses from price distortions. Our exogenously specified limit on welfare loss is thus motivated as a way of instituting checks and balances. Once again, the same conclusion applies—competition among legislators still enables the agenda setter to get away with what rents are possible. The difference is that the rents are lower if the elected president's platform is more limiting than the status quo.Footnote 33
Clearly, a direct way of enhancing the bargaining power of legislators other than the agenda setter, and thus checking her powers, is via a binding limit on the rents the agenda setter can direct to her district. Such a national policy would then allow the legislative bargaining game to allocate rents to other districts. Regardless, both types of presidential platforms—limits on the amount of total welfare loss, or limits to the rents accruing to the agenda setter's district—will result in a lower redistribution compared with a legislature that does not allow representation of a nationwide polity capable of checking legislators. We state the first hypothesis from the legislative bargaining game.Footnote 34
H5:
Executive checks will limit the ability of legislators to impose their politically optimal welfare losses. Greater checks are therefore associated with higher values of a.
Our final two hypotheses go beyond the existing literature, and feature electoral competition for the executive. An unsatisfactory aspect of legislative bargaining theory is its presumption that the executive represents median voter interests. In most real-world democracies the executive is elected and lobbied. We therefore embed the two-party electoral competition game into the legislative bargaining model.
Electoral Competition for the Executive
Two candidates, representing parties A and B respectively, contest the presidential election. The structure of the game is essentially similar to the game used to model electoral competition for legislative seats. The main difference here is that the presidential platforms concern not the tariff directly but limits on the total welfare loss from trade protection denoted L. The executive is presumed to maximize an objective function such as equation (4), except that the argument is L (the set of tariffs t are determined conditional on L, see (13) below). When there are no lobbies, the executive seeks to maximizes national welfare and sets L = 0, eliminating the possibility of any tariff or subsidy. Lobbies representing import-competing producers attempt to move L away from zero so that they might benefit from tariffs, conditional on L, that are decided in the legislative bargaining process.
The cap on welfare loss, L, is determined as the outcome of the two-party election in which a national polity of informed and uninformed voters participate. Thus, L for each of the two presidential candidates is determined as the Nash bargaining solution toFootnote 35

where W i(L) is the (net of contributions) welfare of the lobby from district i and W(L) is the welfare of the average informed voter, α is the fraction of uninformed voters, f quantifies the diversity of views about the two parties among voters, and h is productivity of campaign spending. φP is the probability that, once elected, the president is able to get the legislature to adopt L.
The first result follows directly from equation (13). The parameter φPK—the probability of successfully legislating candidate K's executive platform—determines the weight that special interests get in the executive electoral competition game. If φPK is non-negative then the first term on the right-hand side of equation (13) indicates that L is selected to be greater than zero by both candidates. Thus, electoral competition with lobbies and uninformed voters induces both candidates to impose welfare loss on the national polity. The parameters α,h, and f work to change a in the same direction when there is electoral competition for the executive as they did with electoral competition for seats in legislature. We state this hypothesis as the next hypothesis.
H6:
Electoral competition for the executive is associated with lower values of a than if there were no electoral competition for the executive.
Importantly, the parameter φPK determines the executive's ability to impose checks on legislature's powers. When government is undivided, that is, when the executive and legislature both belong to the same party, the executive's platform is more likely to make it past the legislature than were government divided.Footnote 36 Thus, (13) implies that the higher is φPK (undivided government), the more the executive platform of candidate K is bent to satisfying special interests at the expense of the public. Conversely, if φPK is low (divided government), the executive is a more effective check on the legislature's ability to impose welfare costs on the public.Footnote 37 We state this as our final hypothesis.Footnote 38
H7:
Divided government leads to higher values of a than if the party of the executive were the same as the majority party in the legislature.
Explaining the Variation in a: Data and Results
Data
Recent interest in the influence of institutions over economic and political outcomes has led to the creation of cross-country databases of political institutions. We draw on the high-quality Database on Political Institutions (DPI) constructed by Beck and colleagues.Footnote 39 The database contains a number of variables measuring the nature of “government,” “legislatures,” “executive,” and “federalism.” They are measured both qualitatively and quantitatively, and admirably serve our purpose of measuring the variables required to test the hypotheses. We also use economic data from various issues of the World Development Indicators (WDI). Media cost data are from World Advertising Trends (WAT).Footnote 40
The theory upon which we base the empirical investigation requires us to consider only democracies.Footnote 41 We rely on the variable LIEC (Legislative Index of Electoral Competitiveness) in the DPI database to identify democracies. LIEC scores vary between 1 (no legislature) and 7 (largest party received less than 75 percent of the seats). Lower scores are given to unelected legislatures (score = 2) or if the legislature is elected but comprises just one candidate (score = 3) or just one party (score = 4). Countries with scores of 4 or less are not considered to have legislatures featuring electoral competition. Only countries in which multiple parties contested for seats in the legislature (scores of 5 or more) are considered in the sample. Among the fifty-four countries for which we have estimated the parameter a, only four are dropped on this count (China, Hong Kong, Ethiopia, Taiwan).Footnote 42
Testing hypothesis (1), requires identifying legislatures elected using a proportional system of representation—where seats are allocated on the basis of the proportion of votes received—versus a pluralitarian first-past-the-post system.Footnote 43 The variable housesys in the DPI is used to identify countries with proportional versus pluralitarian systems. housesys is coded 1 in the DPI only if the majority of the house is elected on a plurality basis. We define the binary variable proportionality = 1 − housesys to indicate legislatures in which parties are (largely) represented proportionally to the votes they receive.Footnote 44
We must reconcile the theoretical model, which admits only two parties, with the presence in our data of many countries with multiparty governments. How the probability of successfully legislating the platform of the party in power changes when there are more than two parties is the main question that must be addressed. The greater this probability (that is, large φK), the greater the weight given to special interests in equation (12), and the lower is a. In a government comprising more than one party and/or an opposition that also comprises a coalition of parties, the probability of successfully legislating the winning party's platform hinges on party concentration and cohesiveness.Footnote 45 Furthermore, Powell and WhittenFootnote 46 have argued that retrospective economic voting (giving the government credit or blame for economic outcomes) will be more likely the easier it is for voters to attribute economic outcomes to a particular party or coalition. So more cohesive coalitions have greater incentives to use economic policies for political purposes, while looser ones have fewer incentives.Footnote 47
We extend the hypothesis about proportionate versus majoritarian systems by interacting proportional and (1 − proportional) with Herfindahl indices of party concentration in the government (herfgov) and opposition (herfopp). We define the difference govcohesion = herfgov − herfopp to measure party cohesion in the government relative to the opposition. The greater is herfdiff, the more cohesive is the government coalition; the smaller is herfdiff, the more fractured the government and/or the more united the opposition. We use the two interactions, prop + govcohesion = proportional × herfdiff and plur + govcohesion = (1 − proportional) × herfdiff, to test the idea that plurality plus party cohesion in government (relative to the opposition) leads to greater success in legislative voting than proportionality plus party cohesion within the government.
H1.2:
A majoritarian system with cohesion among parties in power favors special interests more (that is, have lower a's) than does a proportional system with the same party cohesion.
At the heart of electoral competition models with lobbying is the fraction α of uninformed voters. We capture two different dimensions of what it means for voters to be “uninformed.” In the GH96 model (and the Baron model upon which it is based) uninformed voters are impressionable voters who do not know the policy positions of candidates. We capture the idea of uninformed voters as impressionable voters using two variables. The first variable is the proportion of the population that is illiterate (illiteracy), which directly measures that part of the population whose opinions are more vulnerable to campaign spending. There is some evidence that lower literacy is associated with being uninformed politically, even in developed countries. A primary survey by Blais and colleaguesFootnote 48 of Canadian voters indicated that high school dropouts indicated not knowing about a large proportion of high-profile political candidates, relative to those who had completed university. In developing countries this problem is worse. Bardhan and MookherjeeFootnote 49 add that political capture by lobbies in developing countries is (1) decreasing in the average level of political awareness, and (2) increasing in the awareness disparity across economic classes. These, in turn are correlated with illiteracy and poverty.
The second variable is the proportion of the population that is urbanized (urbanization). It captures two ideas. One is the well documented evidence in developed and developing countries that rural voters are likely to be less informed than urban voters. In Majumdar, Mani, and MukandFootnote 50 information discrepancy between rural and urban populations is the reason why urban areas get more than a disproportionate share of public goods. Rural residents are poorly positioned to ascertain the relative importance of government neglect versus exogenous shocks in bringing about a low output in rural areas.Footnote 51 Active media and better education make the urban population less easy to fool. A government will therefore expend resources in generating more favorable urban outcomes, despite the fact that they are outnumbered by their rural populations. Majumdar and colleagues present striking facts about the information divide (measured by newspaper readership, and per capita radio and television ownership) between the rural versus urban populations in Nepal, Pakistan, India, and Philippines. They especially starkly document the difference in literacy rates in the poorer Asian and Latin American countries.Footnote 52 Thus, while the variable illiteracy captures the cross-sectional variation in literacy across our sample, the variable urbanization captures the intracountry differences in informed versus uninformed voters.Footnote 53
The second is that information externalities make densely populated urban areas naturally positioned to obtain information.Footnote 54 Scale economies afforded by urban agglomeration support an explosion of radio stations, TV channels, and newspapers, while the smaller and more scattered rural populations elude these scale economies. The news barrage that accompanies elections is more likely to sway the rural population unused to the blitz than the more habituated urban population.
The diversity of views about characteristics of the parties other than their trade policy positions (the parameter f in hypothesis (3)) is measured by a variable lrdivide that indicates the left-right divide between the largest party in government and the largest party in opposition.Footnote 55 It takes the value 1 if the former leans left or right and the latter leans the other way. If both lean the same way, or if either party is centrist, then the two sides are not considered to be ideologically polarized, and lrdivide takes the value 0. If extra-issue characteristics are strong in the minds of voters, then they will not turn away from their preferred parties even when those parties distort policies and impose welfare losses on them. The left-right divide engenders strong priors and ideal positions in the minds of voters, thus capturing this central idea behind hypothesis (3).Footnote 56
We measure the (inverse of) productivity of campaign spending parameter h in hypothesis (4) by advertising expenditures scaled by gross domestic product (GDP) in 1996, using data on media costs from WAT. Missing data were supplemented from Euromonitor.Footnote 57 Since it measures the number of advertising dollars spent in order to “generate” a country's GDP, or net sales, the advertising expenditure-to-GDP ratio measures the (average) inverse productivity of advertising expenditures. Since TV advertising comprises a large fraction of advertising expenditures, accounting for between 30 percent and 60 percent for most countries in the sample, we employ the variable tvadvertising_gdp = TV advertising spending scaled by GDP.Footnote 58 Results using the more encompassing variable totaladvertising_gdp = total advertising spending on all media (including newspapers, magazines, radio, and TV) scaled by GDP are similar to those we report. The (inverse) productivity of campaign spending h is thus measured by this inverse-productivity of advertising.
The variable checks in the DPI is used to measure executive checks and balances on the powers of legislators (hypothesis (5)). checks takes integer values between 1 (Indonesia and Mauritius in our sample) and 15 (India).Footnote 59 The theory presumes that the executive is presumed to represent the interests of the median voter, and is therefore a restraining influence on the agenda setter. The variable checks answers the question of whether this is true in the data. Since checks grades according to the propensity of the system to duel the legislature on issues, it is a more sophisticated measure than required by the theory. We therefore experiment with a binary reduction of checks (Binarychecks) that simply measures the existence of checks, as required by the theory.Footnote 60
The dilution of the executive's ability to champion a stringent platform of support for the median voter when they themselves require monetary help from special interests to win elections (hypothesis (6)) requires measurement of executive electoral competition. The DPI variable eiec (executive index of electoral competition) is well suited for this purpose. eiec varies between 1 and 7, where 1 indicates no executive and 7 indicates the most severe competition in executive elections. In our sample eiec = 2 for two countries (Indonesia and Mauritius) specifying unelected executive, eiec = 6 for three countries (Egypt, Romania, and Singapore) specifying that candidates from more than one party contested and the largest party received more than 75 percent of the votes, and eiec = 7 for all others specifying that candidates from more than one party contested and the largest party received less than 75 percent of the votes. We also experiment with a binary version of eiec (beiec) where beiec = 0 if eiec < 7, and beiec = 1 if eiec = 7.
The final hypothesis, about divided government (hypothesis (7)), measures a specific source of checks on the powers of the legislature. We measure divided government with two variables. The first, allhouse from the DPI, indicates whether the party of the executive has absolute majority in the houses that have lawmaking powers. If so, allhouse takes the value 1, otherwise government is divided and the variable takes the value 0. The second variable, esimilarity, measures whether the executive and the largest party in government are ideologically similar. It takes the value 1 if, when the executive is leftist or rightist or centrist, the largest government party also leans similarly. Otherwise, government is divided and esimilarity takes the value 0. Perhaps surprisingly, the two variables are uncorrelated in our sample. We note that the variable checks, used to measure control of the legislature by the executive, also subsumes the case of divided government. In fact, the empirical correlation between allhouse and checks is approximately −0.50. To some extent, therefore checks, allhouse, and esimlarity are all legitimate measures of divided government.
Results
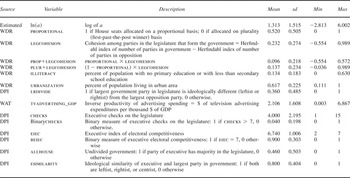
Table 3 presents descriptive statistics for variables just described from the sample of fifty democracies. The dependent variable we will use is the log of the estimated a's. Its outstanding characteristic is that it satisfies normality and is therefore outlier-free. This is a useful property, since small clusters of observations can no longer overly influence the outcome of the regression.
Variable Description and Descriptive Statistics

Notes: All statistics for fifty countries. Only countries with elected legislatures up to 1996 in the sample. China, Ethiopia, Hong Kong, and Taiwan are dropped. DPI = Database on Political Institutions (Beck et al. Reference Beck, Clarke, Groff, Keefer and Walsh2001), WDR = various issues of the World Development Report, and WAT = World Advertising Trends (1998). See section on data for detailed definitions and original sources.
About half the sample uses a primarily proportionate system of representation in the legislature, and half primarily use plurality. The sample mean for illiteracy is 13.4 percent and for urbanization is 61.7 percent. Both variables have considerable variation across the sample. 36 percent of the countries in the sample have ideologically widely divided legislatures (lrdivide). The average spending on TV advertising per dollar of GDP varies from .003 cents (very productive) to 6.867 cents (unproductive), with an average of 2.1 cents. In only two countries are there stringent checks on the legislature by the executive (Binarychecks = 1). In 90 percent of the sample, the executive faces electoral competition (beiec = 1). In 46 percent of the sample, government is politically undivided (allhouse), while in 80 percent of the sample, government is ideologically undivided (esimilarity = 1).
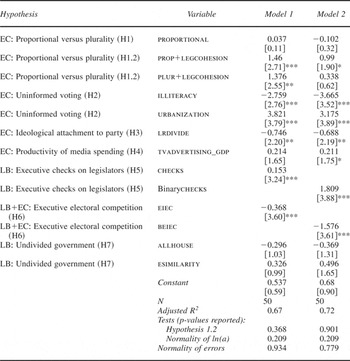
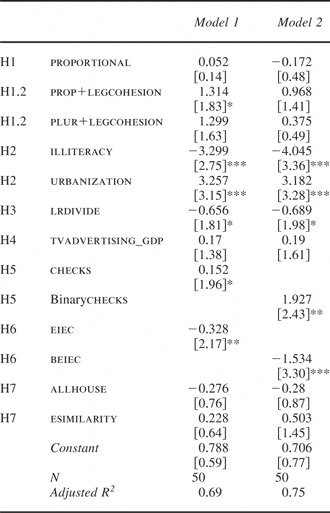
The central empirical results are presented in Table 4.Footnote 61 A concern with using the estimated a's as the dependent variable is that it has extreme values, implying the existence of outliers. For example, a is estimated at 404.0 for Singapore but the next highest is only 37.8 (Japan). Indeed, the Shapiro-Wilk testFootnote 62 strongly rejects the hypothesis that the a's came from a normally distributed population. ln(a), however, passes the normality test. The error terms from the fitted models in Table 4 do as well (see tests at the bottom of the table). The adjusted R 2 statistics attest to the adequate fit on the models. Model 1 uses the continuous variable checks and eiec to capture the impact of executive checks and executive electoral competition, while Model 2 uses their binary versions (Binarychecks and beiec).
Hypothesis tests about determinants of a OLS estimates: dependent variable ln(a)

Notes: Absolute t-statistics (using White-corrected standard errors) in parentheses.
* denotes statistical significance at 10%, ** at 5% and *** at 1% “EC” = electoral competition theory, “LB” = legislative bargaining theory. Normality tests report p-values for the Shapiro–Wilk test.
Contrary to the literature on proportional versus pluralitarian systems as sources of diverse policy outcomes, we find that this choice has no influence on governments' welfare-mindedness. This finding is in fact consistent with the GH96 assumption of two parties and the country voting as a single constituency, which implies that the two systems are equivalent. The rejection of hypothesis (1) may also be due to the existence of many parties in the system—the three-party example that motivated the hypothesis may simply exaggerate the probability of protectionist bias in majoritarian versus proportional systems. The interaction of proportionality with legislative cohesion has a positive and statistically significant coefficient, indicating that proportionality plus a legislature in which there are fewer parties in the governing coalition than in the opposition, leads to a greater concern for welfare. But so is the coefficient on the interaction of plurality with legislative cohesion in Model 1. Further, their sizes are statistically the same, indicating that legislative cohesion, not proportionality or plurality, is the driving force behind the result. Thus, Model 1 rejects hypothesis (1.2) as well. While Model 2 finds support for this hypothesis, it is weak. We conclude that a is determined not by whether a system is proportional or pluralitarian, but by party concentration in the governing coalition versus the opposition in government.
Since illiteracy and urbanization measure voter informedness, they serve to test the central presumption of electoral competition theory that attracting the votes of uninformed voters make policy platforms responsive to special interest money. The centrality of uninformed voting has strong empirical backing. The coefficients on both measures are statistically significant in the expected directions. Even more important, they are politically and economically significant. The coefficients imply that an increase in illiteracy of 0.10 decreases a by 27.59 percent, and an increase in urbanization of 0.10 increases a by 38.21 percent. Hypothesis (2)—a's relationship with the proportion of voters that are uninformed—is thus strongly validated. These results suggest that the source of the divide between poor and rich countries noted in Table 2 is that less developed countries have largely rural as well as less literate populations than developed countries. For those reasons, less developed countries have lower a's.
Hypothesis (3) is also strongly affirmed. The greater the ideological divide between parties contesting for the legislature, the lower is a. All else constant, a country with contesting parties that are ideologically close (lrdivide = 0) has an a that is 74.6 percent higher than in a country with parties that are ideologically far apart (lrdivide = 1).Footnote 63 Thus, the larger their unshakeable voter base, the more their platforms cater to special interests, since the parties do not fear losing voters over trade policy contests.
The estimates affirm hypothesis (4) about the productivity of expenditures to sway voters. We find that the more cost-effective is each TV advertising dollar, the less welfare-oriented is government. That is, if an advertising dollar is able to convert many uninformed voters, then economic logic dictates more advertising dollars are spent. Since lobbies are the source of the supply of advertising dollars, policy platforms are pushed in their direction. The quantitative impact is notable. The results show that a decrease in tvadvertising_gdp by 1 (that is, a decrease in TV advertising revenue of $1 per thousand dollars of GDP) raises a by 21.4 percent. This finding has implications for the difference in the welfare-mindedness of developed versus developing countries. Since developing countries have much lower ratios of tvadvertising_gdp than developed countries, more productive media dollars (combined with greater proportion of voters that are uninformed) are another reason why their governments are less welfare minded.Footnote 64
Turning to the legislative bargaining hypotheses, both measures of checks and balances (checks in Model 1 and Binarychecks in Model 2) are positive and statistically significant. An increase in checks of one standard deviation (around 2) is associated with a 30.6 percent increase in a, all else constant. In most countries checks falls in the 1–7 range, with India as the sole extreme data point with a score of 15. The India observation may therefore be influential in determining the regression coefficient on checks. Recoding the India value to, for example, 8 or 9, does not alter the statistical or political significance of checks (the coefficient is larger though less precise).
When Binarychecks equals 1, it indicates a fractured government and a powerful executive (the ability of the executive to check the powers of the legislature are magnified).Footnote 65 This definition of the Binarychecks variable gives the best chance for the theory to perform, rather than one where the executive is defined to be only marginally powerful. The theory holds up well. The estimates imply that, all else equal, countries with effective checks by the executive (Binarychecks = 1) have a welfare-for-lobbying tradeoff that is 180.9 percent more expensive than countries without checks. This affirmation of the idea that the executive can effectively wield checks on the ability of the legislature to sell out is all the more remarkable considering that Binarychecks = 1 for only two countries—India and Pakistan.
If the executive must face electoral competition, then the same forces that came into play in shaping the platforms of legislators also come into play here. Since special interests now wield influence over the platforms of candidates for the executive, electoral competition reduces the welfare-mindedness of the executive. The results strongly affirm this mechanism. Both, the executive index of electoral competition eiec and its binary version beiec are statistically and politically significant. beiec indicates that, all else equal, a country in which the executive does not face competition at the polls has an a that is 157.6 percent more than a country whose executive does. The finer measure eiec indicates that an increase in the index of 1 unit (approximately one standard deviation) lowers a by 36.8 percent. As argued theoretically, greater electoral competition for the executive diminishes the positive impact of executive checks on a. Since the office of the executive is, more often than not, a competitive selection, this extension to the legislative bargaining literature brings it closer to the real world.
Undivided government does not appear to have any impact on a after controlling for the other variables. To be fair to the theoretical literature on divided governments, the electoral competition variables checks and Binarychecks are also good measures of the incidence and extent of divided government. The high correlation between allhouse and checks of −0.50 also empirically affirms that checks picks up the effect of divided government. The aforementioned findings about these two variables imply that divided government causes lowers a's, in keeping with our theory (and other mechanisms in the literature that show that divided governments can cause good policy outcomes). If checks and Binarychecks really are measures of divided government rather than measures of the ability of the executive to impose checks, in order to test the basic precept of the legislative bargaining theory (hypothesis (5)), we would need a sample in which some countries have no (elected or unelected) executive, only a legislature. Unfortunately, our sample has no such cases and does not allow that experiment.
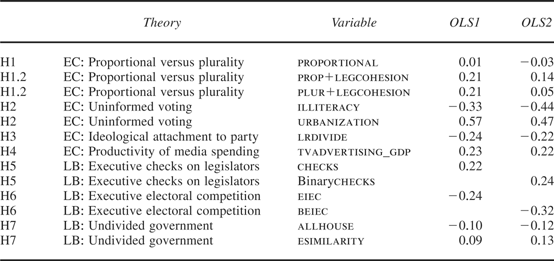
A number of hypotheses about institutions and the a parameter were tested using the estimates in Table 4. Which of those influences is strongest? Table 5 reports unit-free beta coefficients that may be used to compare the influence of the variables. These coefficients simply indicate the number of standard deviations that the dependent variable changes if an independent variable is increased by one standard deviation. As such, this measure favors the size of the coefficient over its statistical precision. urbanization has the largest influence on a, making the uninformed voter hypothesis stand out among the hypotheses as an important force behind a. illiteracy is influential as well, lending more credence to the uninformed voter model. Other variables that are influential are the same variables that stood out as being statistically significant in Table 4. The statistically insignificant coefficients are imprecise, but also small.
Beta coefficients
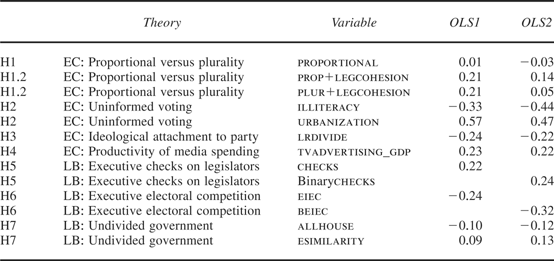
Notes: Beta coefficients are regression coefficients of the standardized dependent variable on standardized explanatory variables.
Sensitivity Analysis
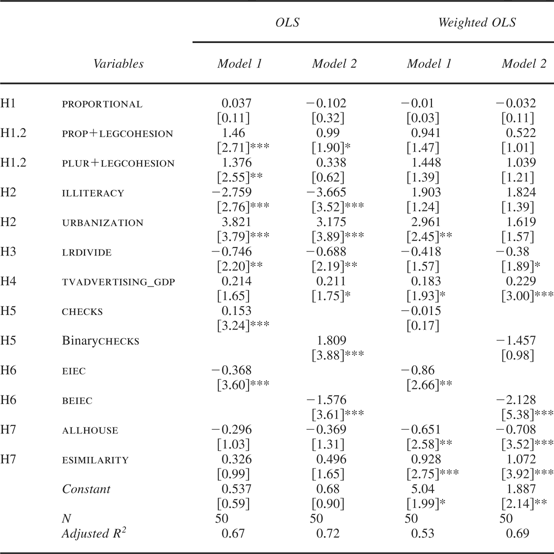
We report the results from a set of stress tests we have conducted in order to investigate the robustness (or fragility) of the inferences made thus far. Although the dependent variable ln(a) passed the test of normality (implying the absence of outliers) we re-estimated the models using a robust estimator based on minimizing a weighted sum of squared errors, where large outliers are given smaller weights according to Tukey's criterion. Not surprisingly, the results are qualitatively and quantitatively similar. These are reported in Table 6.
Robust (to Outliers) regressions Dependent variable: ln(a)

Note: Absolute t-statistics in parentheses: * denotes statistical significance at 10%; ** at 5%; and *** at 1%
Weighted regressions, with weights inversely related to residuals.
Since the a parameters were estimated, we performed a weighted regression with weights inversely proportional to the squares of the standard errors. That is, we estimated a simple heteroskedastic regression using information about the estimated variance of ln(a).Footnote 66 These results are reported in the last two columns of Table 7. There are some notable differences. The coefficient on illiteracy is no longer as precisely estimated, and has the opposite sign. Neither checks nor Binary checks are statistically significantly different from zero. However, allhouse is now statistically and politically significant, preserving our inference about divided government which was based on checks and Binarychecks. Finally, esimilarity is positive and statistically significant. These result deserve explaining.
Weighted regressions with dependent variable: ln(a)
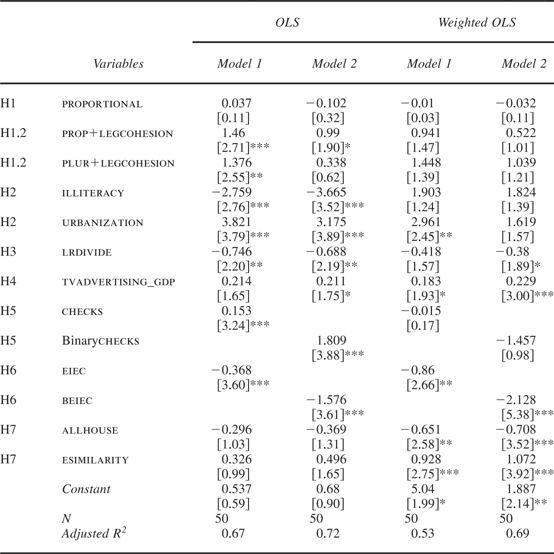
Notes: Absolute t-statistics in parentheses: * denotes statistical significance at 10%; ** at 5%; and *** at 1%. First two columns are ordinary least squares (OLS) estimates from Table 4. Weighted OLS estimates use the inverse of the variance of ln(a) as weights.
The a's are more tightly estimated for developed countries (in part because their sample sizes are larger), and therefore the heteroskedastic regressions put greater weights on developed countries. Since their populations have high literacy rates, illiteracy has low variance in the subsample of developed countries, and loses its statistical significance. The coefficients on checks and Binarychecks are not significant for the same reason. However, allhouse has considerable variance in the subsample, which enables a more precise estimation of its influence. The estimate implies that, all else equal, if the party of the executive also controls the House (allhouse = 1) then a is 65.1 percent lower than if government were politically undivided (Model 1). Contrary to what we imagined, ideological similarity between the executive and the leading political party in government has the converse effect, at least in developed countries. If the executive and largest party in the legislature are ideologically similar (esimilarity = 1) then a is 92.8 percent higher than otherwise. It appears that politically divided government has very different implications for the behavior of governments than ideological divisions.Footnote 67 Political division produces outcomes that are welfare-oriented while ideological division is adversarial. We note that the two variables are uncorrelated in the data.
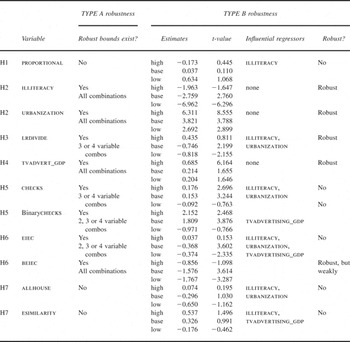
In a widely cited paper, Levine and ReneltFootnote 68 critiqued the empirical literature on economic growth for producing what turn out to be quite fragile inferences. A root cause of the fragility in cross-country regressions are (conditional) correlations among the regressor variables. As a result, a particular combination of regressors may yield a striking and significant coefficient on a variable, but other combinations may fail to come up with any result of note. The Levine-Renelt sensitivity analysis consists of choosing a focus variable and a group of regressors that are relevant to the regression, and estimating as many regressions as there are subsets of those regressors (with k regressors there are 2k possible subsets). The highest and lowest coefficient estimates on the issue variable from these regressions is then reported. If the maximum and minimum have the same sign (and are statistically significant), then inference about the variable is robust to the choice of regressors. We perform a similar exercise but use a softer stick to judge the results. The results are reported in Table 8.
Sensitivity analysis: extreme bounds

Note: The base estimates are from the first column of OLS estimates (beiec and Binarychecks from the second) of Table 4. The “high” and “low” values are estimated as the max and min of the set of estimates using all possible combinations of 1, 2, 3, and 4 regressors (= 212 runs). TYPE A Robustness indicates intervals (with 1, 2, 3, or 4 regressors, respectively) not containing zero, with both bounds statistically significant at 10%. TYPE B Robustness indicates the presence or absence of robust intervals across the (212) sets of estimates for any issue variable.
Consider the issue variable proportional, and the eight other regressors illiteracy, urbanization, lrdivide, tvadvertising_gdp, checks, eiec, allhouse, and esimilarity. From these eight we choose the 212 combinations comprising one regressor variable (8 combinations), two regressor variables (28), three regressor variables (56), and four regressor variables (70).Footnote 69 We conduct two types of robustness checks. The first, TYPE A Robustness, is a soft test asking whether any among the one-, two-, three-, or four-variable combinations produces maximum and minimum estimates on proportional so that both have the same sign and both are statistically significant at 10 percent. We conclude that proportional does not produce any robust inferences at all. This may not come as a surprise considering the low level of precision with which it was estimated in the first place. But do the coefficients that were estimated with statistical significance hold up to the Type A robustness check? illiteracy, urbanization, tvadvertising_gdp, and beiec do. To some extent, so do lrdivide, checks, Binarychecks, and eiec. For example, lrdivide produces robust inferences with any three or four of the eight regressors.
Type B Robustness indicates whether the interval for each issue variable constructed from the full set of 212 regressor combinations contains zero (and is therefore not robust). Since the bounds for illiteracy are both negative and statistically significant, we conclude that the inference about the fraction of uninformed voters is strongly robust to choice of regressors. Thus, illiteracy, urbanization, tvadvertising_gdp, and beiec provide robust Type B inferences. lrdivide, checks, Binarychecks, and eiec provide inferences in which one of the bounds has an absolute t value less than 1.6, and is therefore poorly measured. The inferences we have made from those coefficients are not as robust to the choice of regressors. The adjacent column indicates variables whose inclusion undermines the inferences from an issue variable. It appears that inclusion of the variables illiteracy, urbanization, and tvadvertising_gdp weaken the ability of many other variables to provide clear independent inferences. These variables obviously capture a number of influences inherent in the issue variables, so that the partial correlation of the issue variables with the dependent variable ln(a) is lowered once they are included. A lesson from this exercise is that it is possible to generate a set of results from a specific regression, but if empirical results are to move theory forward, they must demonstrate robustness. Thus, our earlier inferences about hypotheses H2 (uninformed voting), H4 (productivity of media), and H6 (executive electoral competition) are robust, while those about H3 (ideological attachment) and H5 (executive checks) are fragile. The way forward empirically is to construct better measures of ideological attachment and executive checks. Another is to increase the sample to test these theories, which requires trade, protection, and output data for more countries.
In a final set of robustness checks, we allow for other determinants of tariffs to affect our estimates of a. In the second section we fully embrace the GH94 setup where governments maximize a weighted sum of special interest money and public welfare. But Rawlsian logic would predict that governments also care about maintaining a fair living standard for all, especially lower income workers. We attempt to introduce these types of considerations by estimating equation (10) using three different types of additional control variables. In the first specification we introduced average worker wage (in industry i at time t). In a second specification we introduced average worker wage plus average worker productivity (measured as output per worker), and in a third model we added average worker wage scaled by the country's per capita income. Estimates of the a's from these three models are available upon request. For most countries the additional regressors push the estimates of a downward, sometimes strikingly. The U.S. estimate, for example, declines from above 26 to less than 7, and similar declines are seen in a number of developed countries. The addition of the Rawlsian regressors suggests that if the portion of tariffs used to protect worker incomes is separated from the portion of tariffs that responds to special interest contributions, then countries are shown to be much more responsive to special interests. This is not always the case, and the a's for Nepal, Bangladesh, Malawi, Cameroon, Costa Rica, and India actually increase as a result of the additional variables.
Do our inferences on the determinants of a change? The uninformed voters hypothesis, the ideological attachment hypothesis, and the productivity of media spending hypothesis continue to be affirmed with all three sets of new a's. However, checks and Binarychecks may no longer be used to support the hypothesis about executive electoral competition (or about divided government), and eiec and beiec no longer support the hypothesis of executive electoral competition. The legislative bargaining model faces empirical rejection if these are the correct a's. We should, however, be reminded that adding ad hoc regressors to equation (10) to estimate the new a's is atheoretical. One could imagine a model where a is determined by the interaction of Rawlsian motives with legislative bargaining, which would explain why the legislative bargaining variables are no longer statistically significant once we control for Rawlsian motives when estimating a's. The idea of structural estimation espoused in this paper emphasizes theory-based estimation, whereas the results from the estimations here should be considered ad hoc. The new estimates of a are nevertheless interesting, and suggest that work on the theoretical foundations that may admit explanatory variables like wage and productivity in equation (10) should prove worthwhile.
Finally, there are noteworthy differences in inferences about government's welfare-mindedness that may be made (indirectly) using tariff data as the dependent variable, and (directly) using estimates of a as we have done. Using the import-weighted tariffs as the dependent variable in place of ln(a) yield estimates that weakly support the uninformed voters hypothesis and the model of executive checks and balances (or divided government to the extent that checks measures it), but no others. Given these differences, we strongly prefer to use our method. It is the more direct and theoretically relevant method for assessing the fundamental question of why governments behave as they do.
Conclusion
This article has studied quantitatively the welfare-mindedness of governments through the lens of trade policy determination. Our analysis suggests a substantial variation in government behavior in a cross-section of developed and developing countries. The variation broadly matches our a priori beliefs of the weight governments put on social welfare relative to industry lobbying when taking policy decisions. They are also consistent with the perception index of corruption of Transparency International.
More importantly, the determinants of this variation were theoretically motivated, using models consistent with the one used to estimate welfare-mindedness of governments. These theories suggest specific political, economic, and institutional variables as fundamental determinants of the variation in the behaviors of governments. Using a new database on political institutions we empirically test whether these variables influence the welfare-mindedness of governments as the theories predict. The results suggest that they do. The most notable findings are the following. Political institutions that have a larger number of checks and balances embedded in the decision-making process cause more welfare-minded governments. The more informed are voters, as measured by literacy and the degree of urbanization, the greater is the weight that governments put on the welfare of their polity when making trade policy decisions. Finally, the more ideologically attached are voters to parties and the greater the productivity of the media in influencing uninformed voters, the less weight governments put on social welfare when making trade policy.
These results are, to the best of our knowledge, the first ones that are derived from an underlying theory. We have hinted at others that are potentially testable. Such research can prove important for understanding and advocating policy. We caution against using the findings of this study to push a set of straitjacketed policies in the style of the Washington consensus (WC). As countries grow richer, their polities will be empowered to change their institutions. It is best to direct development aid not at institutional change in a country, but at activities that create growth opportunities conditional on the institutional lacunae the country faces. Experience with the WC policies have failed to show any evidence of institutional change, while activity-based aid has been effective in permanently raising incomes. Thus, our results that checks and balances are important determinants of welfare-mindedness parameter a, should not be taken to suggest that aid by rich countries be used to push governments to change their judicial system. Likewise, our result that urbanization is an important determinant of a does not suggest that aid should push for urbanization. Those changes need to be the outcome of complex endogenous processes, that governments and international agencies with limited information and resources simply cannot make happen. Institutional change is best left to endogenous processes, as the failure of WC-style policies demonstrates.Footnote 70
Finally, if an increase in welfare-mindedness is the motive for trade liberalization, then the results in this article suggest that it is in fundamental institutional change that the source of recent liberalization episodes across the world may be found. The observable fundamentals (our regressors) serve to indicate which countries might be prepared to liberalize. Countries that have succeeded in altering one or more of these fundamentals may be ready to take the step toward liberalization. Perhaps, with the appropriate incentives and design that minimize political and economic risks, their governments could be convinced to undertake liberalization programs that are politically sustainable.