INTRODUCTION
Agricultural watersheds provide a variety of goods and services that are beneficial to humankind in providing food, water, fuel and other bio-products, regulating and filtering streamflow, sequestering carbon dioxide and supporting biodiversity. Human activities are putting tremendous pressure on ecosystems leading to over-exploitation of natural resources, land use change, air and water pollution, loss of biodiversity and climate change. Population growth and other socio-economic changes trigger the conversion of natural land cover types such as forests to cropland, grazing lands and built-up areas with consequences on the partitioning of rainfall into infiltration, overland flow and evapotranspiration, and ultimately soil moisture recharge, groundwater recharge and dry weather streamflow (Calder, Reference Calder1999; Southgate et al., Reference Southgate, Sanders and Ehui1990).
Soil erosion is the most widespread form of soil degradation. Soil erosion by water affects 1094 million ha globally (Lal, Reference Lal2003). In Kenya, economic losses caused by soil erosion are equal in magnitude to national electricity production or agricultural exports standing at about 3.8% of gross domestic product (Cohen et al., Reference Cohen, Brown and Shepherd2006). Soil loss from agricultural land through water erosion leads to loss of nutrients and productive capacity, deterioration of soil structure, reduction in crop yields, water pollution and sedimentation of water bodies.
Climate change is associated with shifts in mean climate conditions and more severe extreme weather conditions (Easterling et al., Reference Easterling, Meehl, Parmesan, Changnon, Karl and Mearns2000). This will lead to higher and more frequent flood events, increased soil erosion and prolonged periods of low flows. Climate change projections for the East African region indicate an increase in mean annual rainfall and temperature in the range 0 to 20% and 2.5 to 3.0 °C for the period from 1980–1999 to 2080–2099 (Christensen et al., Reference Christensen, Hewitson, Busuioc, Chen, Gao, Held, Jones, Kolli, Kwon, Laprise, Magaña Rueda, Mearns, Menéndez, Räisänen, Rinke, Sarr, Whetton, Solomon, Qin, Manning, Chen, Marquis, Averyt, Tignor and Miller2007). There are a wide range of options suitable for adapting agricultural systems to climate change. They cut across policy, technical, financial and managerial options taking place at local, national and international levels, and implemented by a variety of participants such as farmers, and the public and private sectors. Some examples are agricultural water management, diversification of crop and livestock enterprises, incentives for improved land management and plant breeding (Cooper et al., Reference Cooper, Dimes, Rao, Shapiro, Shiferaw and Twomlow2008, Tubiello et al., Reference Tubiello, Schmidhuber, Howden, Neofotis, Park, Fernandes and Thapa2008).
In a healthy watershed, the inter-dependence of communities upstream and downstream is such that none is significantly disadvantaged by the activities of the other. The communities living upstream derive their livelihood from the land. However, their productive or extractive activities do not substantially compromise the functions of the watershed. The downstream communities are provided with adequate amounts of good quality water and are not exposed to prolonged low flows, persistent floods and sediment deposition on agricultural land or on infrastructure.
The factors that determine water and sediment yield from a catchment are rainfall characteristics, soil properties, slope length and slope angle, land use and land management practices (Wischmeier and Smith, Reference Wischmeier and Smith1978). Land use practices that lead to increased infiltration such as terracing, contour farming and organic matter build up may offset the adverse effects caused by increased rainfall amounts and season-to-season rainfall variability. Identifying and promoting such land use practices has two advantages. The land owners upstream conserve their soil resource base and the productivity of their land is maintained. The downstream communities suffer less from the consequences of higher risk. In a hydrological system that maintains or indeed enhances its productivity and yet is effectively buffered against the risk of weather extremes, both upstream and downstream parties are better placed to cope with future climate change.
Land use change and climate change are therefore two main determinants of the sustained capacity of a watershed to provide ecosystem services. If actions are to be taken to reduce the threat of these multiple changes, and enhance watershed functions, it is necessary to understand the nature of the current situation and possible future scenarios more precisely. The work reported here aimed to explore and illustrate the extent to which existing tools may be used to generate an understanding of climate and land use interactions in watershed functioning. In particular, we aimed to find ways in which: (1) general results and relationships may be spatially disaggregated to allow targeting of interventions and (2) consideration of risk and variability gives additional insights into possible impacts of changes and interventions. The approach is based on a case study of Nyando watershed in Western Kenya and application of SWAT (Neitsch et al., Reference Neitsch, Arnold, Kiniry, Srinivasan and Williams2002a) for modelling the effect of climate and land use change.
MATERIALS AND METHODS
The study area
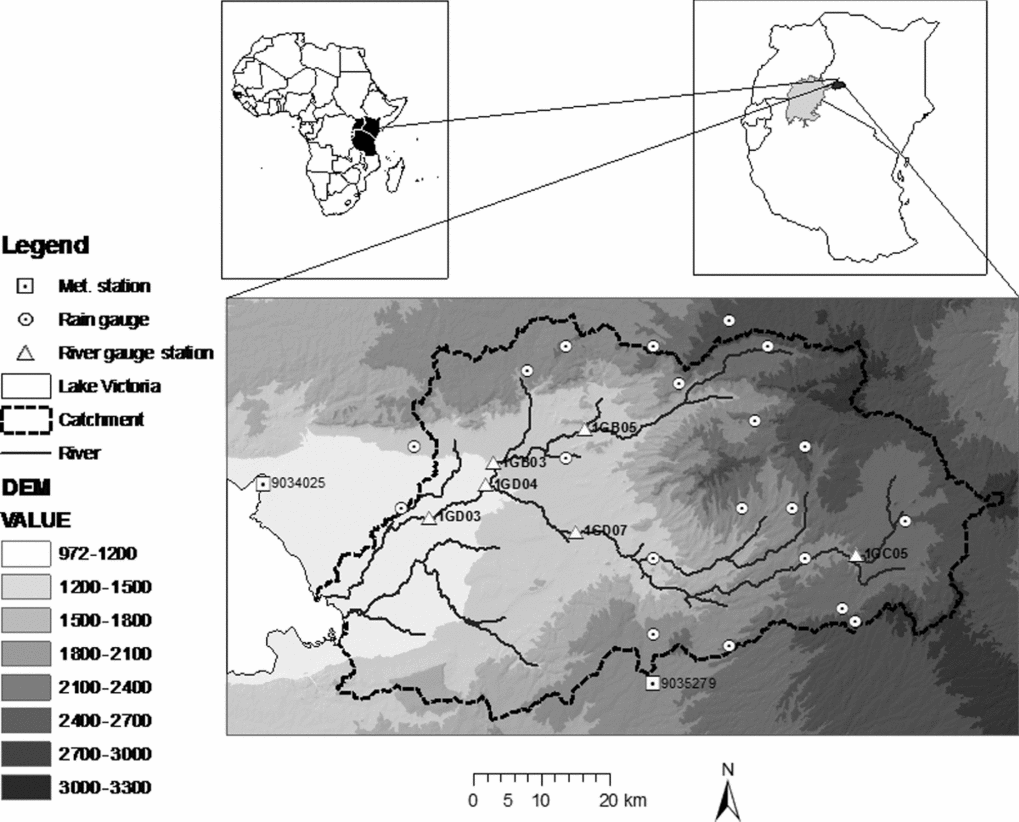
This study was carried out in Nyando river basin in Western Kenya, which is part of the Lake Victoria basin. It is bounded by latitudes 0°7′48″N and 0°24′36″S and longitude 34°24′36″E and 35°43′12″E. It covers an area of about 3587 km2. The basin ranges in altitude from 1140 m asl at the lake side to almost 3000 m asl towards the highlands (Figure 1). The mean annual rainfall ranges from 800 mm in the Lake Victoria region to 1600 mm in the highlands. Climate varies with altitude with rainfall being higher and temperature and evapotranspiration being lower in the highlands than the lowlands. The Kano Plains lying below 1150 m asl experience persistent flooding each year during the rainy season (Ochola and Kerkides, Reference Ochola and Kerkides2003). The total population in Nyando basin is estimated at 1.1 million and the population density is among the highest in Kenya and stands at approximately 300 persons km−2. With an annual growth rate of 2.3%, the population will be over 8 million by 2080 (Republic of Kenya, 2010).
Digital elevation model (m asl) and hydrometeorological stations in Nyando basin, Western Kenya.

SWAT hydrological model
SWAT is a watershed scale model developed to predict the impact of land management practices on water, sediment and agricultural chemical yields in large complex watersheds with varying soils, land use and management conditions over long periods of time. SWAT can be used to study long-term impacts of climate change and land use change on streamflow and sediment yield. The model can be used to simulate a single watershed or a system of multiple hydrologically connected watersheds. Each watershed is first subdivided into sub-basins and then into hydrological response units (HRUs) based on land use and soil distributions. The hydrological and climatic input data needed by SWAT includes rainfall and evaporation and for calibration, streamflow. SWAT also requires specific information on soil properties, topography, vegetation and land management practices.
Climate change is modelled by adjusting the climatic input data. The adjustment can be varied from month to month so that the user is able to simulate seasonal changes in climatic parameters (Neitsch et al., Reference Neitsch, Arnold, Kiniry, Williams and King2002b). Daily rainfall can be varied by x % and mean daily temperature can be increased by y °C. Other more complex climate changes like those affecting rainfall distribution or number of rain days in a season can only be implemented outside SWAT by manipulation of the climate data before it is introduced into the model. Rainfall intensity is an important determinant of runoff. When running the SWAT model on daily rainfall data, the only rainfall intensity information needed is the maximum 30-minute intensity which forms the basis for computation of peak runoff rate.
The theoretical basis of the SWAT model is described fully in Neitsch et al. (Reference Neitsch, Arnold, Kiniry, Williams and King2002b). Simulation of watershed hydrology is separated into the land phase and the channel routing phase. The land phase hydrological cycle controls the movement of water, sediment, nutrient, chemicals and pesticides to the main channel in each sub-basin. The routing phase controls the movement of water, sediment, nutrients and pesticides through the channel network to the outlet of the sub-basin. The hydrological processes modelled in SWAT include surface runoff, infiltration, percolation, potential evapotranspiration and groundwater flow to stream.
Surface runoff volume is estimated using the soil conservation service curve number (SCS CN) procedure (USDA-SCS, 1993) or the Green and Ampt infiltration method (Green and Ampt, Reference Green and Ampt1911). The SCS CN is a function of soil infiltration rate, land use and antecedent moisture conditions. The prediction of peak runoff is made using a modification of the rational method (Maidment, Reference Maidment1993). Hargreaves, Priestly-Taylor or Penman-Monteith methods are available for estimation of potential evapotranspiration. Erosion and sediment yield are estimated for each HRU with the modified universal soil loss equation (Williams, Reference Williams1975).
The SWAT model had been calibrated successfully for Nyando basin (Sang et al. Reference Sang, Gathenya and Ndegwa2007, Swallow et al., Reference Swallow, Sang, Nyabenge, Bundotich, Duraiappah and Yatich2009). The performance of the model in the basin attained coefficient of determination (R 2) values between 0.45 and 0.72 (Sang et al. Reference Sang, Gathenya and Ndegwa2007). For this study, the parameters obtained from the earlier study were maintained for the base case.
Climate and streamflow data
The rainfall data input into the SWAT model was that of 22 rainfall stations with daily rainfall data from 1960 to 2005 obtained from the Kenya Meteorological Department (Figure 1). SWAT uses a simple method of spatial interpolation of rainfall over the sub-basins whereby the time series of the rainfall station that is nearest to the centroid of the sub-basin is assigned to that sub-basin. The Penman-Monteith equation in SWAT was used to calculate potential evapotranspiration and the required data (air temperature, air relative humidity, sunshine hours and wind speed) was obtained from Kericho (9035279) and Kisumu (9034025) meteorological stations (Figure 1). The stream flow data used for this study was obtained from the Ministry of Water and Irrigation. Daily streamflow data for the river gauging stations (Figure 1) was available for the period 1968 to 1997. For this study, the outlet of the catchment is considered to be at the lowest gauging station 1GD03. The model was run for 30 years from 1968 to 1997 but during data analysis, the results of the first three ‘warm up’ years were discarded.
Land use and land cover data
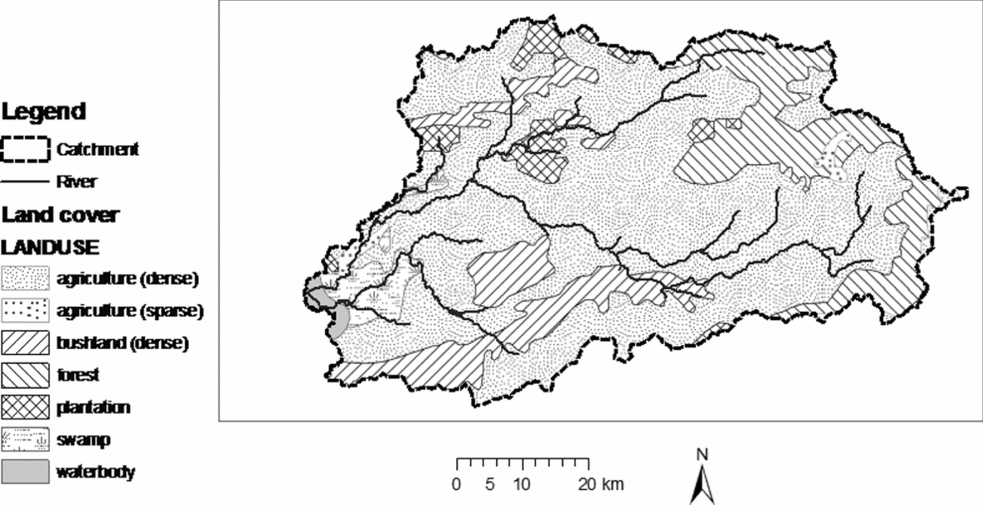
The land use map used for this study, shown in Figure 2, was prepared by the Japan International Co-operation Agency for the National Water Master Plan Study from Landsat images of 1980 (MoWD, 1992). We used this data because it falls within the same period as that of available hydrometeorological data. The ArcView shapefiles are available at http://www.ilri.org/gis. Seven land use classes have been identified. The dominant land use is agriculture which accounts for 67% of the area followed by forest with 14%. The main crops are tea, maize, beans, sugar cane and rice. Cattle, sheep and goats are kept for milk and meat. Overgrazing is a major problem contributing to soil erosion in Nyando basin (World Agroforestry Centre, 2006)
Land use map of Nyando basin, Western Kenya.

Soil data
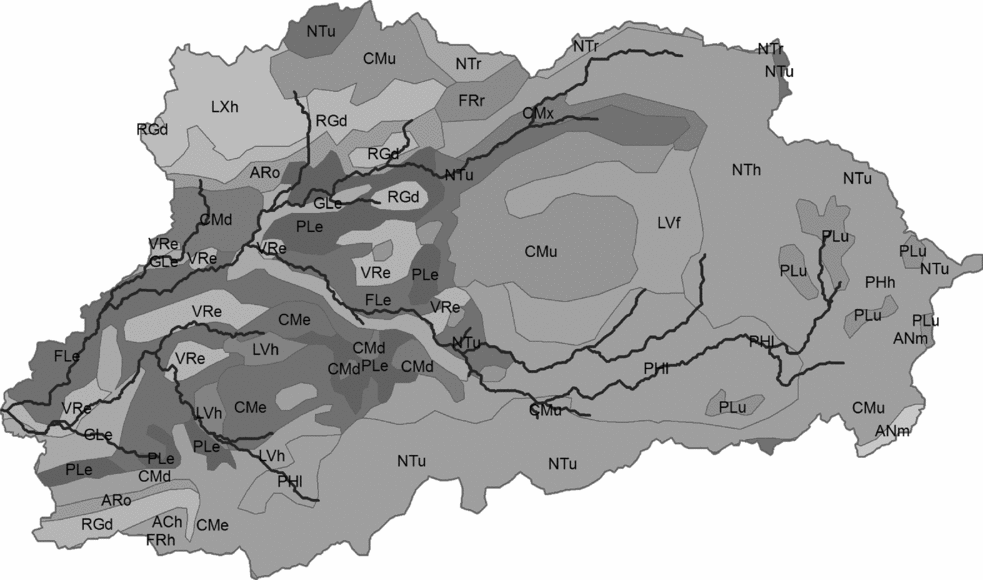
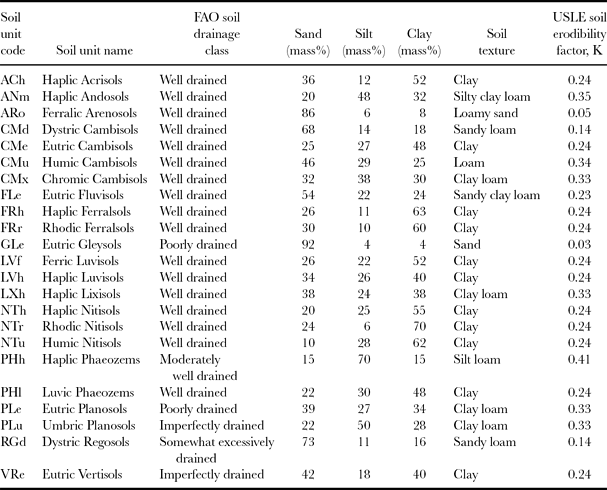
The digital soil map (Figure 3) used for this study was the soil and terrain based map of Kenya developed by International Soil Reference and Information Centre and available at http://www.isric.org (Batjes and Gicheru, Reference Batjes and Gicheru2004). This map has a scale of 1:1 000 000 and it contains GIS-shapefiles broken down to the individual soil units as well as a database of estimates of important soil parameters linked to the units. Estimates of soil properties are presented by soil unit for fixed depth intervals of 0.2 m to 1 m depth. The basin has different soils with varying soil properties. The soils in the highlands above 1500 m asl tend to be more uniform. They are fine-textured, well-drained soils. The soils in the lowlands are a complex mix of soils some of which are imperfectly or poorly drained; some are susceptible to erosion especially if poorly managed. The most widespread soils are Luvic Phaeozems (PHl) occurring in the upland areas above 1500 m and taking up about 40% of the catchment. They are deep, porous, clayey soils, which present a high erosion hazard. The soils in the lowlands below 1500 m are varied and they include Planosols, Vertisols, Cambisols, Fluvisols and Luvisols. Generally soils such as Planosols and Vertisols present problems of poor drainage while Luvisols and Cambisols have high erosion risk especially if cultivated on steep slopes (FAO, 2006).
Soil map of Nyando basin, Western Kenya. For meaning of the soil unit codes refer to Table 2.

Digital elevation model and watershed delineation
Other model input included the digital elevation model generated from contours on topographic maps (1:50 000 scale) and had a spatial resolution of 20 m. Based on this model, the watershed was subdivided into 50 sub-basins with an average area of 70 km2. The results in Figure 6 to 11 are displayed per sub-basin.
Climate and land cover scenarios
A total of 18 scenarios representing changes in land management and changes in climate and combinations thereof were generated. The SWAT model uses SCS CN to partition daily rainfall into surface runoff and losses, where the losses comprise infiltration, interception, evaporation/evapotranspiration and water storage on the land surface. The CN value for a specific agricultural land surface depends on type of cover, land surface treatment, hydrological condition, soil type (also referred to as hydrological soil group) and antecedent moisture condition. The CN is an empirically derived value and has no units: for cultivated agricultural lands, it ranges from 51 for areas with highest infiltration to 94 for areas with lowest infiltration (USDA-SCS, 1993). When analysing individual storms, the losses due to infiltration are most important whereas losses due to evaporation and evapotranspiration become important for seasonal or annual analysis (Ponce and Hawkins, Reference Ponce and Hawkins1996; Van Mullem, Reference Van Mullem1989; USDA-SCS, 1993).
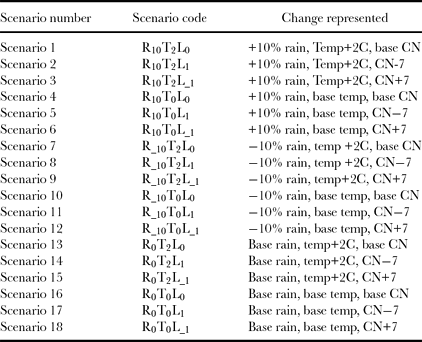
The 18 scenarios were a complete factorial set constructed from the three factors of rainfall (base, −10%, +10%), temperature (base, +2°C) and curve number (base CN, CN−7, CN+7). Rainfall and temperature changes under future climates were not available downscaled to daily values, hence we used a simple method of adjusting daily values from the observed record by a fixed percentage (rainfall) or number of degrees (temperature). Whilst the approach of changing temperature reflects the way results of global climate models are reported, the change in rainfall does not capture probable changes in rainfall distribution over space, rainfall intensity or number of rainy days. We were not able to find an alternative that would give realistic spatial and temporal correlations in rainfall and between rainfall and temperature. The changes in CN of +7 or −7 were judged to present the realistic achievable changes through optimal or worst management (USDA-SCS, 1993). Higher values of CN represent a land surface that generates more runoff (or allows less infiltration) than that generated from a surface with lower CN. For a specific soil type, changes in CN of +7 or −7 can be achieved through crop residue management, contour farming, terracing, soil compaction, addition of organic matter, cover management and surface roughness management. Table 1 lists the complete set of scenarios, with Scenario 16 representing the current state and Scenario 1 an estimate of the status under changed climate (Christensen et al., Reference Christensen, Hewitson, Busuioc, Chen, Gao, Held, Jones, Kolli, Kwon, Laprise, Magaña Rueda, Mearns, Menéndez, Räisänen, Rinke, Sarr, Whetton, Solomon, Qin, Manning, Chen, Marquis, Averyt, Tignor and Miller2007) with no change in land use. The model generates daily series of hydrological values. Statistical processing of these was by calculating annual means, maxima and minima and then summarizing these. Risks were estimated by fitting generalized extreme value distributions using GenStat 12th Edition (Payne et al., Reference Payne, Harding, Murray, Soutar, Baird, Glaser, Channing, Welham, Gilmour, Thompson and Webster2009)
Scenarios of land use and climate investigated.

Characteristics of soils of Nyando basin, Western Kenya.

USLE: Universal soil loss equation.
Source: FAO (1988) and Batjes & Gicheru (Reference Batjes and Gicheru2004).
RESULTS
Running the model for 18 scenarios using daily data for 27 years across 50 sub-basins generates a very large array of data. Here we present examples which illustrate some key patterns and conclusions. Within the model, temperature increases can be expected to change basin hydrology through changes in evapotranspiration. We found those effects to be minimal and hence do not consider temperature change scenarios further here. Outside the model, it is expected that changes in temperature would also influence vegetation cover. These types of changes are not handled by SWAT.
Water and sediment yield across the basin
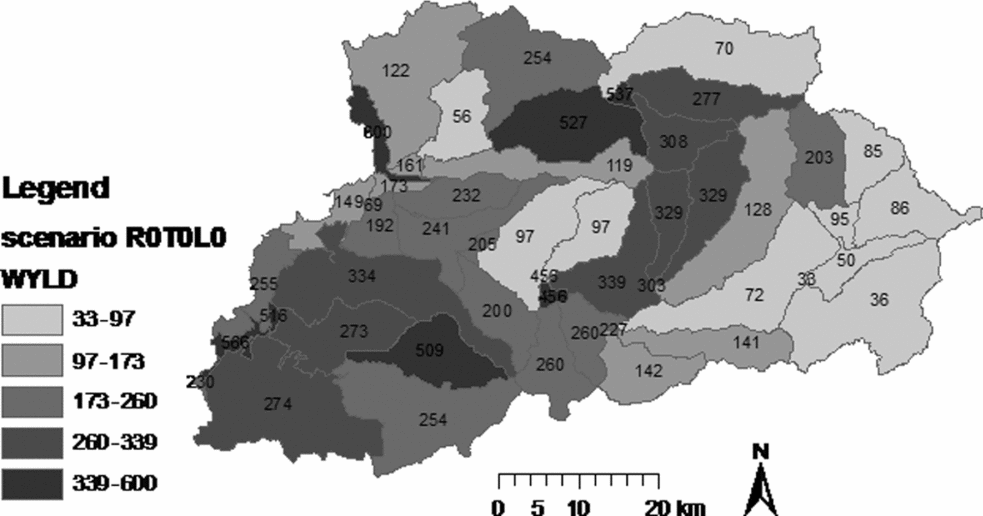
The total water yield (WYLD) in mm year−1 is made up by the surface runoff (SURQ) and groundwater contribution to streamflow (GWQ). From the viewpoint of making water available, WYLD as well as the relative proportion of SURQ and GWQ are important. It is desirable to increase WYLD while keeping the SURQ component low. This regulates or buffers the flow and ensures higher flows during the dry season and moderate peaks during rainy season.
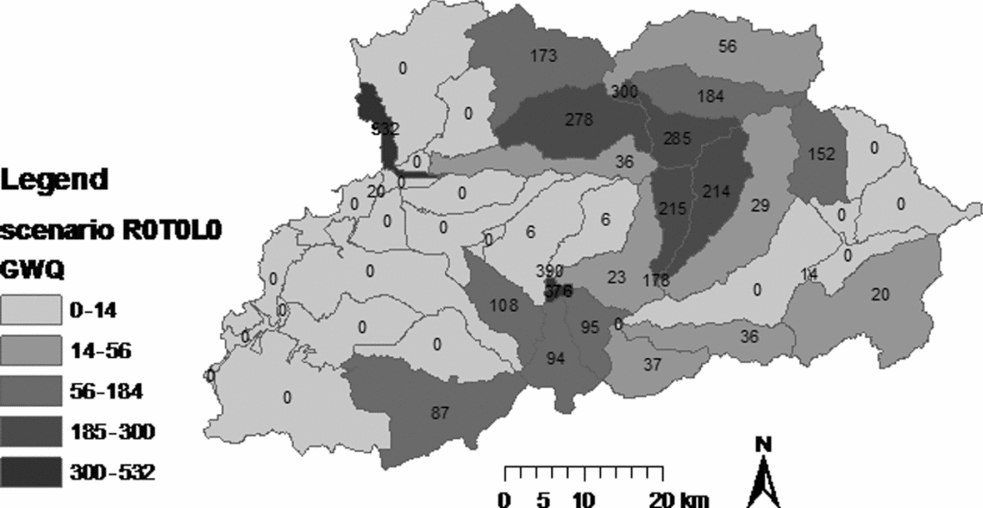
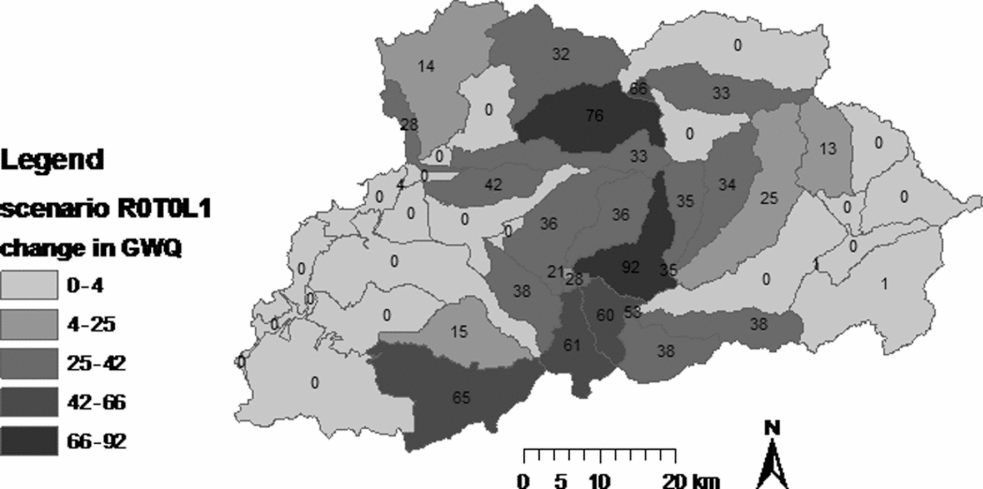
The spatial distribution of total water yield and groundwater runoff averaged over the 27 years of simulation is shown in Figure 4 and 5. There are two main areas contributing high amounts of water yield: the areas on the highlands where rainfall is higher and the areas in the lowlands where rainfall is lower but the infiltration is lower due to the prevailing soil and land use types. Figure 5 shows that in the lowlands, the groundwater yield is low indicating that most of the rainfall is converted to surface runoff. Figure 6 shows how treatment of the land surface to allow more infiltration can increase the groundwater runoff yield from the sub-basins some of which had zero groundwater discharge for the base case.
Simulated annual total water yield (WYLD) (mm year−1) for the base case with rates shown in each sub-basin in Nyando basin, Western Kenya.

Simulated annual groundwater contribution to streamflow (GWQ) (mm year−1) for the base case with rates shown in each sub-basin of Nyando basin, Western Kenya.

Change in annual groundwater contribution to streamflow (GWQ) (mm year−1) over baseline with rates shown in each sub-basin for R0T0L1 scenario in Nyando basin, Western Kenya.

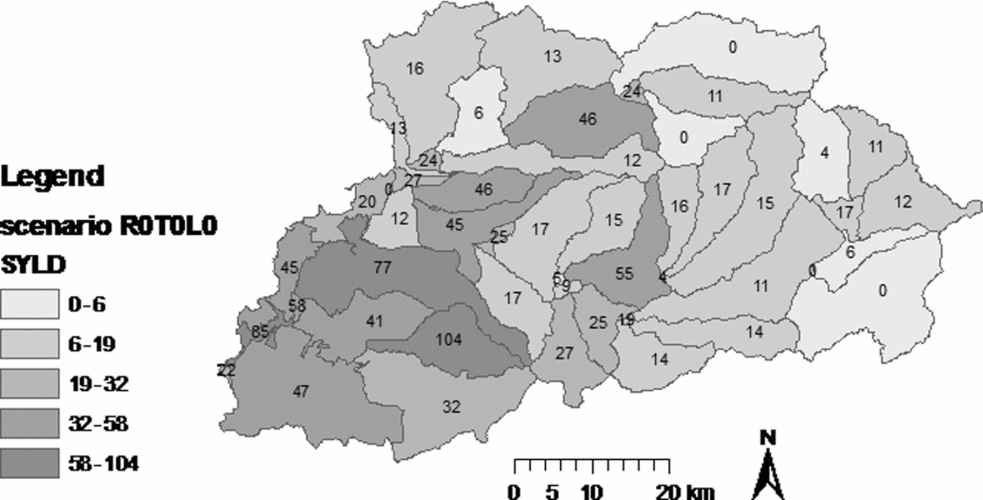
The average sediment yield also varies by sub-basin across the catchment from 0.01 tons ha−1 to 104 tons ha−1 (Figure 7). Young (Reference Young1989) suggested 11.2 t ha−1 year−1 as a tolerable rate of erosion and only 11 out of 50 sub-basins have estimated average rates below this. The sub-basins generating high sediment yields are not located predominantly on the steepest slopes as might be expected. Rather, the low lying areas below 1500 m generate the highest amount of sediment due to poor soil condition. Forested upper slopes generate least sediment highlighting the importance of tree cover. This result is consistent with that previously reported (World Agroforestry Centre, 2006).
Simulated annual sediment yield (SYLD) (t ha−1 year−1) under base scenario with rates shown in each sub-basin for Nyando basin, Western Kenya.

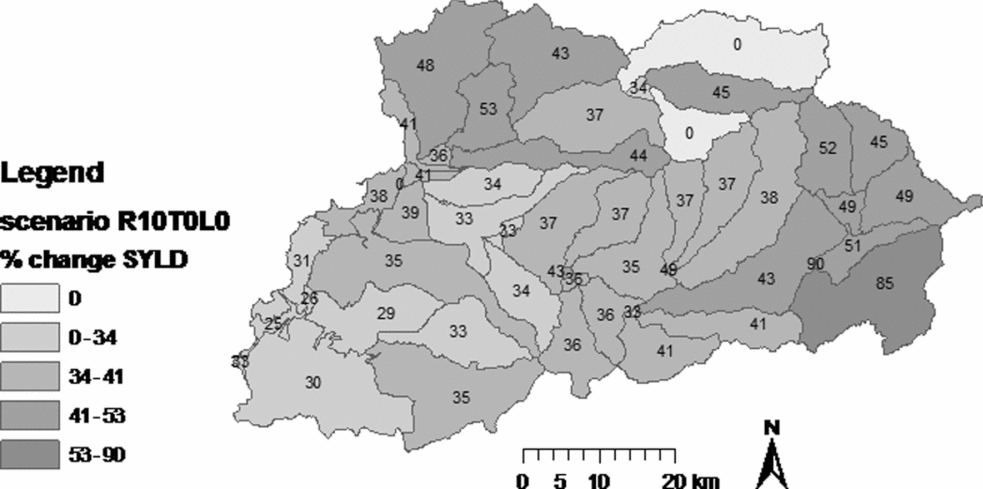
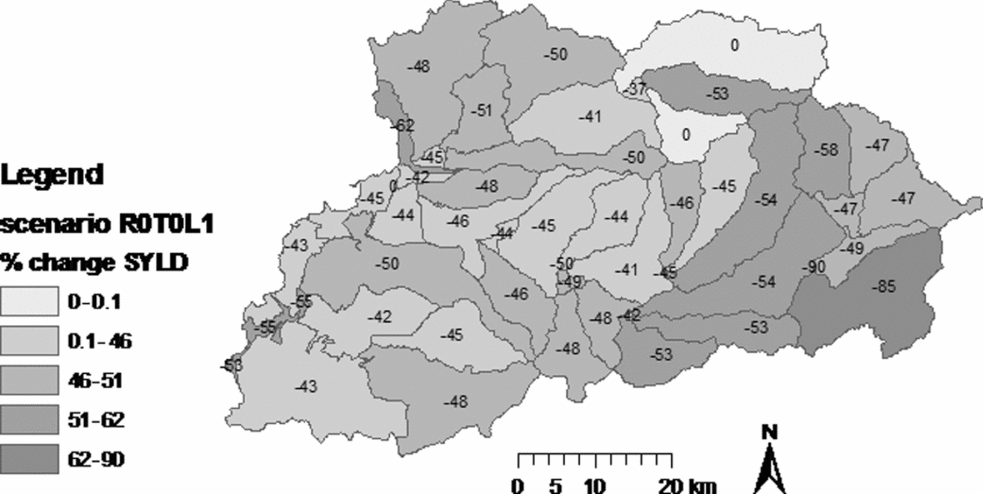
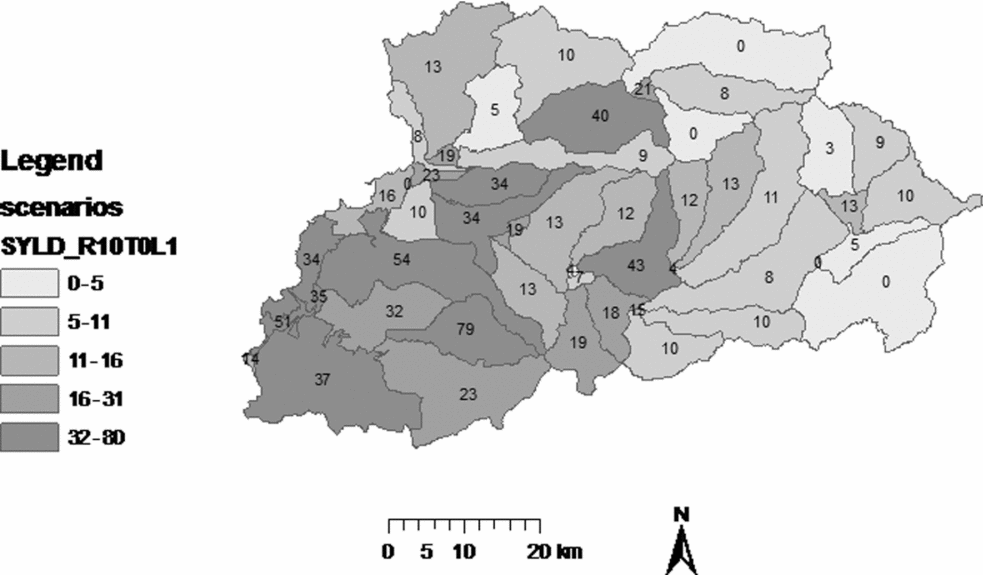
Increase in rainfall under climate change will increase sediment yields (Figure 8). Again there is spatial variation in the percentage increase. It is over 30% in those lowland areas with the high base sediment yield. Under current climate, there appears to be ample scope for reducing erosion through improved land management (Figure 9). Although the higher rainfall expected under climate change would lead to increased soil erosion, improvement of soil infiltration through improved land management could compensate for the increased erosion. This is illustrated with the results of sediment yield for scenario R10T0L1 (Figure 10) where the values are of the similar magnitude to those of the base case.
Percent increase in annual sediment yield (SYLD) over baseline for the scenario R10T0L0 which represents a 10% increase in rainfall, Nyando basin, Western Kenya.

Percent change in sediment yield (SYLD) over baseline for the scenario R0T0L1 due to a reduction in curve number by 7 units, representing improved infiltration through land management, Nyando basin, Western Kenya.

Sediment yield (SYLD) (t ha−1 year−1) for the scenario R10T0L1 which represents a both a 10% increase in rainfall and reduction in curve number by 7, Nyando basin, Western Kenya.

Frequency analysis of flows at the outlet
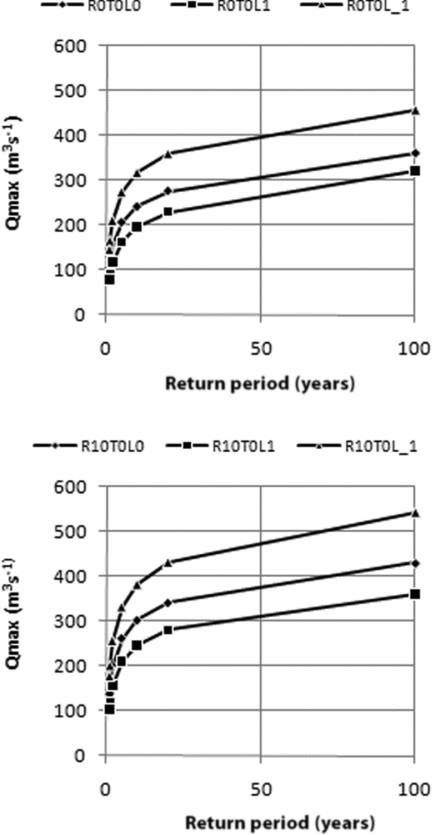
The outlet chosen for this study is the river gauging station 1GD03 near Ahero (Figure 1), close to where the Nyando drains into Lake Victoria. The Kano Plains, which comprise the areas below 1150 m asl, are at risk of experiencing floods every year during the rainy season (Ochola and Kerkides, Reference Ochola and Kerkides2003). The dense population as well as paddy rice farming schemes depend on water from the lower section of River Nyando. Hence high and low flows and the way these are influenced by management upstream are important. Flood and low flows are often evaluated in terms of risk, expressed as return period (Maidment, Reference Maidment1993). The annual maximum discharge (Q max) with a return period of 100 years has a 1% chance of being equalled or exceeded in any one year. Figure 11 shows the return periods of annual maximum flow for six scenarios. The most striking feature of the results is that the curves for different scenarios are almost parallel. This means that impacts of climate and land use change can be summarized and displayed by focusing on a single return period or on means of the distributions. As expected, both the land use change and climate change scenarios are predicted to influence flood risk. An increase in the annual maximum discharge with a return period of 100 years caused by rainfall increase of 10% can be compensated by managing the land use to allow more infiltration.
Frequency curves of peak discharge (Qmax) for six scenarios (a) base climate with base infiltration (◆), improved infiltration (■) and reduced infiltration (▲) (b) 10% rainfall increase with base infiltration (◆), improved infiltration (■) and reduced infiltration (▲)

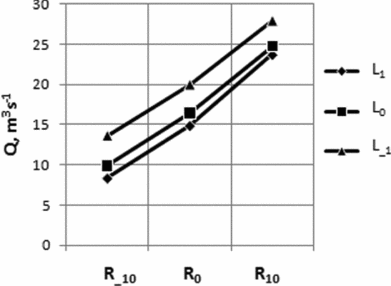
Figure 12 shows how changes in rainfall and land use impact on the flow at the outlet of Nyando basin. A 10% increase in rainfall is predicted to give a 50% increase in mean flow. This increase will not be compensated by a change in land use. This result is consistent with expectations as the land use change modelled is a change that affects infiltration. This changes the partitioning of rainfall between ground and overland flow, which should not have much impact on the overall mean outflow. A change in land use that causes less infiltration leads to increased mean flow. Less water is made available for soil moisture recharge and hence evapotranspiration is reduced. The converse is also true. Increased infiltration leads to lower mean flow for the same reason. However the increase in mean flow caused by reduced infiltration is approximately twice as much as the reduction caused by increased infiltration.
Impact of change in rainfall (R−10, R0, R10) and infiltration of land surface (L1, L0, L−1) on mean flow (Q) at basin outlet for base temperature T0.

DISCUSSION
We have presented results that indicate the value of long-term climate and ancillary spatial data in understanding potential impacts of climate change on watershed hydrology and their interaction with land use. These results are based on a complex hydrological model, spatially interpolated rainfall data, simplifying assumptions about the nature of climate change, and so on. How valid are the conclusions? To some extent, this is a question about modelling and the extent to which a model has to be ‘correct’ to be useful. All models are an approximation and their value must be judged relative their intended use (Singh and Frevert, Reference Singh, Frevert, Singh and Frevert2006). In this study we have been using models and data approximated in various ways to investigate possible patterns of response to climate and land use change, rather than to make precise predictions for specific locations. There are three reasons we believe this is valid, even though it is not possible to do a direct validation (comparison of model and observed values) for the land use and climate scenarios examined here. Firstly the SWAT model itself has been extensively tested and validated in many other contexts (Jayakrishnan et al., Reference Jayakrishnan, Srinivasan, Santhi and Arnold2005, Ma et al., Reference Ma, Xu and van Noordwijk2010, Sang et al., Reference Sang, Gathenya and Ndegwa2007, Setegn et al., Reference Setegn, Srinivasan and Dargahi2008). Second each of the data layers input has also been independently validated in previous studies (Muthusi et al., Reference Muthusi, Gathenya, Gadain, Kaluli and Lenga2005, Sang et al., Reference Sang, Gathenya and Ndegwa2007). Thirdly, the SWAT model was calibrated to this particular basin in a separate study (Sang, et al., Reference Sang, Gathenya and Ndegwa2007; Swallow et al., Reference Swallow, Sang, Nyabenge, Bundotich, Duraiappah and Yatich2009).
In watershed models, uncertainties usually arise from randomness of natural systems, poor data quality, poor choice of model parameters and a model structure that does not describe reality (Singh and Frevert, Reference Singh, Frevert, Singh and Frevert2006). SWAT is a model that was developed in the USA and has been applied all over the world. There are some routines that are inherently better suited to land use conditions in the USA, but generally the model performs well even outside USA. For the Nyando basin, our attempt to use 30 years of hydrometeorological data from multiple stations meant that we had to deal with some portions of data whose quality was questionable. Improving the rainfall input could attempt to take better account of spatial correlation in daily rainfalls, as this has an important effect on basin runoff (Obled et al., Reference Obled, Wendling and Beven1994). The analysis could also be made more refined through use of a higher resolution land use map and soil map. However we believe the independent validation of the model and inputs is sufficient to justify conclusions.
The first set of results (Figure 4 to Figure 10) highlights the spatial heterogeneity in the responses to climate or land use change. They could be interpreted in terms of ‘spatial risk’ – if a particular intervention targeted a sub-basin selected at random, what is the chance of it having a desired hydrological impact? Interventions are rarely randomly located, but their location is often based on characteristics unconnected with hydrological properties, such as the political concerns that often drive location of development interventions. The results show that the importance of spatial targeting of, for example, soil conservation through land use interventions. The locations that might have the largest responses when one targets soil erosion control are different from those which would lead to an improvement of dry weather streamflow. The results illustrate the spatial heterogeneity in the balance of targeting conservation (maintenance of the current state) versus change (improvement from the current state). If the analysis was to be used for targeting interventions in the Nyando basin, then socio-economic factors should also be considered – for example land tenure and other factors that influence the ease with which land use and land management can be influenced (World Agroforestry Centre, 2006).
The spatial scale used in this analysis is the sub-basin of average size 70 km2. SWAT could be used with smaller sub-basins but the available rainfall station density does not justify a finer subdivision. Finer resolution of rainfall data inputs could be achieved by using satellite-based rainfall estimates, but the time series used in this analysis would have to start from 1995 when such data became available. SWAT can accept both vector- and raster-based land cover and soil data but the outputs of water balance and sediment yield are on the basis of HRUs or sub-basins (Neitsch et al., Reference Neitsch, Arnold, Kiniry, Srinivasan and Williams2002a). Whatever the spatial resolution of the basin-level analysis, interventions would also need spatial planning at farm level. The analysis presented here show the potential impacts of, for example, increasing infiltration though changed land management but not how to achieve such changes in infiltration.
The second set of results presented (Figure 11 and 12), for flow at the outlet, illustrate the relative impacts of land use and climate change on river flow. The results are qualitatively similar to those found by Ma et al. (Reference Ma, Xu and van Noordwijk2010) in the very different context of the eastern Himalayas – that realistic land use changes may have a larger impact on hydrology and important characteristics of river flow than climate change. In the case of the Nyando basin there is evidence that the effects of increased rainfall on flood risk could be offset by improved land management. The results also show that land use change could have even larger impacts than climate change on flood risk. This does not in any way reduce the problems posed by climate change, but highlights the fact that climate change and responses to it cannot be considered in isolation from other changes. Evaluating the risks under different scenarios reveals interactions that are not always intuitive.
The two sets of results together illustrate why there is much current attention on means for ensuring provision of environmental services (Ferraro, Reference Ferraro2009; United Nations, 2009). Those dependent on the river near the outflow are highly dependent on land use decisions by people managing the upper basin. Land managers in upper parts of the basin will normally use the land to meet their own objectives of food security and income generation and will not be concerned about watershed services delivered to those living downstream unless some form of compensation or reward is provided to make them implement conservation practices above what is socially or legally acceptable.
The scenarios are simplistic as any of these changes will produce feedbacks and interactions with other components not considered. For example, change in land use that affects CN and infiltration may also affect (or be brought about by) changes in vegetation, which in turn may also affect evapotranspiration (Dale, Reference Dale1997). An improved analysis would build such feedback into the scenarios.
CONCLUSIONS
The use of physically based distributed watershed models allows the hydrological behaviour of a watershed to be studied and the impacts of land management decisions to be estimated without necessarily implementing the changes on the ground. In this study we have demonstrated that SWAT model could be used to provide an understanding of the relative impacts of land use and climate change on watershed services and how the impacts are spatially distributed on the watershed. The results show that soil erosion hotspots are dependent on the land use and soil conditions, and there is a need to target conservation practices so as to achieve optimum results from the investments made in soil conservation. Whereas climate change is perceived by many to be a major threat to watershed services, it is apparent for this analysis that land use change could have impacts of similar or greater magnitude. Land management practices aimed at enhancing infiltration could offset the impacts of climate change.
Acknowledgements
This study was supported by funds provided by the African Development Bank to the ASARECA project ‘Managing Uncertainty: Innovation Systems for Coping with Climate Variability and Change’ implemented by ICRISAT. The Kenyan Ministry of Water and Irrigation and the Kenya Meteorological Department are acknowledged for providing the streamflow and meteorological data used for this study.