Implications
Sheep are an important part of the global agricultural economy. To the best of our knowledge genome-wide association study for computed tomography-based productivity traits, for a UK terminal sire breed, has not been widely researched. The main aim of this work was to exploit improved genotypic tools, specifically the Illumina OvineSNP50 chip, allowing a simultaneous genotyping for up to 54 241 single nucleotide polymorphisms (SNPs) to identify those SNPs associated with growth, carcass composition, health and welfare traits of Texel sheep using de-regressed estimated breeding values of rams.
Introduction
Sheep are an important part of the global agricultural economy. They are particularly well adapted to convert short herbage to meat, milk and wool and they are very important to meet global needs for food security for an increasing population around the world (Hopkins and Lobley, Reference Hopkins and Lobley2009).
Currently the Texel breed is the most popular terminal sire breed in the UK accounting for 30% of all purebred rams used for crosses to maternal sheep breeds (Pollott, Reference Pollott2014) and is mainly selected for muscle growth and lean carcasses (Hopkins and Lobley, Reference Hopkins and Lobley2009).
There are only a few methods to predict body composition in live sheep. Over the last few decades mainly ultrasound technologies had been used on farm animals for evaluation of carcass composition (Silva, Reference Silva2016). However, computed tomography (CT), a non-invasive imaging technology, can accurately measure carcass traits in vivo such as muscle and fat (Bünger et al., Reference Bünger, Macfarlane, Lambe, Conington, Mclean, Moore, Glasbey and Simm2011), muscularity (Jones et al., Reference Jones, Lewis, Young and Wolf2002) and tissue weights (Macfarlane et al., Reference Macfarlane, Lewis, Emmans, Young and Simm2006). In addition, it has been evidenced the potential of CT scanning to improve eating quality and tissue distribution of sheep meats (Macfarlane et al., Reference Macfarlane, Lewis, Emmans, Young and Simm2009). As CT scanning is however more expensive than ultrasound, a two-step-procedure is recommended. Only the best 15% to 20% of selection candidate ram lambs measured by ultrasound would be subsequently CT scanned (Lewis, Reference Lewis2004).
Sheep genetics studies
Breeders focus sheep selection on production traits, including carcass composition and growth traits but also integrate other traits such as meat quality, disease resistance, lambing ease (LE) and survival (Bünger et al., Reference Bünger, Macfarlane, Lambe, Conington, Mclean, Moore, Glasbey and Simm2011). According to the animal quantitative trait loci (QTL) database there are currently (06/2017) 1515 sheep QTLs curated in the animal QTL database (Hu et al., Reference Hu, Park, Wu and Reecy2013) representing 222 different sheep traits, reported in 126 publications. However, one of the main limitations of unscrambling the genetic architecture underlying production traits in sheep has been the relative lack of information on the sheep genome in addition to the lack of accurate phenotypic data obtained (Zhang et al., Reference Zhang, Liu, Zhao, Ren, Xu, Lu, Zhang, Zhang, Wei, Lu, Zheng and Du2013).
Currently, knowledge of the major genes or QTL associated with carcass composition and growth traits in sheep is limited (Zhang et al., Reference Zhang, Liu, Zhao, Ren, Xu, Lu, Zhang, Zhang, Wei, Lu, Zheng and Du2013). Walling et al. (Reference Walling, Visscher, Wilson, McTeir, Simm and Bishop2004) pioneered the first accounts of QTL studies for growth and carcass conformation traits in domesticated sheep covering several genomic regions, which led to characterization of the Texel muscling QTL (TM-QTL).
With the advent of genome-wide panels of SNPs and using the approach of a genome-wide association study (GWAS), it has become possible to identify and localize QTLs for complex traits in many livestock species (Georges, Reference Georges2007). However, to date, only a small number of GWASs in sheep have been conducted because of either limited information available for the sheep genome and funding. These studies have been mainly focused on sheep growth, ultrasound-measured meat traits and body composition traits (Cavanagh et al., Reference Cavanagh, Jonas, Hobbs, Thomson, Tammen and Raadsma2010; Zhang et al., Reference Zhang, Liu, Zhao, Ren, Xu, Lu, Zhang, Zhang, Wei, Lu, Zheng and Du2013; Bolormaa et al., Reference Bolormaa, Hayes, van der Werf, Pethick, Goddard and Daetwyler2016; Matika et al., Reference Matika, Riggio, Anselme-Moizan, Law, Pong-Wong, Archibald and Bishop2016)
Moreover, GWAS with high accuracy CT measured body composition traits are still very rare in the literature. Donaldson et al. (Reference Donaldson, Lambe, Maltin, Knott and Bunger2014) used spine characteristics measured from X-ray CT scans in order to investigate if there were any subsequent associations between TM-QTL inheritance and underlying spine characteristics (Donaldson et al., Reference Donaldson, Lambe, Maltin, Knott and Bunger2014). Also, Cavanagh et al. (Reference Cavanagh, Jonas, Hobbs, Thomson, Tammen and Raadsma2010) performed a QTL mapping study in sheep based on in vivo obtained CT data providing predictions for 13 traits describing major fat depots, lean muscle, bone, body proportions and BW; they identified three highly significant, 15 significant and 11 suggestive QTL on eleven chromosomes. But, no tissue-specific QTL were identified. Furthermore, Matika et al. (Reference Matika, Riggio, Anselme-Moizan, Law, Pong-Wong, Archibald and Bishop2016) conducted recently a GWAS for carcass composition phenotypes, including bone, fat and muscle components, which were captured using CT. The GWAS analyses revealed multiple SNPs and QTL that were associated with effects on carcass composition traits and were significant at the genome-wide level.
In this study we performed a GWAS to identify those SNPs associated with growth, carcass composition, health and welfare traits, including two CT measured phenotypes, of Texel sheep using de-regressed estimated breeding values (EBVs) of rams.
Material and methods
Traits and phenotypes
A total of 384 Texel rams descended from 252 sires and 351 dams were analysed for ten productivity traits including two CT measured traits. These rams represent a group of well-monitored animals as only a proportion (10% to 20%) of the initial selection candidates will be put forward to CT scanning based on ultrasound results.
The phenotypic data were provided by the Signet Sheep breeder Service and comprised EBVs progeny test derived for: birth weight (BWT), 8-week BW (EWW) and scan weight, which is the live weight at US scanning at about 21 weeks of age. These were considered as growth traits. As carcass traits were used US measured fat depth (FD) and muscle depth (MD) which are obtained by US-scanning at the at the third lumbar vertebra at 90° to the backbone. The CT measured carcass traits: fat weight (FW), CT lean weight (LW) and the muscularity score (MU), a measure of carcass shape (Bünger et al., Reference Bünger, Macfarlane, Lambe, Conington, Mclean, Moore, Glasbey and Simm2011), were also included. Details on the CT measured traits have been reported earlier (Bünger et al., Reference Bünger, Macfarlane, Lambe, Conington, Mclean, Moore, Glasbey and Simm2011). Faecal egg count (FEC) as a measure of worm egg count in sample from lambs at 21 weeks of age, and, LE as a direct assessment of the ease with which ram progeny will be born.
Genome-wide association study accuracy can also be affected by systematic environmental effects. De-regressed EBVs are an alternative to raw phenotypic measurements, because they represent aggregate phenotypes adjusted for systematic environmental effect. The phenotypic data used therefore consisted of de-regressed EBVs of standard commercial traits.
Statistical model for de-regressed breeding values
The official Texel EBVs were used, those breeding values were derived from the following model:
 $${\bf{y\,{\equals}\,Xb{\plus}Za{\plus}e,$$
where y is the vector of phenotypic observations for one of the analysed traits, b the vector of fixed effects with design matrix X (relating observations to fixed effects), which varied depending on the trait, a the vector of random animal effects, with design matrix Z (relating observations to random effects) and e the vector of random residuals. The list of effects is summarized in the Supplementary Table S1.
Random effects are assumed to be normally distributed with zero means and the following covariance structure:
 $$Var\left[ {\matrix{ {\bf a} \cr {\bf e} \cr } } \right]{\equals}\left[ {\matrix{ {{\bf A}\sigma _{a}^{2} } & 0 \cr 0 & {{\bf I}\sigma _{e}^{2} } \cr } } \right]$$
where A is the pedigree-based relationship matrix,
 $$\sigma _{a}^{2} $$
the genetic variance and
 $$\sigma _{e}^{2} $$
the residual variance.
The software package MIX99 was used for de-regression (Lidauer et al., Reference Lidauer, Mantysaari and Stranden2011), using a full animal pedigree with effective offspring contributions (EOC) as weighting factors. The de-regression procedure was based on the method published by Jairath et al. (Reference Jairath, Dekkers, Schaeffer, Liu, Burnside and Kolstad1998), involving solving the mixed model equations with a full pedigree to obtain the right-hand side or de-regressed EBVs. Thus deregressed proofs represent daughters averages adjusted for fixed effects and contributions from parents and relatives in the pedigree (Jairath et al., Reference Jairath, Dekkers, Schaeffer, Liu, Burnside and Kolstad1998).
Effective offspring contributions were calculated as:
 $$\eqalignno{ & EOC_{i} \,{\equals}\,{{rel_{i} \cdot kdau} \over {1{\minus}rel_{i} }} \cr & kdau\,{\equals}\,{{4\,{\minus}\,h^{2} } \over {h^{2} }} $$
where rel i is the reliability of EBV for animal i and h 2 is the heritability of one of the analysed traits.
The use of effective daughter or progeny contribution as a weighting factor is used to avoid biases in sire variances (Fikse and Banos, Reference Fikse and Banos2001). The EOC provides a measure of the precision of the daughter information used to compute the de-regressed EBV of the animal as the estimates of reliability used in the computation accounts for factors such as contemporary group structure for the ram’s daughters, the correlation between observations on the same daughter and the reliability of the performance of the daughters’ dams.
A Shapiro–Wilk W-statistic test, conducted using the R-package (R Core Team, 2013) was used to test data distribution for normality (Royston, Reference Royston1995). Traits not normally distributed were rank transformed to a normal distribution for their use in subsequent analysis. This rank-transformation method has been reported to give a consistent performance in identifying causal polymorphisms with a slight increase in false positive rate (Goh et al., Reference Goh, Yap, Amos, Wu, Broderick, Gorlov, Gu, Eisen, Dong, Zhang, Gu, Vijayakrishnan, Sullivan, Matakidou, Wang, Mills, Doheny, Tsai, Chen, Shete, Spitz, Houlston, Barrett, Hansoul, Nicolae, Cho, Duerr, Rioux, Brant, Silverberg, Taylor, Barmada, Bitton, Dassopoulos, Datta, Green, Griffiths, Kistner, Murtha, Regueiro, Rotter, Schumm, Steinhart, Targan, Xavier, Libioulle, Sandor, Lathrop, Belaiche, Dewit, Gut, Heath, Laukens, Mni, Rutgeerts, Gossum, Zelenika, Franchimont, Hugot, Vos, Vermeire, Louis, Belgian-French, Cardon, Anderson, Drummond, Nimmo, Ahmad, Prescott, Onnie, Fisher, Marchini, Ghori, Bumpstead, Gwilliam, Tremelling, Deloukas, Mansfield, Jewell, Satsangi, Mathew, Parkes, Georges, Daly, Bernardo, Crowther-Swanepoel, Broderick, Webb, Sellick, Wild, Sullivan, Vijayakrishnan, Wang, Pittman, Sunter, Hall, Dyer, Matutes, Dearden, Mainou-Fowler, Jackson, Summerfield, Harris, Pettitt, Hillmen, Allsup, Bailey, Pratt, Pepper, Fegan, Allan, Catovsky, Houlston, Frayling, Nair, Duffin, Helms, Ding, Stuart, Goldgar, Gudjonsson, Li, Tejasvi, Feng, Ruether, Schreiber, Weichenthal, Gladman, Rahman, Schrodi, Prahalad, Guthery, Fischer, Liao, Kwok, Menter, Lathrop, Wise, Begovich, Voorhees, Elder, Krueger, Bowcock, Abecasis, Bakker, Ferreira, Jia, Neale, Raychaudhuri, Voight, Feingold, Diao, Lin, Labbe, Wormald, Peng, Yu, Dehoff, Amos, Zhang, Liu, Chen, Deng, Purcell, Neale, Todd-Brown, Thomas, Ferreira, Bender, Maller, Sklar, Bakker, Daly and Sham2009). This method was used because according to Goh et al. (Reference Goh, Yap, Amos, Wu, Broderick, Gorlov, Gu, Eisen, Dong, Zhang, Gu, Vijayakrishnan, Sullivan, Matakidou, Wang, Mills, Doheny, Tsai, Chen, Shete, Spitz, Houlston, Barrett, Hansoul, Nicolae, Cho, Duerr, Rioux, Brant, Silverberg, Taylor, Barmada, Bitton, Dassopoulos, Datta, Green, Griffiths, Kistner, Murtha, Regueiro, Rotter, Schumm, Steinhart, Targan, Xavier, Libioulle, Sandor, Lathrop, Belaiche, Dewit, Gut, Heath, Laukens, Mni, Rutgeerts, Gossum, Zelenika, Franchimont, Hugot, Vos, Vermeire, Louis, Belgian-French, Cardon, Anderson, Drummond, Nimmo, Ahmad, Prescott, Onnie, Fisher, Marchini, Ghori, Bumpstead, Gwilliam, Tremelling, Deloukas, Mansfield, Jewell, Satsangi, Mathew, Parkes, Georges, Daly, Bernardo, Crowther-Swanepoel, Broderick, Webb, Sellick, Wild, Sullivan, Vijayakrishnan, Wang, Pittman, Sunter, Hall, Dyer, Matutes, Dearden, Mainou-Fowler, Jackson, Summerfield, Harris, Pettitt, Hillmen, Allsup, Bailey, Pratt, Pepper, Fegan, Allan, Catovsky, Houlston, Frayling, Nair, Duffin, Helms, Ding, Stuart, Goldgar, Gudjonsson, Li, Tejasvi, Feng, Ruether, Schreiber, Weichenthal, Gladman, Rahman, Schrodi, Prahalad, Guthery, Fischer, Liao, Kwok, Menter, Lathrop, Wise, Begovich, Voorhees, Elder, Krueger, Bowcock, Abecasis, Bakker, Ferreira, Jia, Neale, Raychaudhuri, Voight, Feingold, Diao, Lin, Labbe, Wormald, Peng, Yu, Dehoff, Amos, Zhang, Liu, Chen, Deng, Purcell, Neale, Todd-Brown, Thomas, Ferreira, Bender, Maller, Sklar, Bakker, Daly and Sham2009) for small sample size or genetic effects, the improvement in sensitivity for rank transformation outweighs the slight increase in false positive rate.
Genotyping
All rams were genotyped with the ovine 50 k SNP chip (54 241 SNPs across the genome with an average of 20.4 SNPs/Mb) by AgResearch. The order of the SNPs was based on the Ovis_aries_4.0 assembly released by the International Sheep Genomics Consortium (Jiang et al., Reference Jiang, Xie, Chen, Talbot, Maddox, Faraut, Wu, Muzny, Li, Zhang, Stanton, Brauning, Barris, Hourlier, Aken, Searle, Adelson, Bian, Cam, Chen, Cheng, DeSilva, Dixen, Dong, Fan, Franklin, Fu, Fuentes-Utrilla, Guan, Highland, Holder, Huang, Ingham, Jhangiani, Kalra, Kovar, Lee, Liu, Liu, Lu, Lv, Mathew, McWilliam, Menzies, Pan, Robelin, Servin, Townley, Wang, Wei, White, Yang, Ye, Yue, Zeng, Zhou, Hansen, Kristiansen, Gibbs, Flicek, Warkup, Jones, Oddy, Nicholas, McEwan, Kijas, Wang, Worley, Archibald, Cockett, Xu, Wang and Dalrymple2014).
Quality control (QC) was performed with the GenABEL R package by considering genotypes of all rams (Aulchenko et al., Reference Aulchenko, Ripke, Isaacs and van Duijn2007). The QC excluded 1564 SNPs with call rates lower than 95%, 3891 SNPs with minor allele frequencies <1%, 98 X-linked SNPs that were likely to be autosomal (cut off odds>1000) and 777 SNPs not in Hardy–Weinberg equilibrium (P-value <1×10e−5). The call rate per individual was always higher than 90% so no animal was removed from the analysis. After applying these QC criteria 48 433 SNPs (89%) located on 26 autosomes and on the X chromosome were used in the subsequent analyses.
Statistical model for genome-wide association study
A Multidimensional Scaling Analysis was performed first to evaluate the genetic structure of the population. For each trait, SNP effects were then tested, by a single marker regression, with a mixed animal model including the genomic kinship matrix (identity by state) between the genotyped animals, adjusted for allele frequencies. Kinship was computed based on the method proposed by Astle and Balding (Reference Astle and Balding2009), using GenABEL, to control for population structure or polygenic effect (Astle and Balding, Reference Astle and Balding2009). The following model was used:
 $${\bf{y\,{\equals}\,X\bbeta {\plus}Zu{\plus}e}} $$
where y is the vector of de-regressed EBV of rams, β the vector of coefficients for the SNP effects, u the vector of random animal effects, e the vector of random residual effects and X and Z are incidence matrices relating observations to fixed and random animal effects, respectively. Random animal effect followed a normal distribution MVN(0, Gσ2 u ) where G is the genomic kinship matrix and σ2 u the polygenic variance; and the random residual effects of the model was assumed to be MVN(0, Iσ e 2), where σ e 2 is the residual variance and I is an identity matrix. Each trait was analysed separately and all analyses were run with GenABEL.
This procedure consisted of two steps: first it estimated the polygenic and residual variance, not accounting for marker effects and fitting the genomic kinship matrix in the model. Second, these estimated variance components were used to estimate all the marker effects (fitting in the model the genotypes and the previously estimated residuals). The jth marker was fitted in the single-marker-based linear mixed model without removing the jth marker from the G matrix. Evidence has shown analytically that, if variance components are kept constant, the estimation of the regression of phenotype on m markers is invariant with respect to whether or not the marker(s) tested for association is(are) included when constructing the G matrix (Gianola et al., Reference Gianola, Fariello, Naya and Schon2016).
Significance of the results was tested at genome-wise and chromosome-wise levels, including a strict Bonferroni correction for multiple-testing, corresponding to 1×10⁻⁶ and 3.5×10⁻⁵, respectively.
In order to address possible population stratification problems, the inflation in the test statistic was monitored with factor lambda, which does not depend on allele frequencies (Aulchenko et al., Reference Aulchenko, Ripke, Isaacs and van Duijn2007). The allele effects estimated by GenABEL refer to the least frequent allele in the population and are expressed in trait phenotypic standard deviation units. Genes located on or around the identified SNPs were examined using the ENSEMBL database and the Ovis_aries_3.1 and 4.0 assembly released by the International Sheep Genomics Consortium (Jiang et al., Reference Jiang, Xie, Chen, Talbot, Maddox, Faraut, Wu, Muzny, Li, Zhang, Stanton, Brauning, Barris, Hourlier, Aken, Searle, Adelson, Bian, Cam, Chen, Cheng, DeSilva, Dixen, Dong, Fan, Franklin, Fu, Fuentes-Utrilla, Guan, Highland, Holder, Huang, Ingham, Jhangiani, Kalra, Kovar, Lee, Liu, Liu, Lu, Lv, Mathew, McWilliam, Menzies, Pan, Robelin, Servin, Townley, Wang, Wei, White, Yang, Ye, Yue, Zeng, Zhou, Hansen, Kristiansen, Gibbs, Flicek, Warkup, Jones, Oddy, Nicholas, McEwan, Kijas, Wang, Worley, Archibald, Cockett, Xu, Wang and Dalrymple2014). And finally JBrowse was used to identify previously associated QTLs in the tagged regions (Skinner et al., Reference Skinner, Uzilov, Stein, Mungall and Holmes2009).
Results
Descriptive statistics
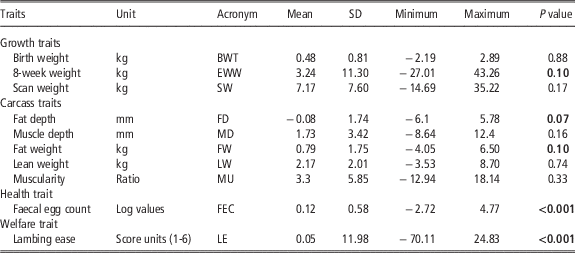
For the 10 analysed traits (de-regressed EBVs) the means and standard deviations are shown in Table 1. The normal distributions of the 10 traits were tested with the Shapiro–Wilk’s test (Table 1). For EWW, FD, FW, FEC and LE traits the null hypothesis of following a normal distribution was rejected according to a P value ⩽0.1, which has been previously suggested as an acceptable threshold for this type of analysis (Royston, Reference Royston1995). These records were rank-transformed to a normal distribution for their use in the subsequent analyses.
Descriptive statistics for the de-regressed estimated breeding values of the analysed traits

SD=phenotypic SD.
384 tested individuals. Significant P values, for Shapiro–Wilk’s W-statistic test, (P⩽0.1) in bold. Fat and Lean weights were measured by computed tomography (as described by Bünger et al., 2011).
Genome wide association analysis
A multidimensional scaling analysis using the GenABEL package showed that no genetic stratification was present in this population. Also, the average inflation factor (λ) was 1.008±0.007, with a maximum value of 1.021 for FEC and a minimum of 1 for FD, FW and MU. Therefore, the population structure is not expected to affect the results of GWAS in the present study.
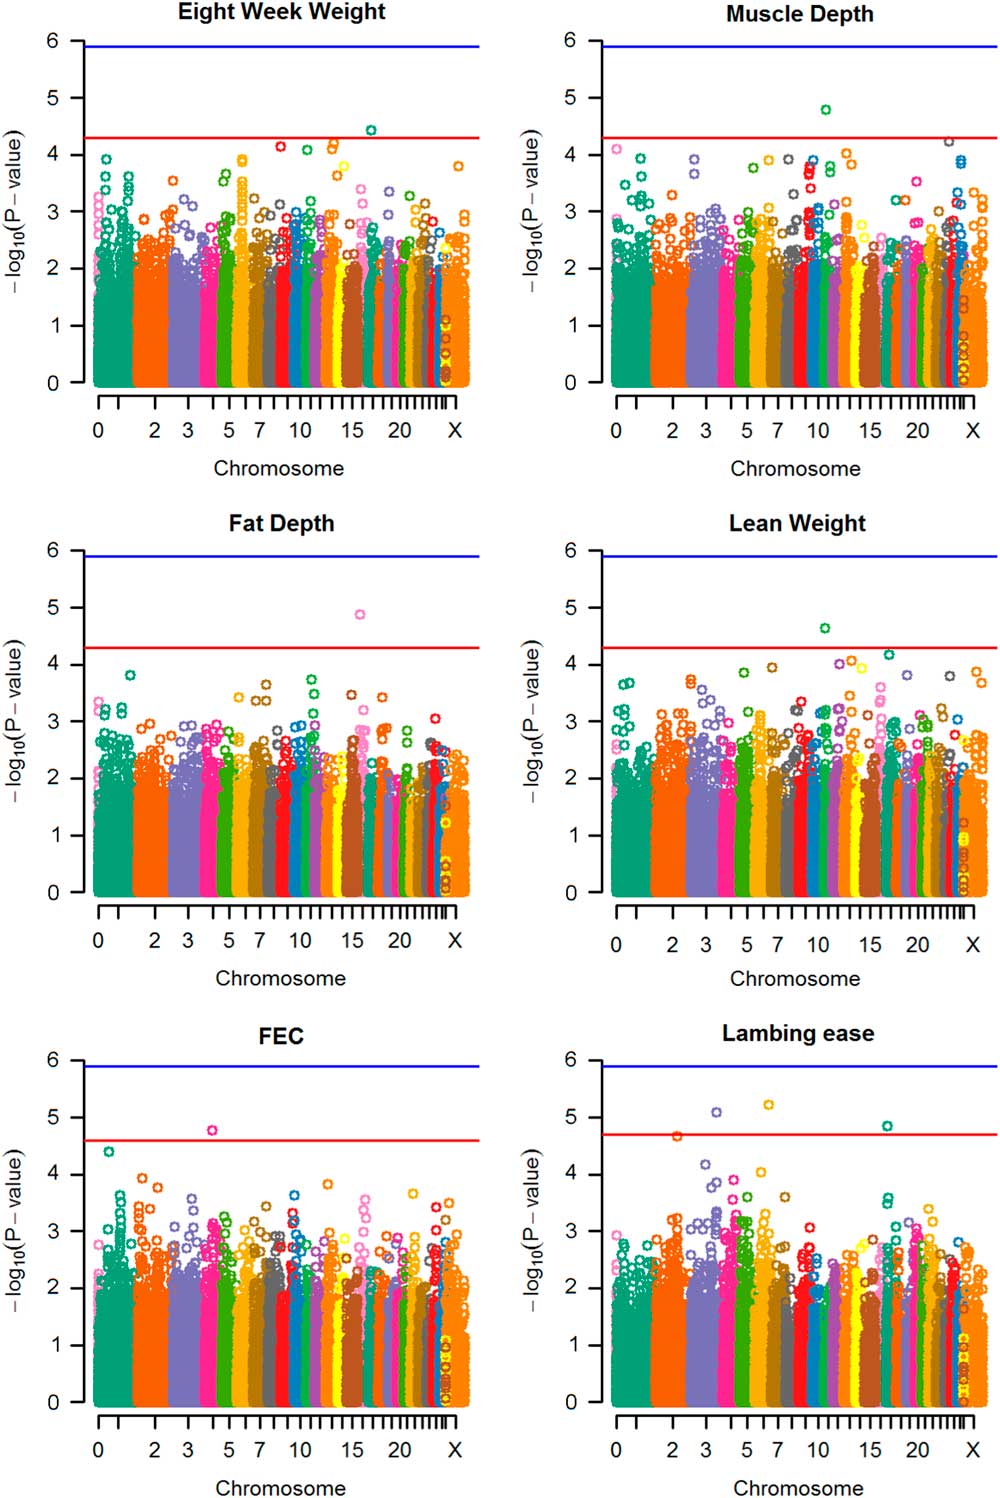
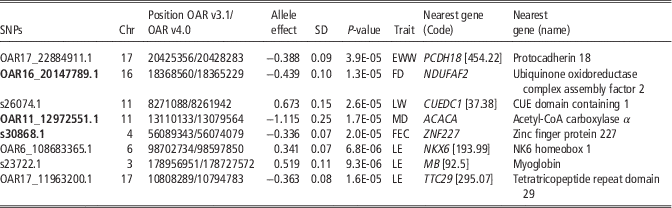
No genome-wise significant associations were found between any SNP and trait. However, eight chromosome-wise significant SNPs were found for EWW, FD, MD, LW, FEC and LE (Figure 1). These SNPs were located on chromosomes 3, 4, 6, 11, 16 and 17, respectively (Table 2). None of the associated SNPs found had been previously associated with any trait in sheep.
Manhattan plots for 8-week BW, fat depth, lean weight, muscle depth, faecal egg count and lambing ease traits. Blue (upper) line refers to the genome-wise threshold and the red (lower) line to the chromosome-wise significance threshold.

Chromosome-wide significant single nucleotide polymorphisms (SNPs) associated with important economic traits and size of estimated effects

Chr=chromosome; allele effect=deviations from the mean; SD=SD of the allele effect.
P-value for the significance of the association; units for FEC and LE on the transformed scale; SNPs located within known ovine genes are in bold; the nearest genes were identified using the ENSEMBL Genome Browser; the number in brackets is the distance from SNP to the nearest gene.
The proportion of total variance explained by each SNP was obtained by first scanning using the score test and then revaluating best hits, individually, using maximum likelihood with significant SNP allelic effect fitted as covariate. The variance explained for chromosome wise significant SNP associated with EWW, FD, LW, MD and FEC were 0.029, 061, 0.062, 0.060 and 0.051, respectively. And for LE, each significant marker explained a variance of 0.006, 0.038 and 0.013.
Discussion
Until very recently, limited information on the sheep genome and lack of phenotypic data for many important traits have resulted in only a few studies on SNPs associated with production and welfare traits in sheep (Zhang et al., Reference Zhang, Liu, Zhao, Ren, Xu, Lu, Zhang, Zhang, Wei, Lu, Zheng and Du2013). It has been suggested that the use of more precise phenotypes derived from CT measures will lead to more accurate phenotypes for genetic analyses (Cavanagh et al., Reference Cavanagh, Jonas, Hobbs, Thomson, Tammen and Raadsma2010).
To date, only a small number of GWAS in sheep have been conducted, those have been mainly focused on sheep growth, ultrasound-measured meat traits and body composition traits (Cavanagh et al., Reference Cavanagh, Jonas, Hobbs, Thomson, Tammen and Raadsma2010; Zhang et al., Reference Zhang, Liu, Zhao, Ren, Xu, Lu, Zhang, Zhang, Wei, Lu, Zheng and Du2013; Bolormaa et al., Reference Bolormaa, Hayes, van der Werf, Pethick, Goddard and Daetwyler2016; Matika et al., Reference Matika, Riggio, Anselme-Moizan, Law, Pong-Wong, Archibald and Bishop2016). Moreover, genetic analyses with high accuracy CT-measured body composition traits are still very rare in the literature (Walling et al., Reference Walling, Visscher, Wilson, McTeir, Simm and Bishop2004; Donaldson et al., Reference Donaldson, Lambe, Maltin, Knott and Bunger2014; Bolormaa et al., Reference Bolormaa, Hayes, van der Werf, Pethick, Goddard and Daetwyler2016; Matika et al., Reference Matika, Riggio, Anselme-Moizan, Law, Pong-Wong, Archibald and Bishop2016).
The main aim of the present study was to identify SNPs associated with traits currently in the selection index for a UK Terminal sire breed (Texel Sheep), including CT-based productivity traits. In the UK, CT scanning has been used in sheep breeding programmes since 2000. However, as CT scanning is more expensive than ultrasound, a two-step-procedure is recommended. Only the best 15% to 20% of selection candidate ram lambs measured by ultrasound are usually subsequently CT scanned (Lewis, Reference Lewis2004; Bünger et al., Reference Bünger, Macfarlane, Lambe, Conington, Mclean, Moore, Glasbey and Simm2011).
A total of 384 Texel rams were analysed for 10 productivity traits including two CT measured traits. It should be noted that the dataset used in the present study was limited in its size, largely due to the restricted availability of CT-measured rams, due to CT costs. However, because this study analysed a small group of preselected animals we acknowledged that the power to detect genome wide significant associations was diminished.
Genome wide association analysis
In the current study no genome-wise significant association for any of the analysed traits was found. However, eight chromosome-wise significant SNPs were found for: EWW, FD, MD, LW, FEC and LE. These SNPs were located on chromosomes 3, 4, 6, 11, 16 and 17, and were found to be either intronic or intergenic variants. None of the significant SNPs had been previously associated with any trait in sheep. However, chromosomes 11 and 16 have been previously tagged by SNPs associated with muscle, body and carcass weight (Cavanagh et al., Reference Cavanagh, Jonas, Hobbs, Thomson, Tammen and Raadsma2010).
We identified as candidate genes, those which were either directly tagged by a significant SNP (intronic variant) or those located within genomic regions of 30 kb up and downstream of an associated marker (Bolormaa et al., Reference Bolormaa, Hayes, van der Werf, Pethick, Goddard and Daetwyler2016). However, due to the current relatively poor status of the ovine genome annotation, little information regarding the function of the tagged genes was obtained.
Regions tagged for EWW and LE have not been previously associated with any significant growth or welfare traits. However, two identified markers for LE, on chromosomes 6 and 17 (OAR6_108683365.1 and OAR17_11963200.1), belong to suggestive QTLs previously associated with parasite resistance (Beh et al., Reference Beh, Hulme, Callaghan, Leish, Lenane, Windon and Maddox2002; Marshall et al., Reference Marshall, Maddox, Lee, Zhang, Kahn, Graser, Gondro, Walkden-Brown and Van Der Werf2009). Former studies have reported a low to moderate genetic correlation between LE and birth weight (Brown, Reference Brown2007), whereas a moderate genetic correlation between birth weight and parasite resistance has been suggested (Verbeek et al., Reference Verbeek, Kanis, Bett and Kosgey2011). However, more information would be needed to estimate the genetic correlation between parasite resistance and welfare traits such as LE.
The region tagged by OAR16_20147789.1, significantly associated with FD, is an intronic variant of the NDUFAF2 gene, which encodes a NADH dehydrogenase (ubiquinone) complex I, assembly factor 2, a molecular chaperone for mitochondrial complex I assembly. OAR16_20147789.1 is located in a QTL region, which has been previously associated with final BW, percent lean and subcutaneous fat area (Cavanagh et al., Reference Cavanagh, Jonas, Hobbs, Thomson, Tammen and Raadsma2010).
SNP s26074.1 was found to be significantly associated with LW. This SNP, is an intergenic variant, which is located in a QTL region formerly associated with body and carcass weight (Cavanagh et al., Reference Cavanagh, Jonas, Hobbs, Thomson, Tammen and Raadsma2010).
The region identified by SNP OAR11_12972551.1, was significantly associated with MD. This SNP is an intronic variant of the ACACA gene. ACACA encodes an acetyl-CoA carboxylase α, which is considered as a key enzyme of fatty acid synthesis in the mammary gland by catalysing the first step of fatty acid synthesis in mammalian cytosol. This gene has been described as a candidate gene for fat content in sheep, due to an observed significant association with variation in milk fat content, and change of fat composition in several sheep breeds (Bolormaa et al., Reference Bolormaa, Hayes, van der Werf, Pethick, Goddard and Daetwyler2016). Moreover, OAR11_12972551.1 is located in QTL regions associated with BW (Raadsma et al., Reference Raadsma, Thomson, Zenger, Cavanagh, Lam, Jonas, Jones, Attard, Palmer and Nicholas2009), fat synthesis (Bolormaa et al., Reference Bolormaa, Hayes, van der Werf, Pethick, Goddard and Daetwyler2016), internal fat amount and hot carcass weight (Cavanagh et al., Reference Cavanagh, Jonas, Hobbs, Thomson, Tammen and Raadsma2010).
Thus, results of significant associations with carcass traits provide evidence of a possible effect on FD, LW and MD by QTLs previously reported by Raadsma et al. (Reference Raadsma, Thomson, Zenger, Cavanagh, Lam, Jonas, Jones, Attard, Palmer and Nicholas2009), Cavanagh et al. (Reference Cavanagh, Jonas, Hobbs, Thomson, Tammen and Raadsma2010) and Bolormaa et al. (Reference Bolormaa, Hayes, van der Werf, Pethick, Goddard and Daetwyler2016).
Finally, SNP s30868.1 associated with FEC, is an intronic variant of the ZNF227 gene, which encodes a zinc finger protein 227, probably involved in transcriptional regulation. This gene is a paralogue of the ZNF229 gene, which has been previously associated with tuberculosis susceptibility in African human populations (Thye et al., Reference Thye, Vannberg, Wong, Owusu-Dabo, Osei, Gyapong, Sirugo, Sisay-Joof, Enimil, Chinbuah, Floyd, Warndorff, Sichali, Malema, Crampin, Ngwira, Teo, Small, Rockett, Kwiatkowski, Fine, Hill, Newport, Lienhardt, Adegbola, Corrah, Ziegler, Morris, Meyer, Horstmann and Hill2010). Also, s30868.1 tags a QTL region formerly reported to be associated with Immunoglobulin A level, an antibody that plays a crucial role in the immune function (Atlija et al., Reference Atlija, Arranz, Martinez-Valladares and Gutierrez-Gil2016). This suggests that there might be a worm resistance QTL on chromosome 4.
A large number of QTLs have been identified for traits related to parasite resistance in sheep (Beh et al., Reference Beh, Hulme, Callaghan, Leish, Lenane, Windon and Maddox2002; Marshall et al., Reference Marshall, Maddox, Lee, Zhang, Kahn, Graser, Gondro, Walkden-Brown and Van Der Werf2009; Atlija et al., Reference Atlija, Arranz, Martinez-Valladares and Gutierrez-Gil2016) suggesting that those traits are not determined by individual genes acting alone but rather by complex multigene interactions. Thus, further identification of SNPs in strong LD with the casual variants, could contribute to the implementation of these results in breeding schemes for the Texel breed population.
The proportion of total variance explained by the significant SNPs was low, which is in agreement with Hayes and Goddard (Reference Hayes and Goddard2010), who explained that a small number of markers with validated associations would explain a small portion of the genetic variance in complex traits (Hayes and Goddard, Reference Hayes and Goddard2010). This suggests that if alleles of large effect were present in our data, those would be in such a low frequency that they individually could only explain a small proportion of the variance.
Further improvement in sheep GWAS could be achieved by increasing the sample size and using the new ovine 700 K HD chip, which has a much denser distribution of SNPs across the genome and thus should have higher LD with the potential QTLs controlling the traits of interest.
The present study found eight chromosome-wise significant SNPs for six traits among them a CT measured trait (LW). Tagged regions on chromosomes 4, for worm resistance (FEC), 11 and 16, for carcass traits (MD, LW and FD), are consistent with other studies, where QTL regions have been found for Immunoglobulin A level and meat and carcass traits, respectively. Whereas regions tagged on chromosomes 3, 6 and 17 for LE and EWW can be considered novel.
Among the tagged genes ZNF227, ACACA and NDUFAF2 were found. Hence, these genes could be considered as candidate genes for future research to further dissect the genomic architecture of the traits.
Conclusions
This study is one of very few studies using CT-derived carcass traits and other productivity traits already integrated in the selection index for terminal sire sheep breeds. It revealed some significant associations between genomic markers and important traits in sheep production. Further fine mapping the regions around these markers could lead to the identification of causative genes and better molecular predictors of CT-based carcass composition, which might help to decrease phenotyping costs in the longer term. Results may also be integrated and inform genomic selection approaches and future SNP chip designs. The result may also guide similar studies in the other important Terminal Sire Breeds in the UK and beyond.
Acknowledgements
This work acknowledges the support of AHDB Beef and Lamb, HCC and QMS in funding the use of the CT scanner and their annual contribution towards the provision of performance recording services delivered by Signet Breeding Services. Many thanks to the British Texel Sheep society for their long-term support of the CT-scanning activities, for providing the tissue samples for subsequent DNA extraction and permitting the use of the genotypic information. Thanks go also to John McEwan and AgResearch in New Zealand for the genotyping. The research leading to this publication was supported by funds of the Scottish government (RERAD). DGH was supported by The Mexican National Council for Science and Technology. The opinions expressed and arguments employed in this paper are the sole responsibility of the authors and do not necessarily reflect those of RERAD.
Supplementary material
To view supplementary material for this article, please visit https://doi.org/10.1017/S1751731117002488